-
-
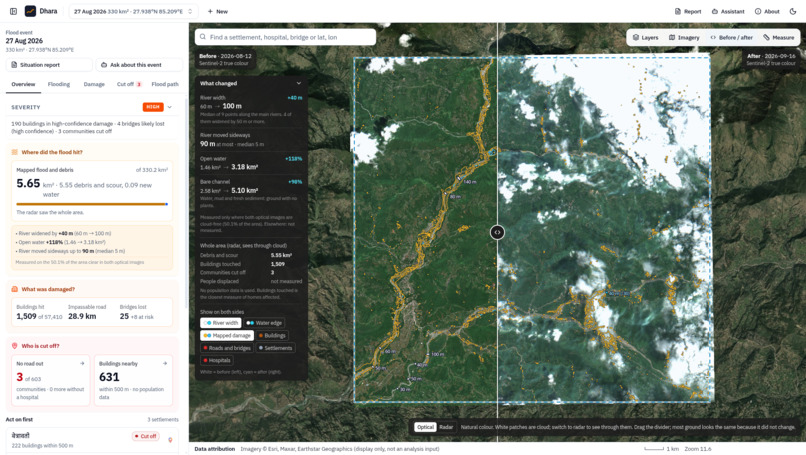
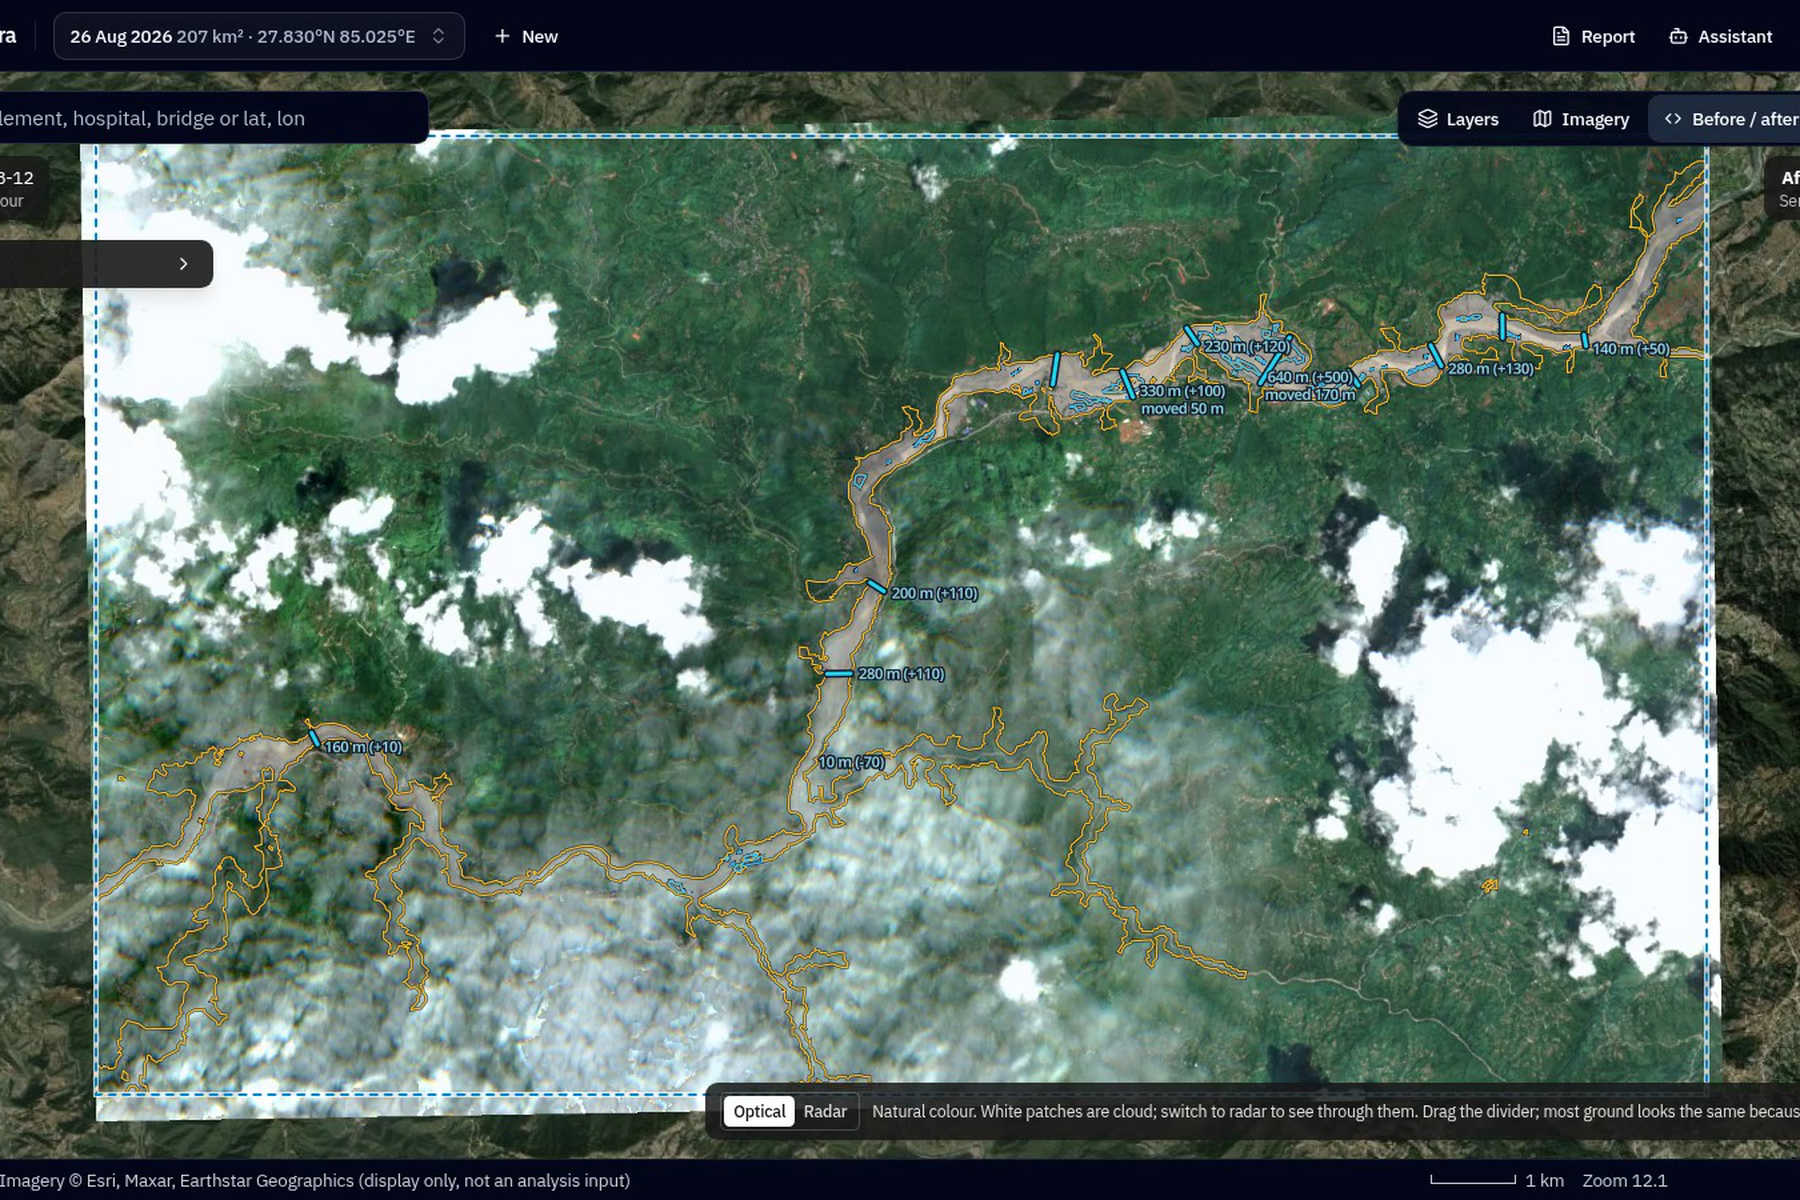
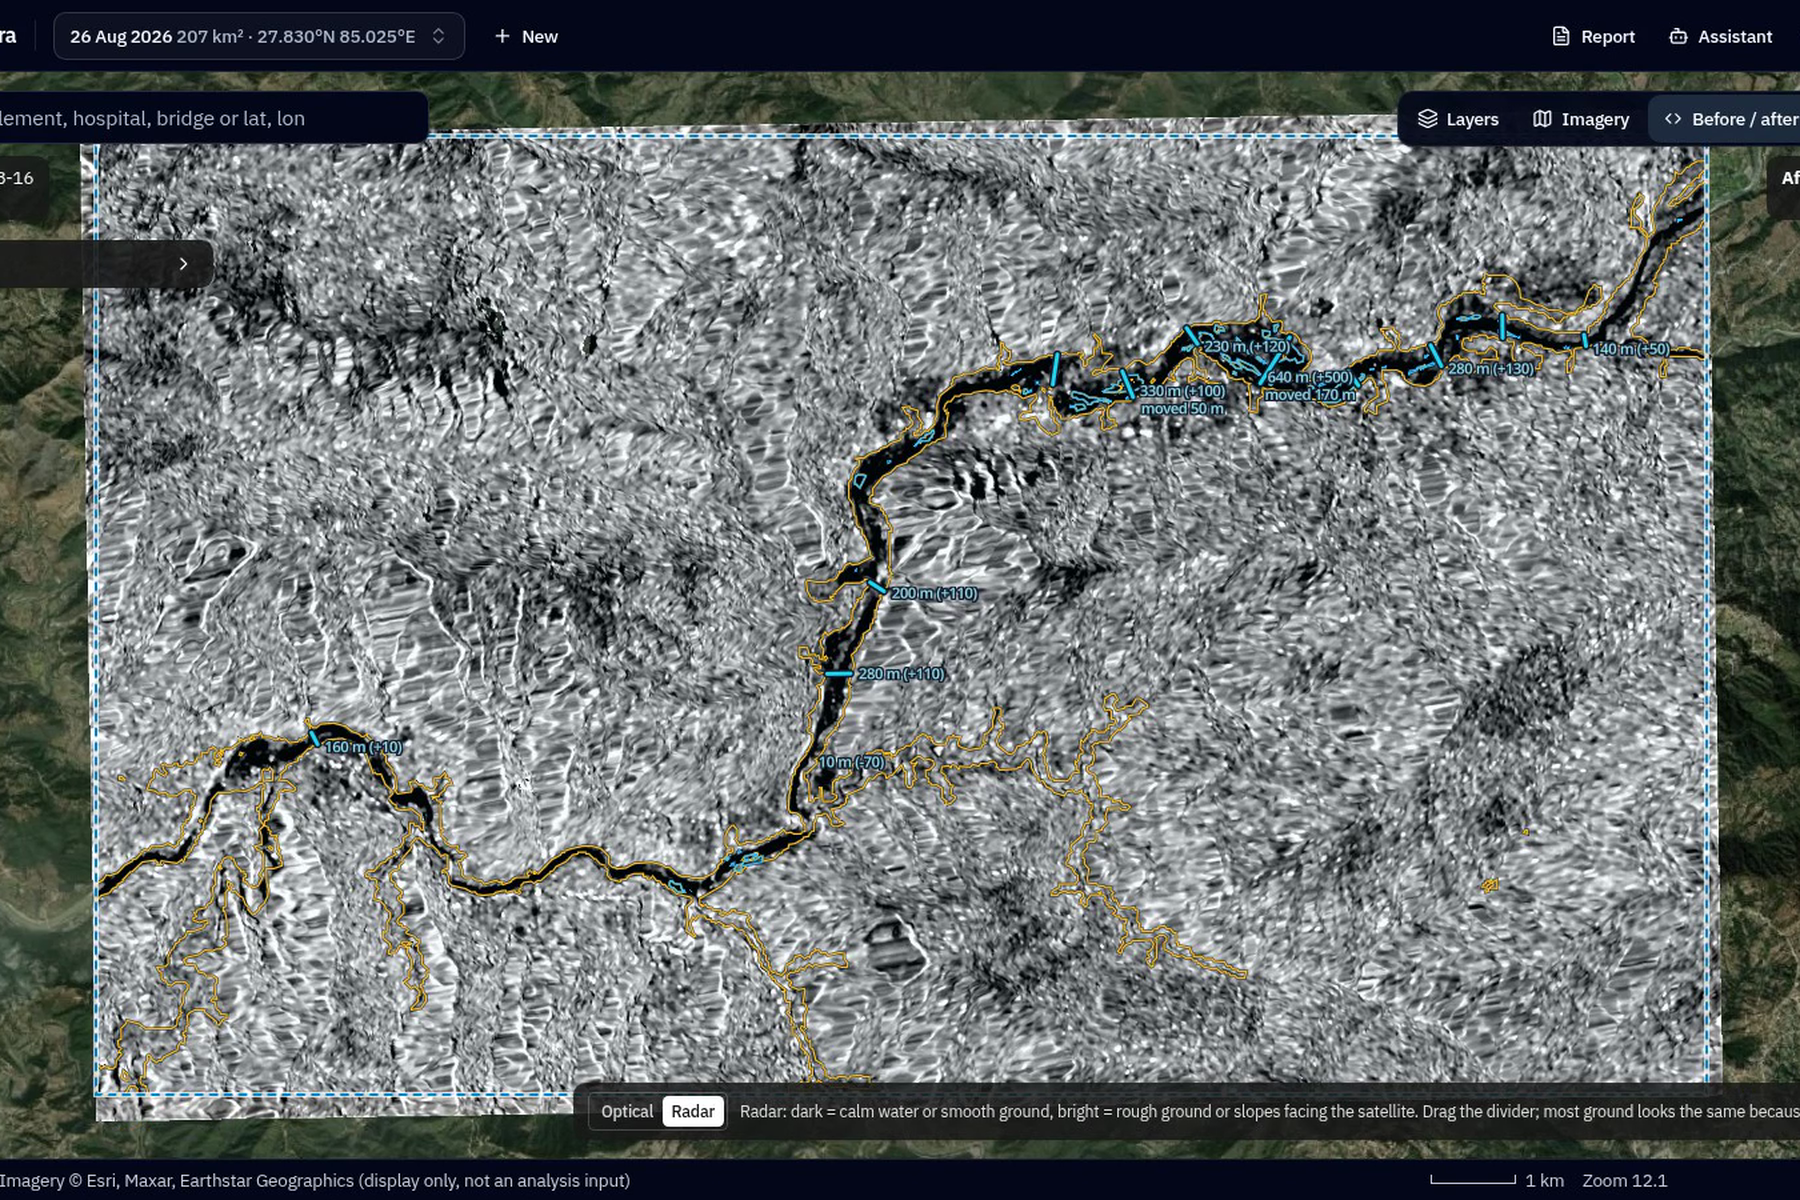
Sweep (Before - After) Comparision
-
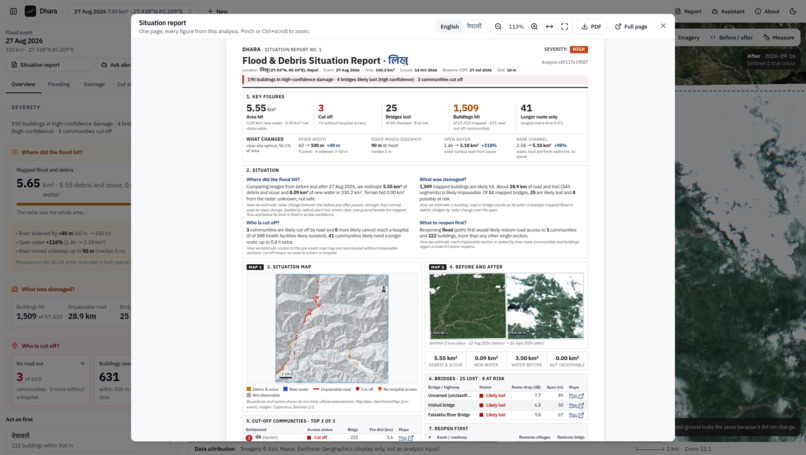
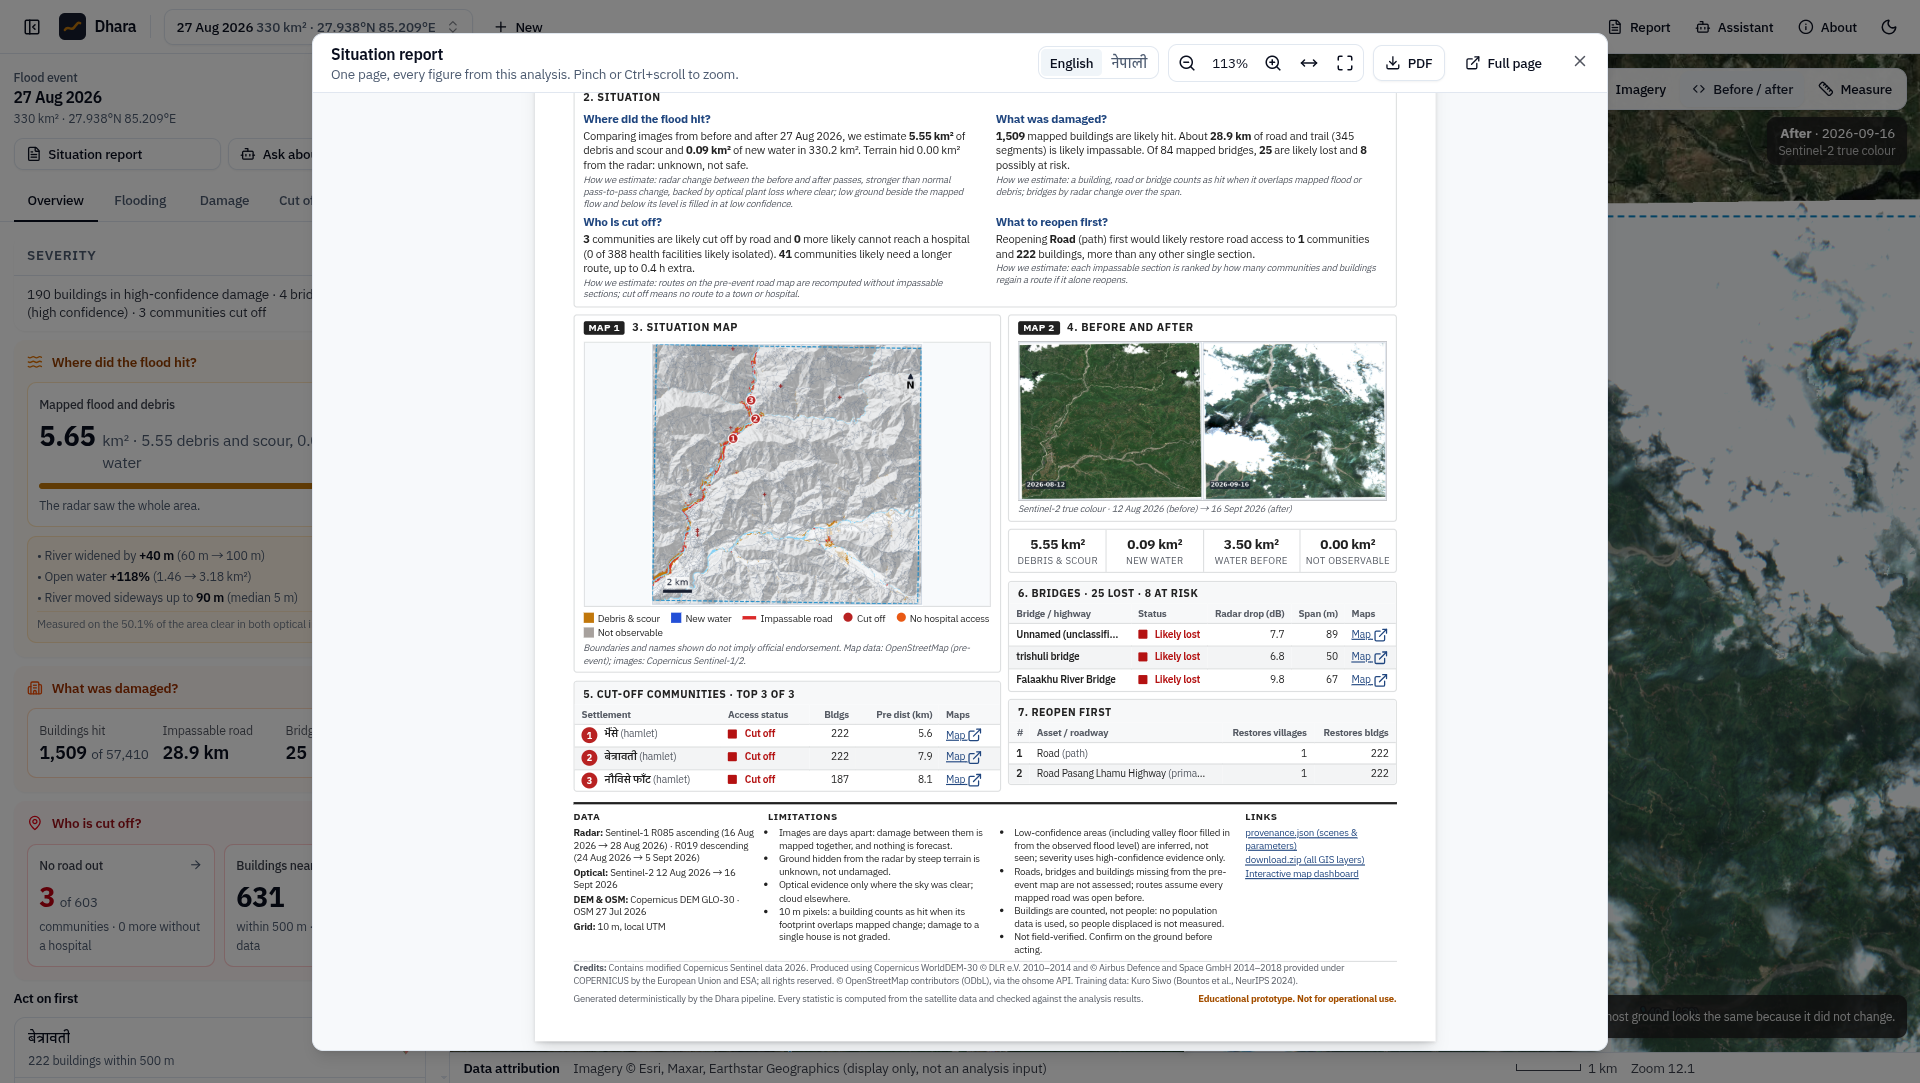
SitRep Part A
-
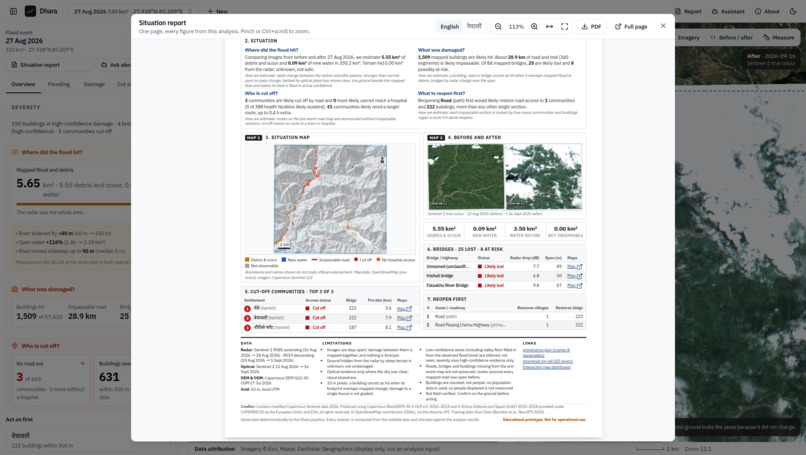
SitRep Part B
-
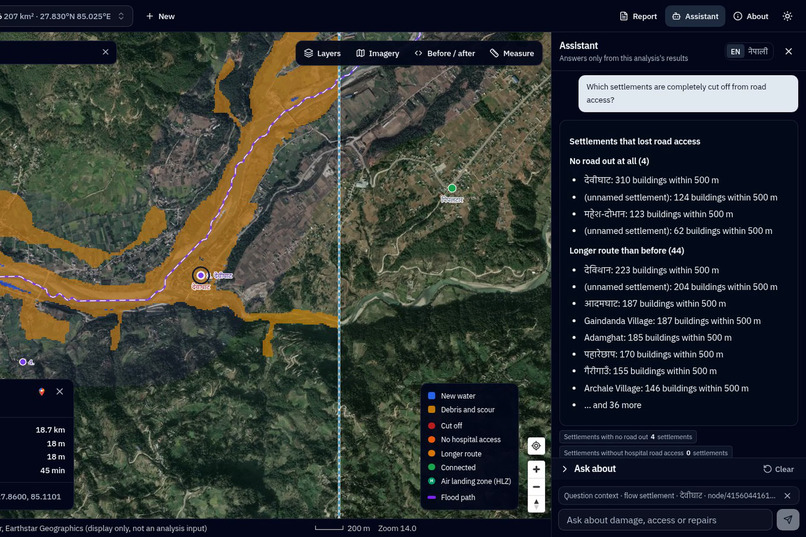
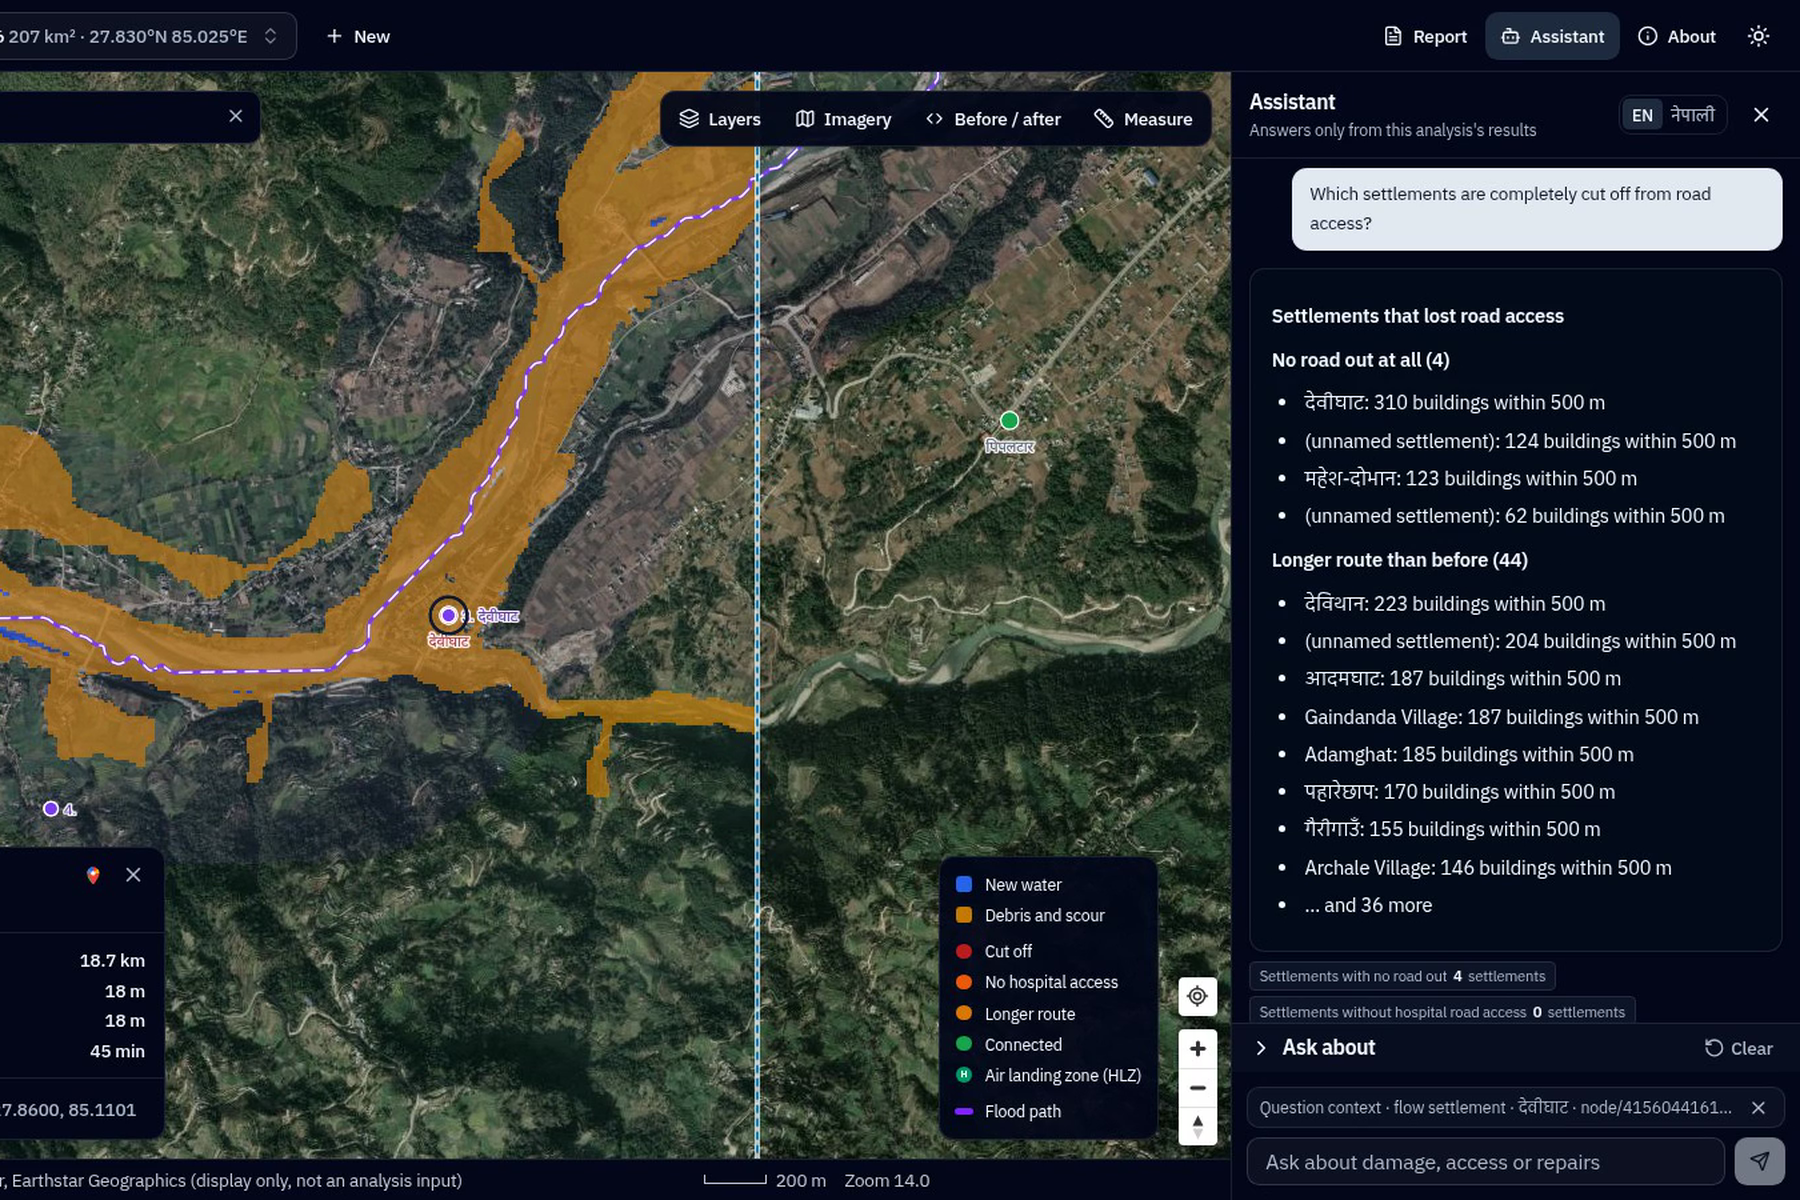
Assistant
-
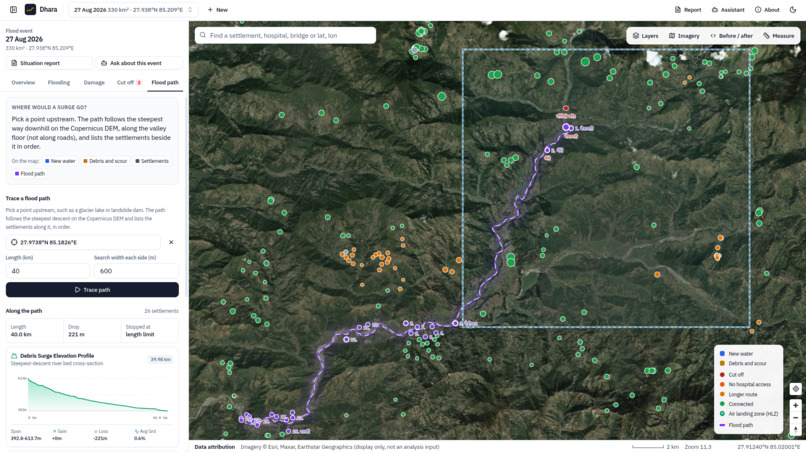
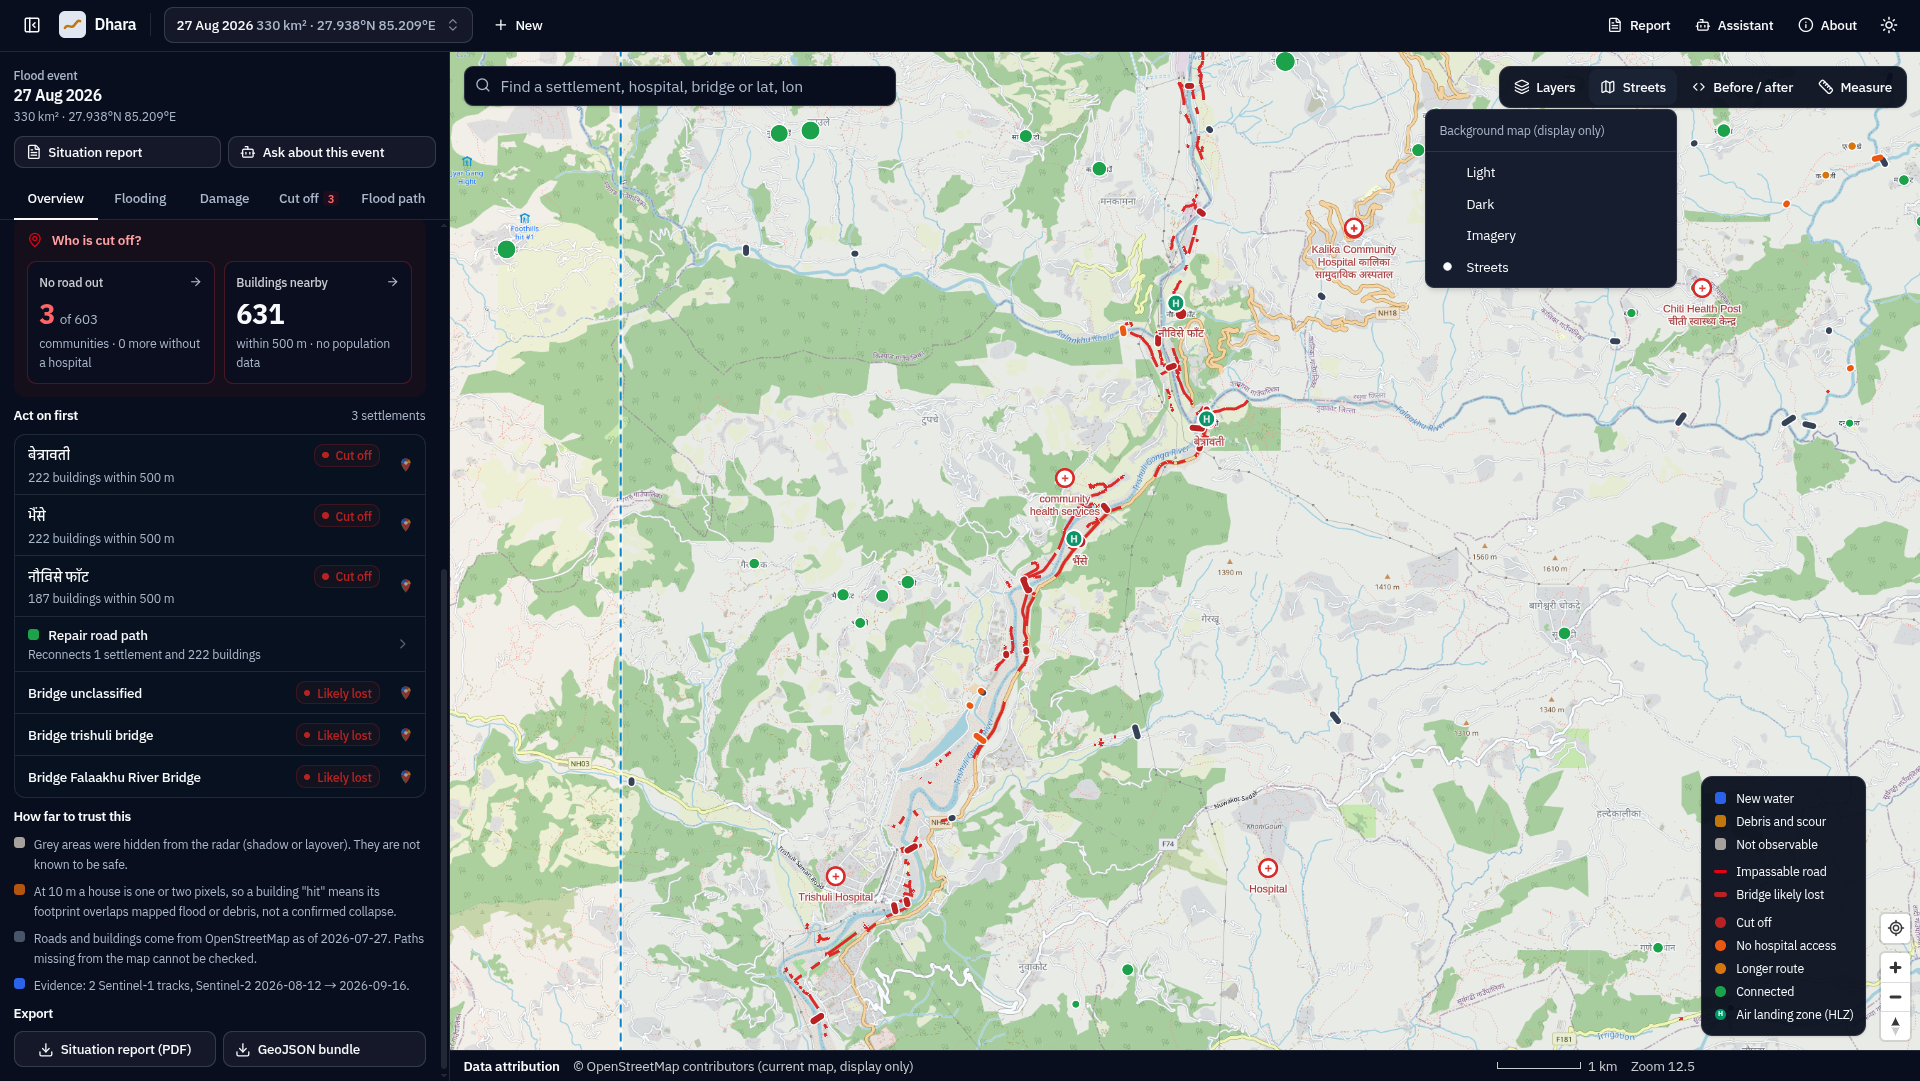
Flood Map
-
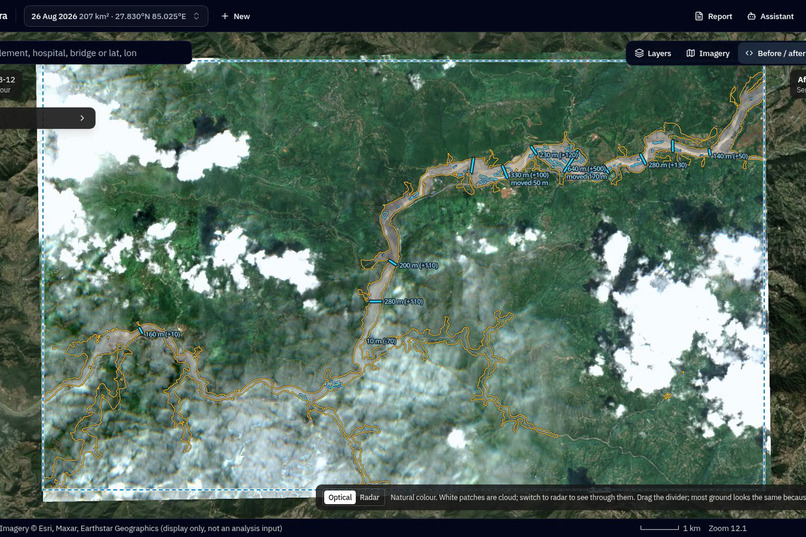
-
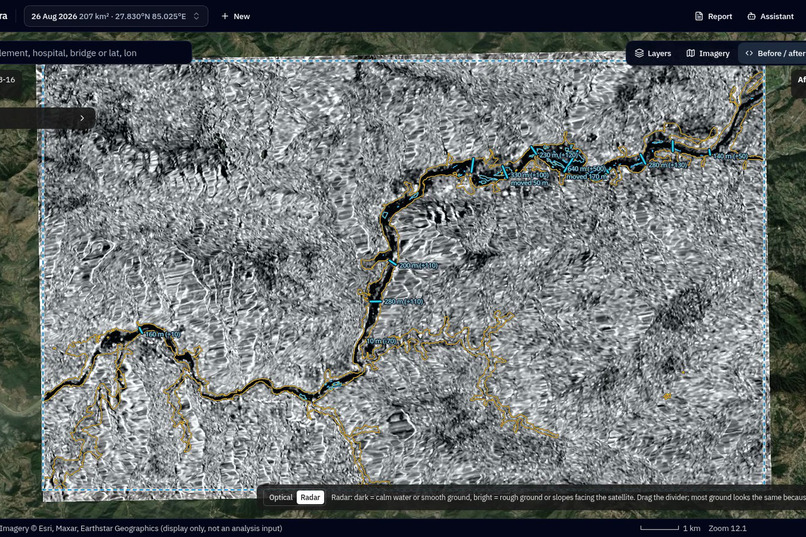
-
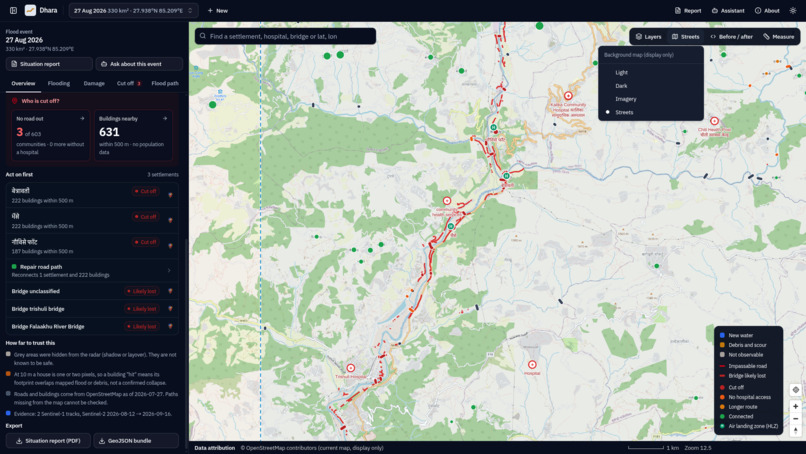
Open Street Imagery mode chnaged to Street View
-
-
Inspiration
Every monsoon, Nepal's mountain valleys are hit by floods and debris flows. In the first hours, a district emergency team needs three answers: where did it flood, what was damaged, and who can no longer be reached by road. Cloud usually hides the valleys from optical satellites, and rapid mapping services cover only the areas they are activated for. Sentinel-1 radar sees through cloud and is free. We wanted to turn it, together with other open data, into answers a commander can read in a minute.
What it does
Dhara covers every part of the Track B brief:
| Brief | Dhara |
|---|---|
| Where did the flood hit? | Flood and debris footprint with confidence, from radar through cloud |
| What was damaged? | Pre-event OpenStreetMap buildings, roads, bridges, schools and health facilities |
| Who is cut off? | Every settlement rerouted before and after the event |
| AI component | Both options: a flood segmentation U-Net and a situation-report copilot |
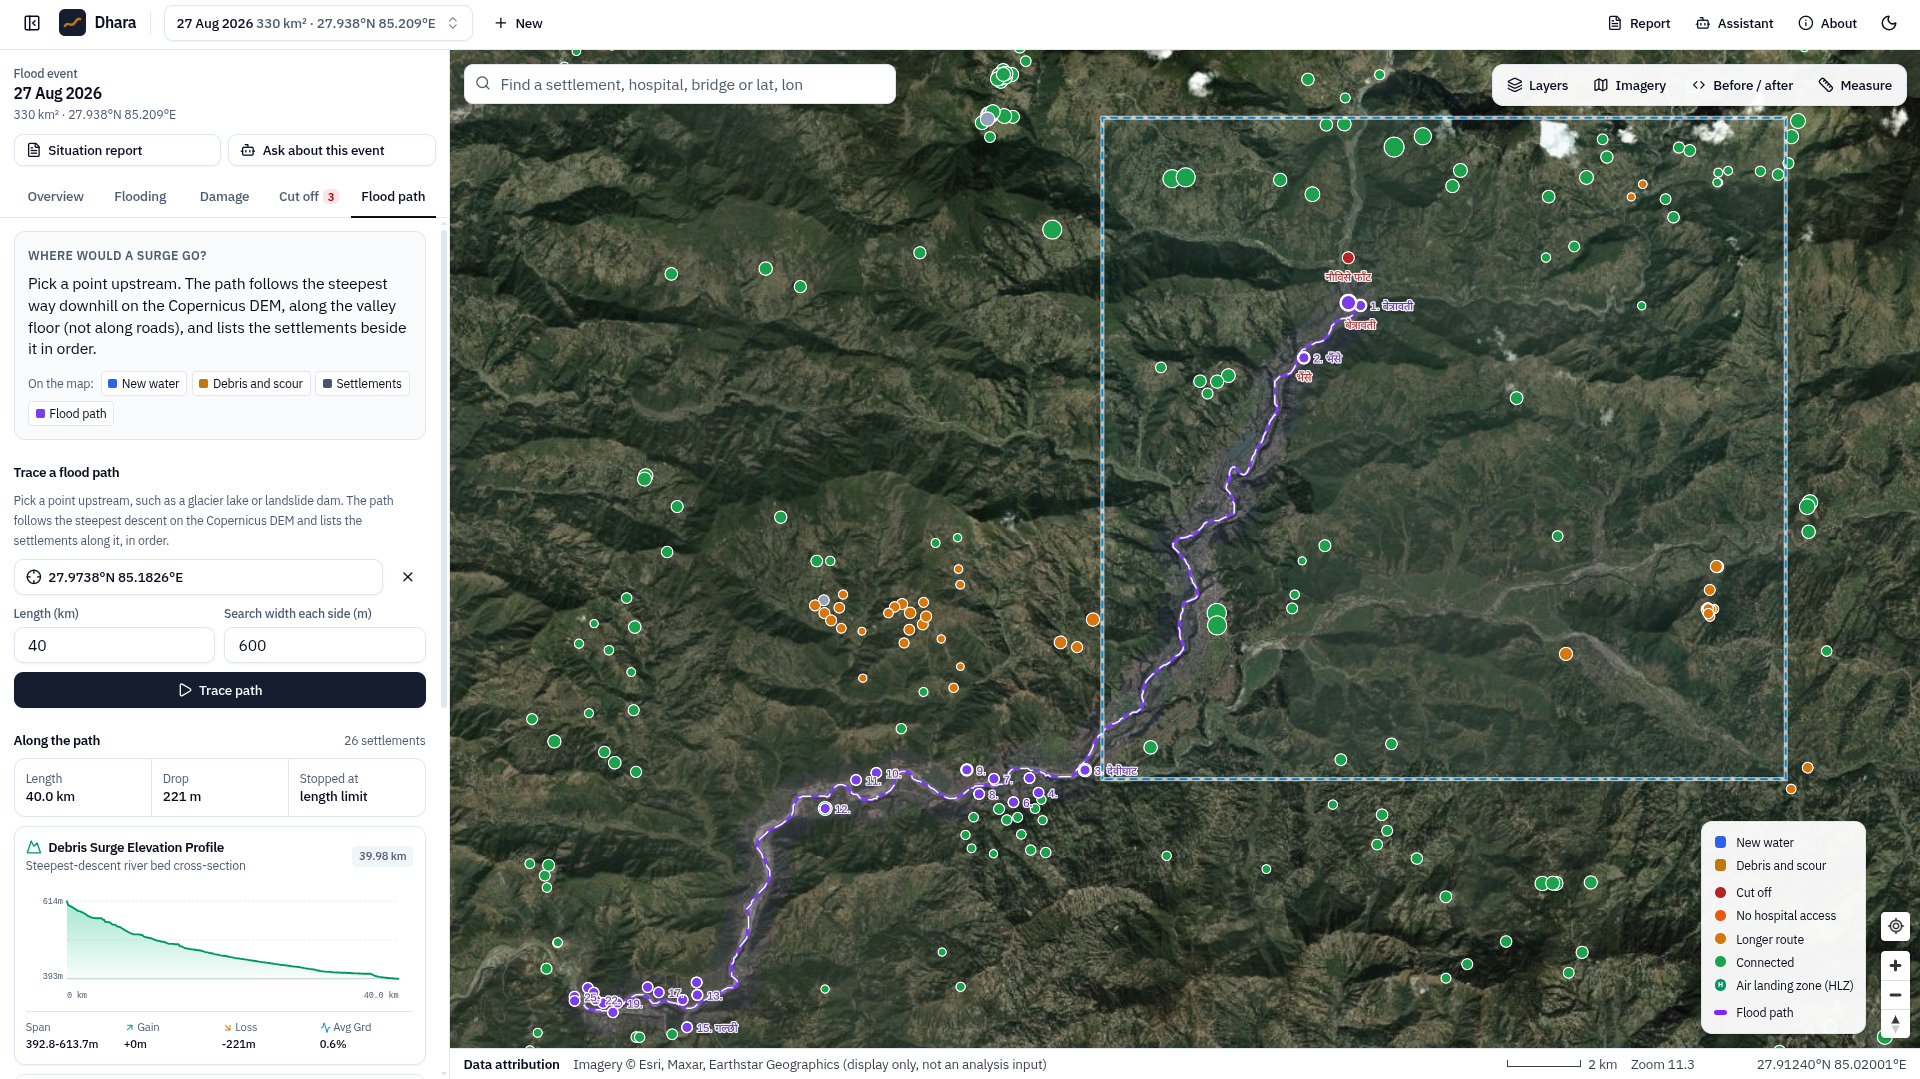
| Bonus | Flood path from any upstream point, with the settlements along it |
| Case study | Trishuli, 26 August 2026, scored against Copernicus EMS (EMSR927) |
Pick any area and event date. Dhara then:
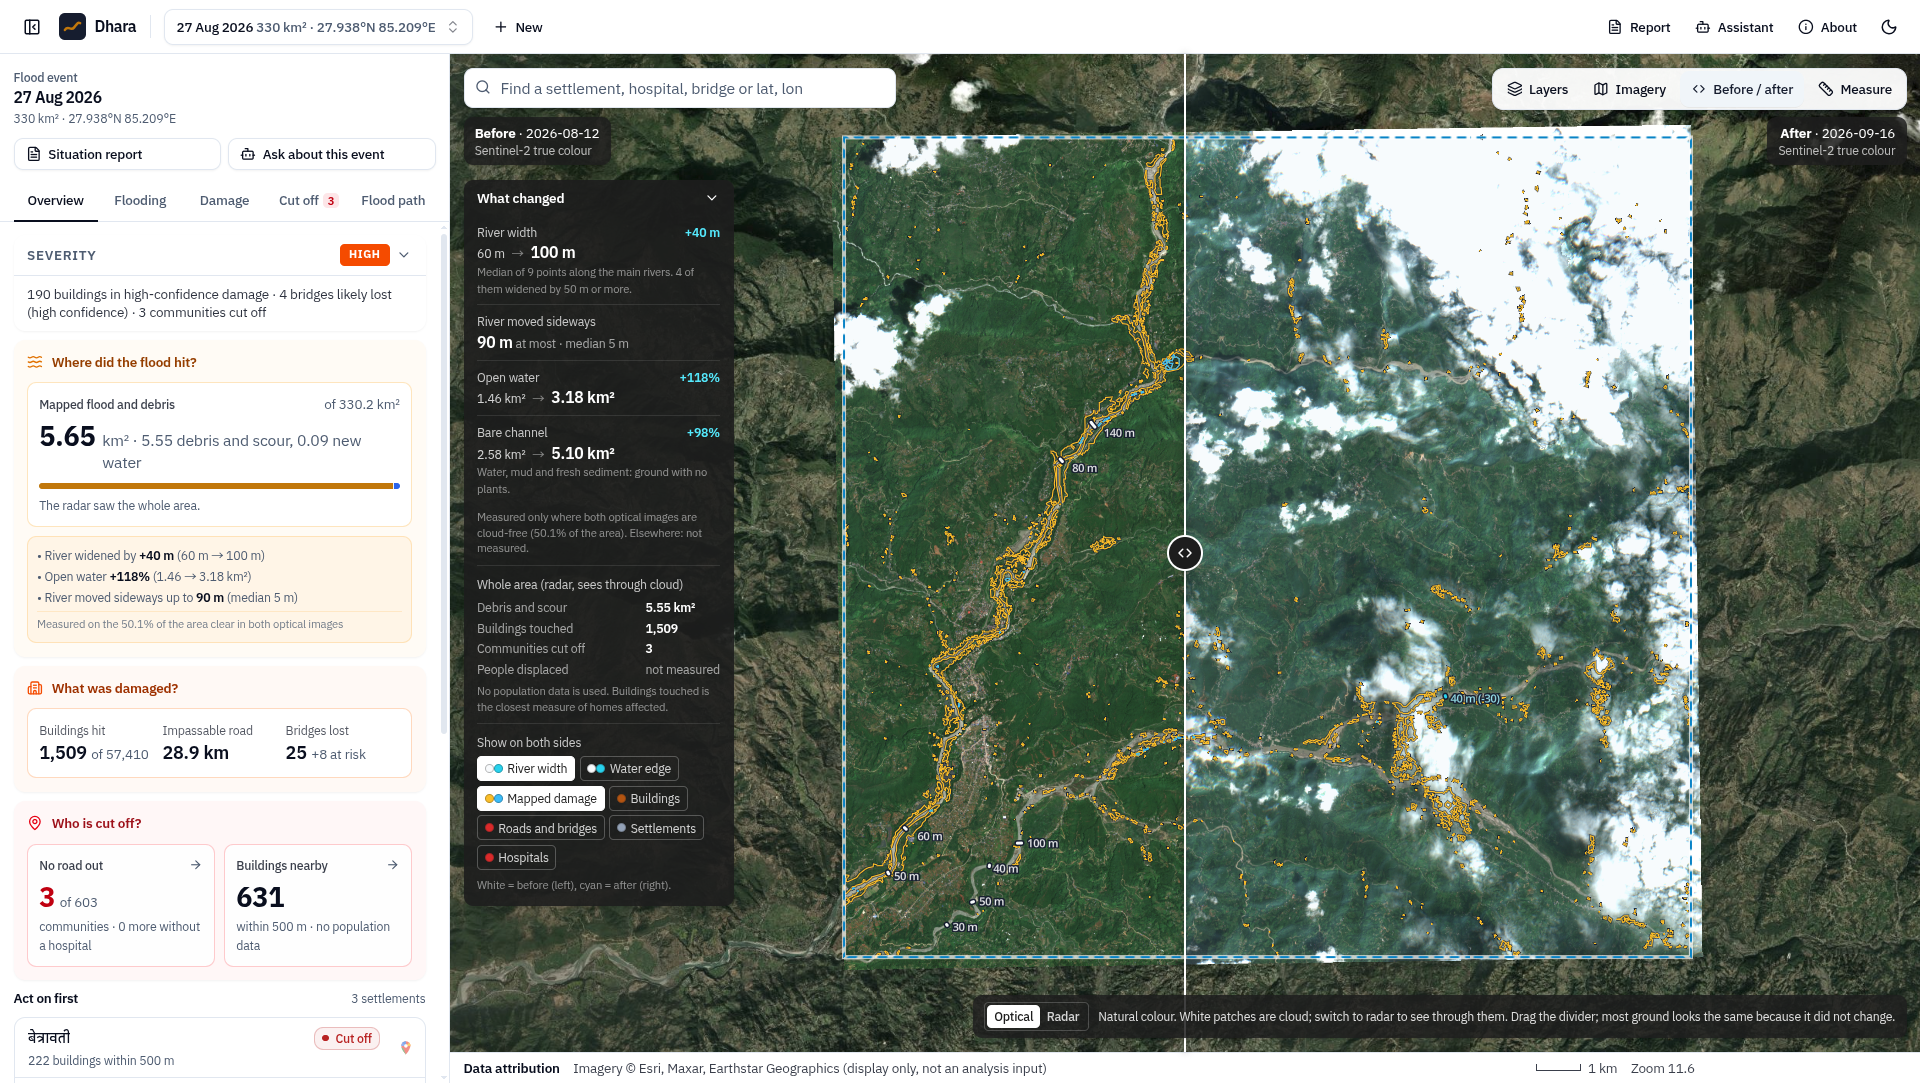
- Finds the flood and debris footprint from Sentinel-1 radar before and after the event, Sentinel-2 where the sky is clear, and the Copernicus DEM. Every pixel carries a confidence level. Ground the radar cannot see (steep shadow) is marked not observable, never "no damage".
- Lists what was damaged: buildings, roads and bridges from OpenStreetMap as it was before the event, plus schools and health facilities in the hazard zone.
- Finds who is cut off. Each settlement is routed over the pre-event road network, before and after the event. The result is no road out, no road to a hospital, a longer detour, or still connected. It also ranks the road repairs that would reconnect the most buildings and marks possible helicopter landing zones.
- Traces flood paths downhill from any point (for example a glacier lake or landslide dam) and lists the settlements in the way.
Answers rescuers' questions in English or Nepali (the situation-report copilot). Common questions are answered instantly from precomputed facts, with the evidence shown. Other questions go to a language model, and an answer is kept only if every number in it is in the results. Select a place on the map and the question is about that place. It can read answers aloud.
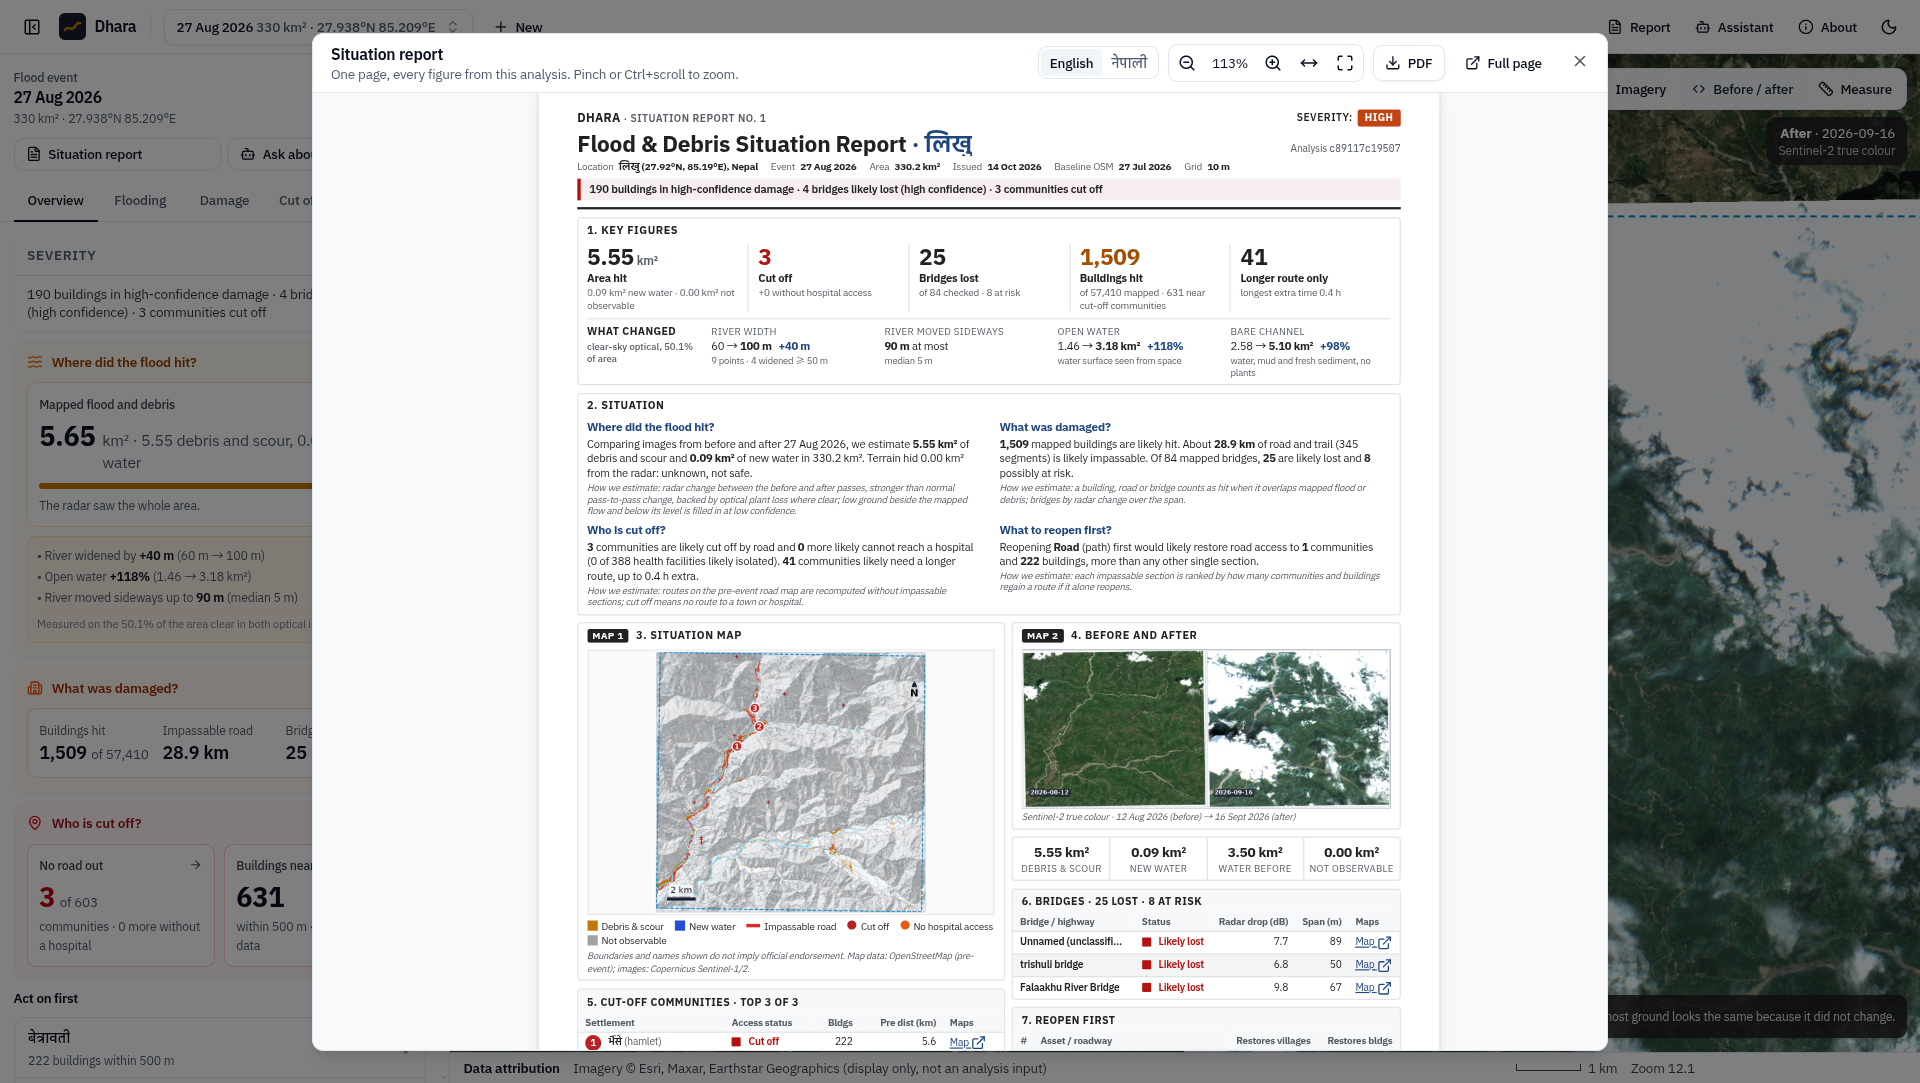
Writes a one-page situation report in English or Nepali. Every figure comes from the analysis. The server builds the PDF as soon as the analysis finishes.
How we built it
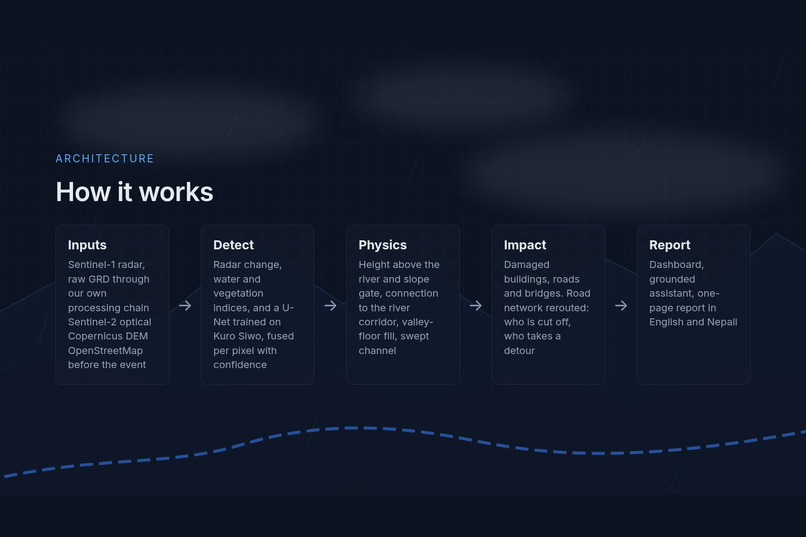
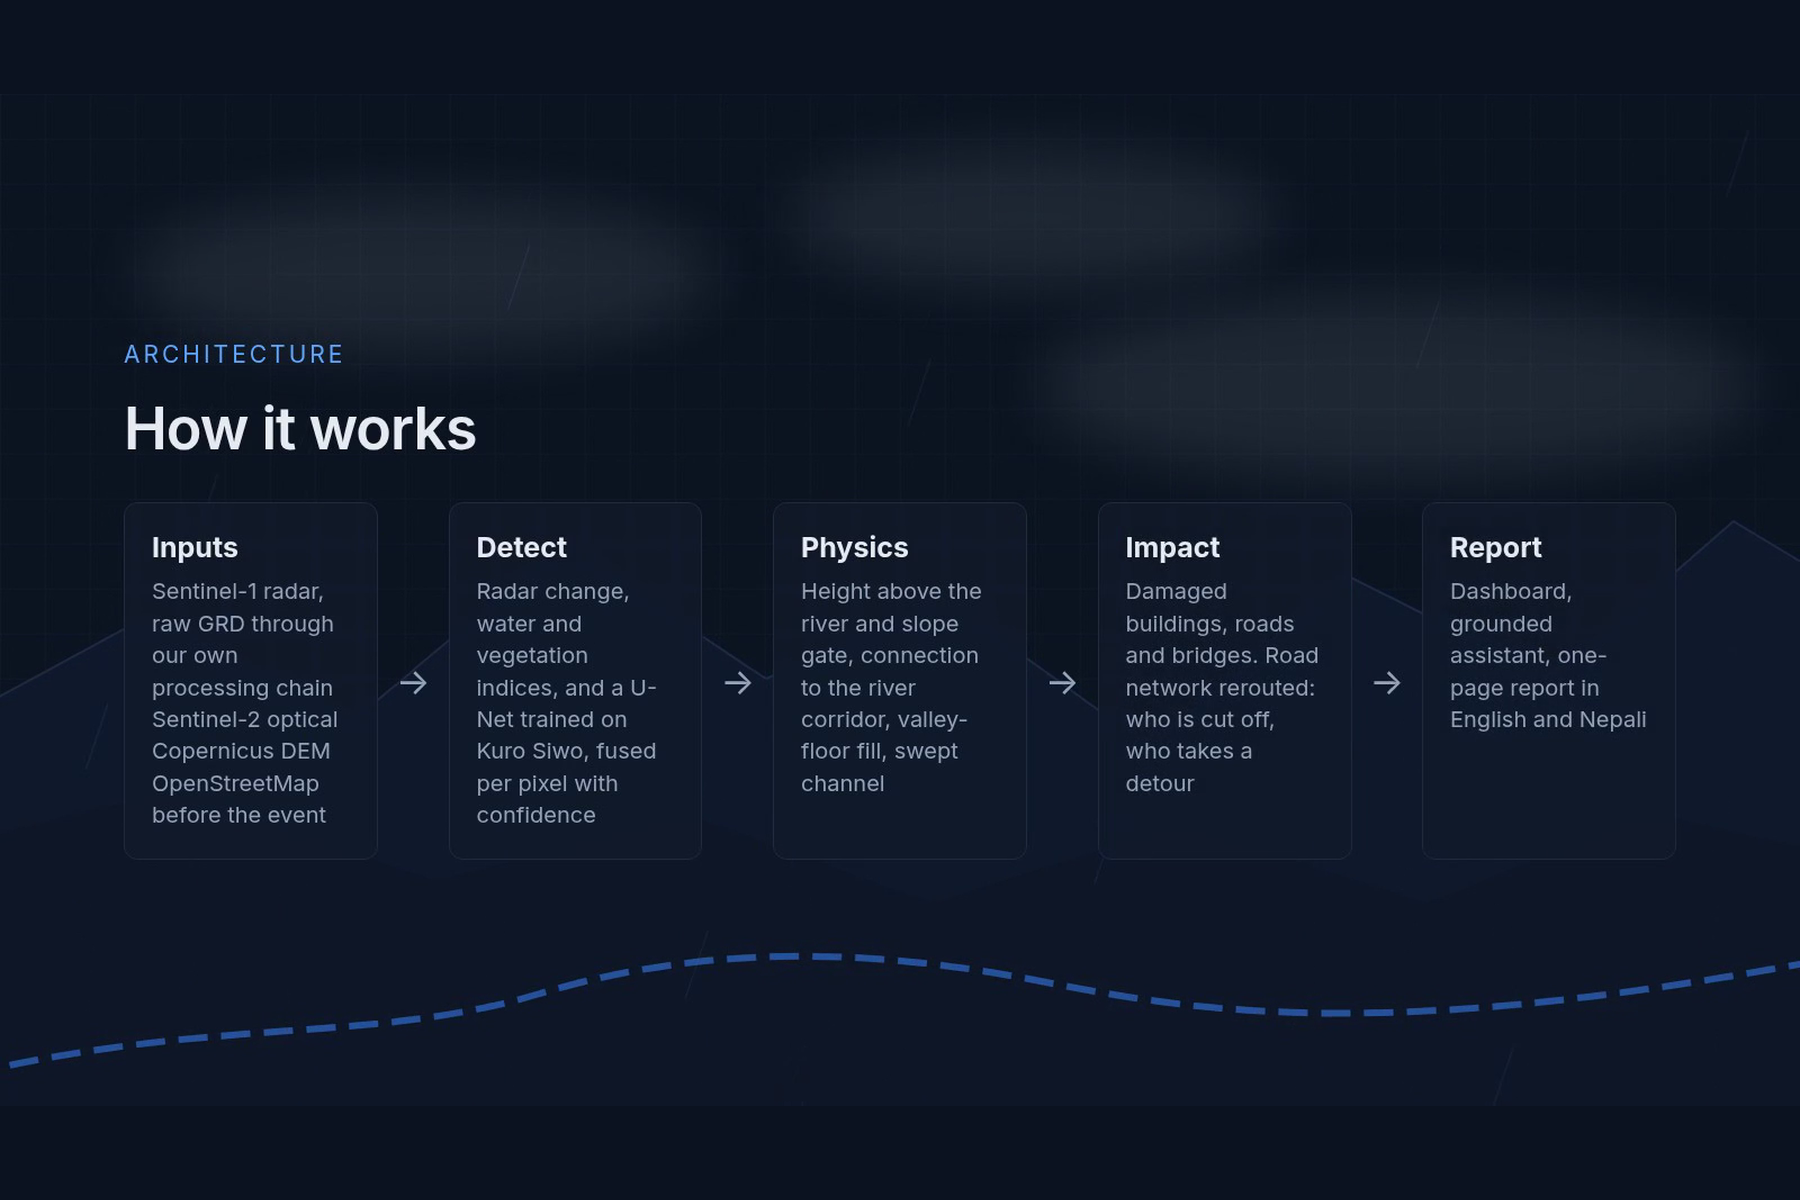
- Our own Sentinel-1 processing chain. It reads raw GRD files from the Copernicus Data Space and applies thermal-noise removal, radiometric calibration, a Lee speckle filter, Range-Doppler terrain geocoding on the Copernicus DEM, terrain flattening, and layover/shadow masks. Memory is bounded so large areas run on a laptop.
- Detection ensemble. Radar log-ratio change, bidirectional change, Sentinel-2 MNDWI and vegetation/bare-soil indices, and a U-Net trained on the Kuro Siwo flood dataset (ImageNet encoder, also scored on Sen1Floods11) are fused per pixel into classes with confidence tiers. Training ran on Kaggle GPUs.
- Physics-based detector. It removes water too high above the river (height above nearest drainage) or on too-steep slopes, requires debris to connect to the river corridor, fills the valley floor up to the flood level read from the mapped footprint, and marks the swept channel and landslide runout scars.
- Impact and access. Pre-event OpenStreetMap via ohsome (snapshot 2026-07-27). A routable road graph is rerouted after removing failed segments and bridges. Settlement, hospital and repair rankings are computed from it.
- Stack. Python 3.12, FastAPI, DuckDB, rasterio/GDAL, NumPy/SciPy, PyTorch/ONNX Runtime, scikit-image; React, TypeScript, Vite, shadcn/ui, MapLibre; headless Chromium for the PDF. Every job writes a provenance file with scene IDs, git commit, parameters and timings.
Challenges we ran into
- Mountain radar. Steep terrain creates layover and shadow, and much of what changes on a hillside is not flood at all. The physical rules (height above the river, slope, connection to the corridor) took the largest gains.
- Being honest about accuracy. One of our "pre-flood control" runs turned out to use an optical image taken after the flood, which made the controls look worse than they were. Controls are now radar-only, and a held-out area was scored only once, after the settings were frozen.
- Raw radar on a laptop. Geocoding full-resolution scenes over the DEM ran out of memory twice. We rebuilt it to process row blocks with a lattice geocoder.
- Names and languages. OpenStreetMap names come in many scripts. The English view now prefers Latin names and romanises others, and the Nepali view uses Nepali names.
- Never inventing numbers. Every figure in the UI, report and assistant traces back to a computed fact. The assistant refuses what the analysis cannot answer, for example counts of people.
Accomplishments that we're proud of
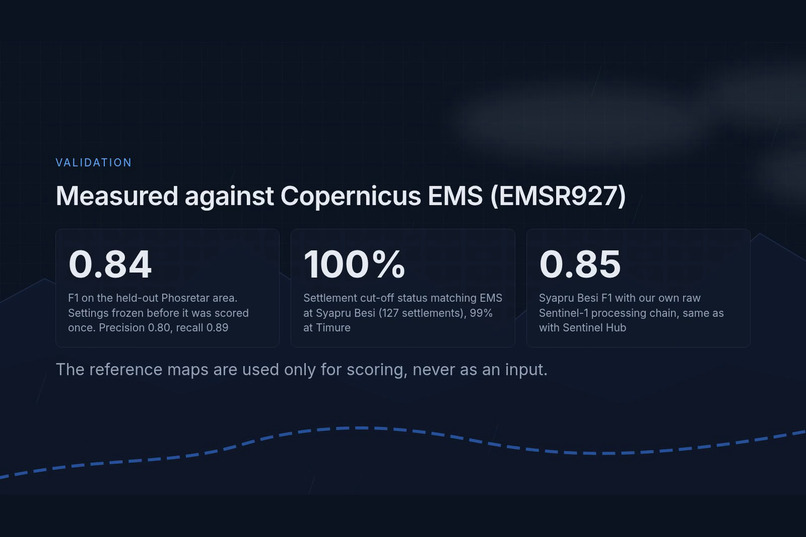
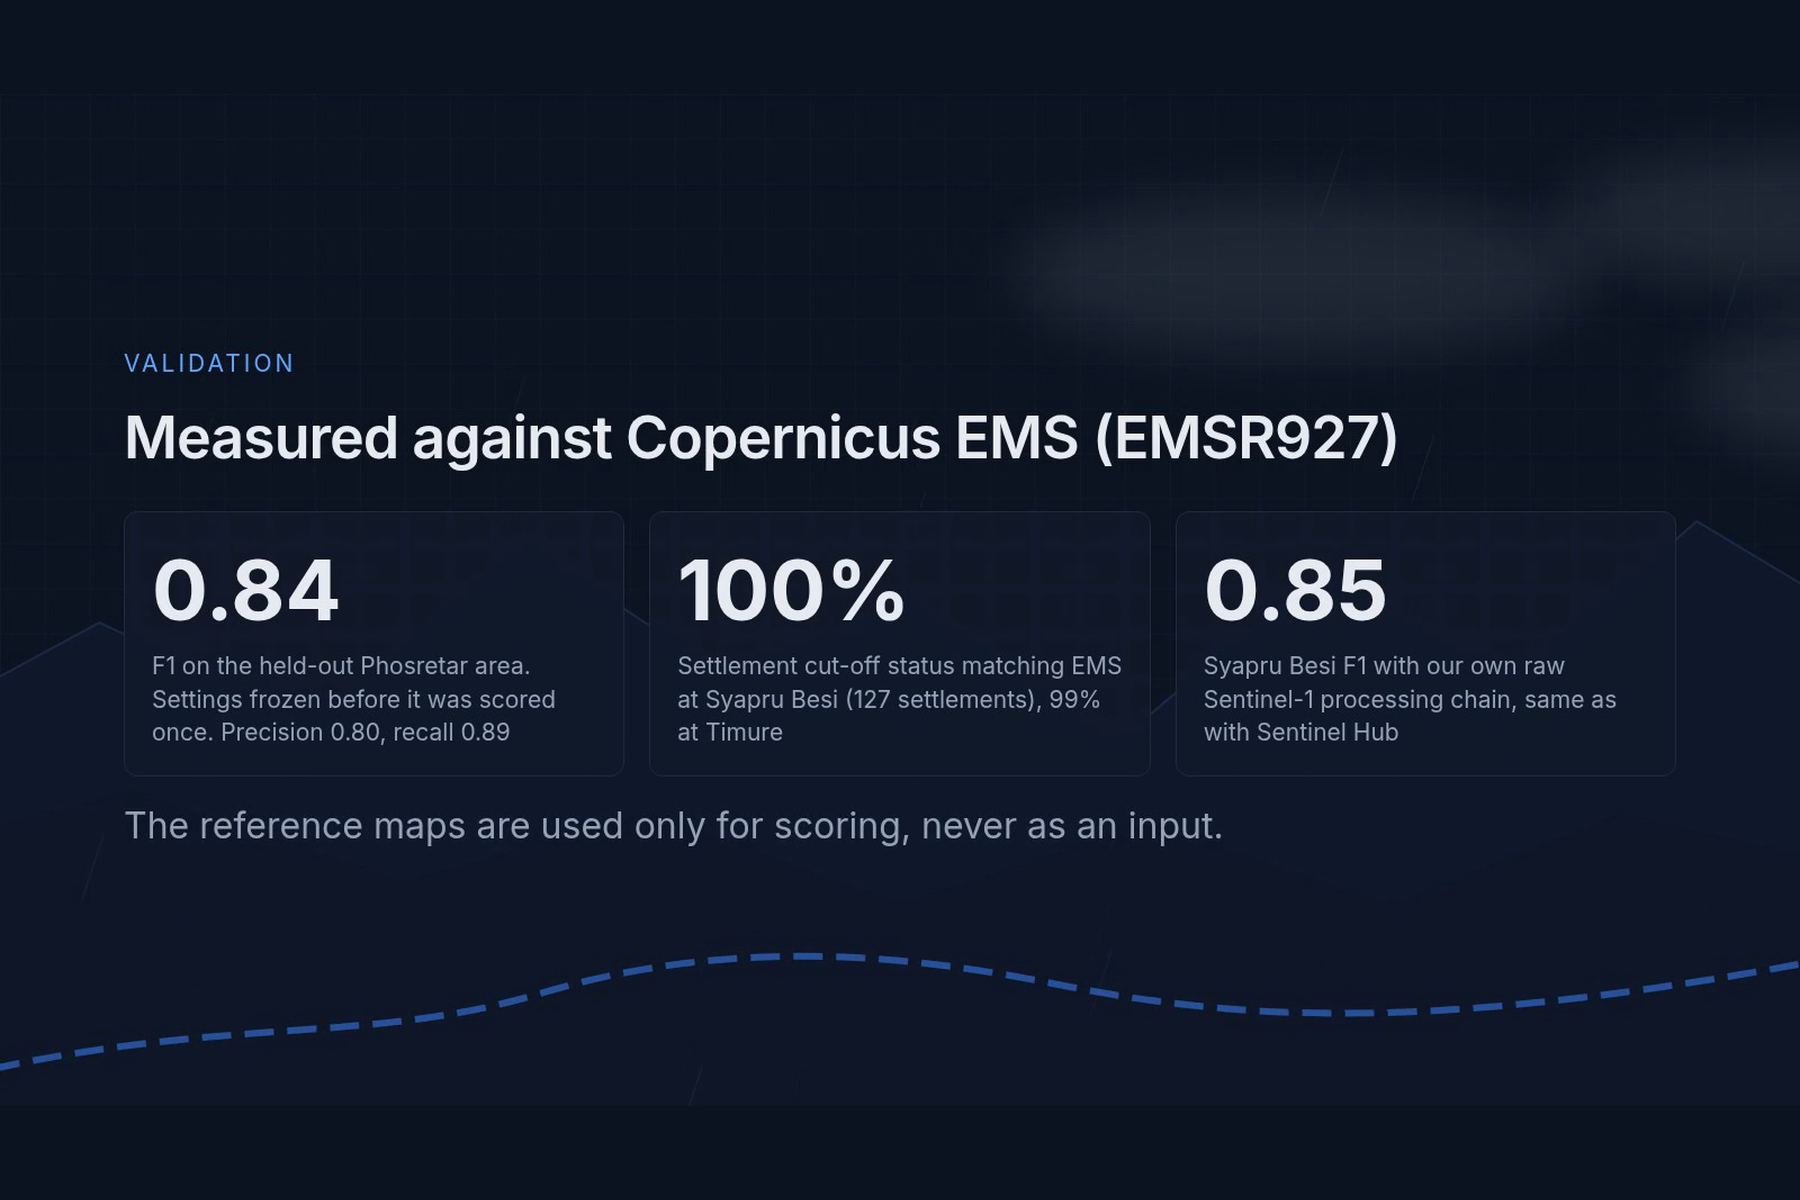
All scores are against Copernicus EMS rapid mapping (EMSR927), which was used only for scoring and never as an input:
- F1 0.84 (precision 0.80, recall 0.89) on the held-out Phosretar area, scored once with frozen settings. 76% of EMS damaged buildings lie within 20 m of our footprint.
- Development areas, same frozen settings: F1 0.85 Syapru Besi, 0.79 Timure, 0.88 Bidur (up from 0.67 / 0.50 / 0.73 before the physics-based detector).
- Cut-off status is the same as when the roads EMS graded damaged are cut instead of ours: 127 of 127 settlements at Syapru Besi and 114 of 115 at Timure.
- Flood segmentation model (U-Net, ImageNet encoder, trained on Kuro Siwo): flood F1 0.74 on test events and 0.75 on four high-relief events held out of training; Sen1Floods11 water IoU 0.61 (test) and 0.71 (Bolivia). On the Trishuli scenes the model alone finds little of the EMS footprint, because EMS maps debris while the allowed training data labels only water; where it flags flood it is almost always right, and fusion with the radar and optical detectors supplies the rest.
- Our own radar chain gives the same F1 as Sentinel Hub's processed products (0.85 vs 0.85 at Syapru Besi).
- A one-page bilingual situation report, generated automatically for every analysis.
What we learned
- Physics beats extra model capacity in mountain valleys. A simple rule ("a flood stays low above the river and connected to it") added more F1 than any model change.
- Uncertainty has to be visible. "Not observable" and "low confidence" are answers too.
- Access matters more than area. Responders ask who is cut off, not how many square kilometres flooded.
- Validation needs discipline: held-out areas, frozen settings and clean controls.
What's next for Dhara
- Run automatically on each new Sentinel-1 pass over monsoon-risk districts.
- Train on debris-flow labels, since the allowed training sets label only water.
- Add field feedback, so a responder can confirm or correct a road or settlement status.
- Test on more events and other mountain countries.
Dhara is an educational prototype, not for operational decisions.
Built With
- chromium
- copernicus-dem
- duckdb
- fastapi
- gdal
- kaggle
- maplibre
- numpy
- onnx-runtime
- openstreetmap
- pydantic
- python
- pytorch
- rasterio
- react
- scikit-image
- scipy
- sentinel-1
- sentinel-2
- shadcn-ui
- tailwindcss
- tanstack-query
- typescript
- vite

Log in or sign up for Devpost to join the conversation.