-
-
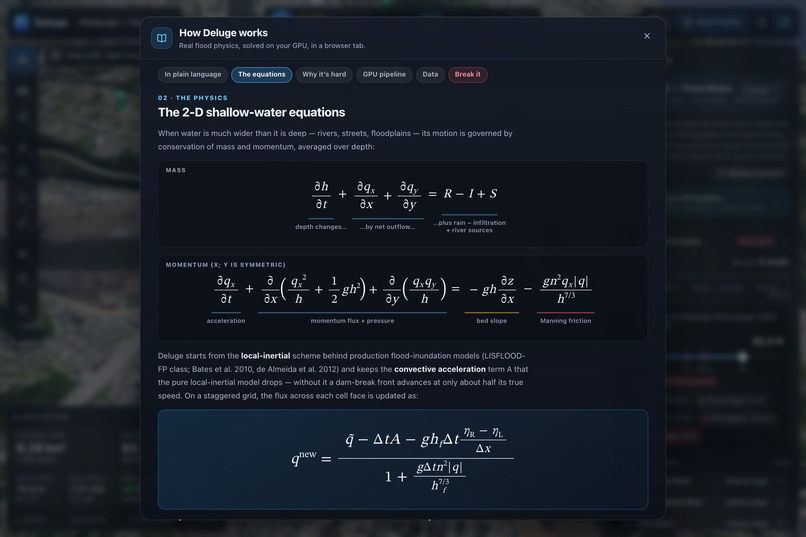
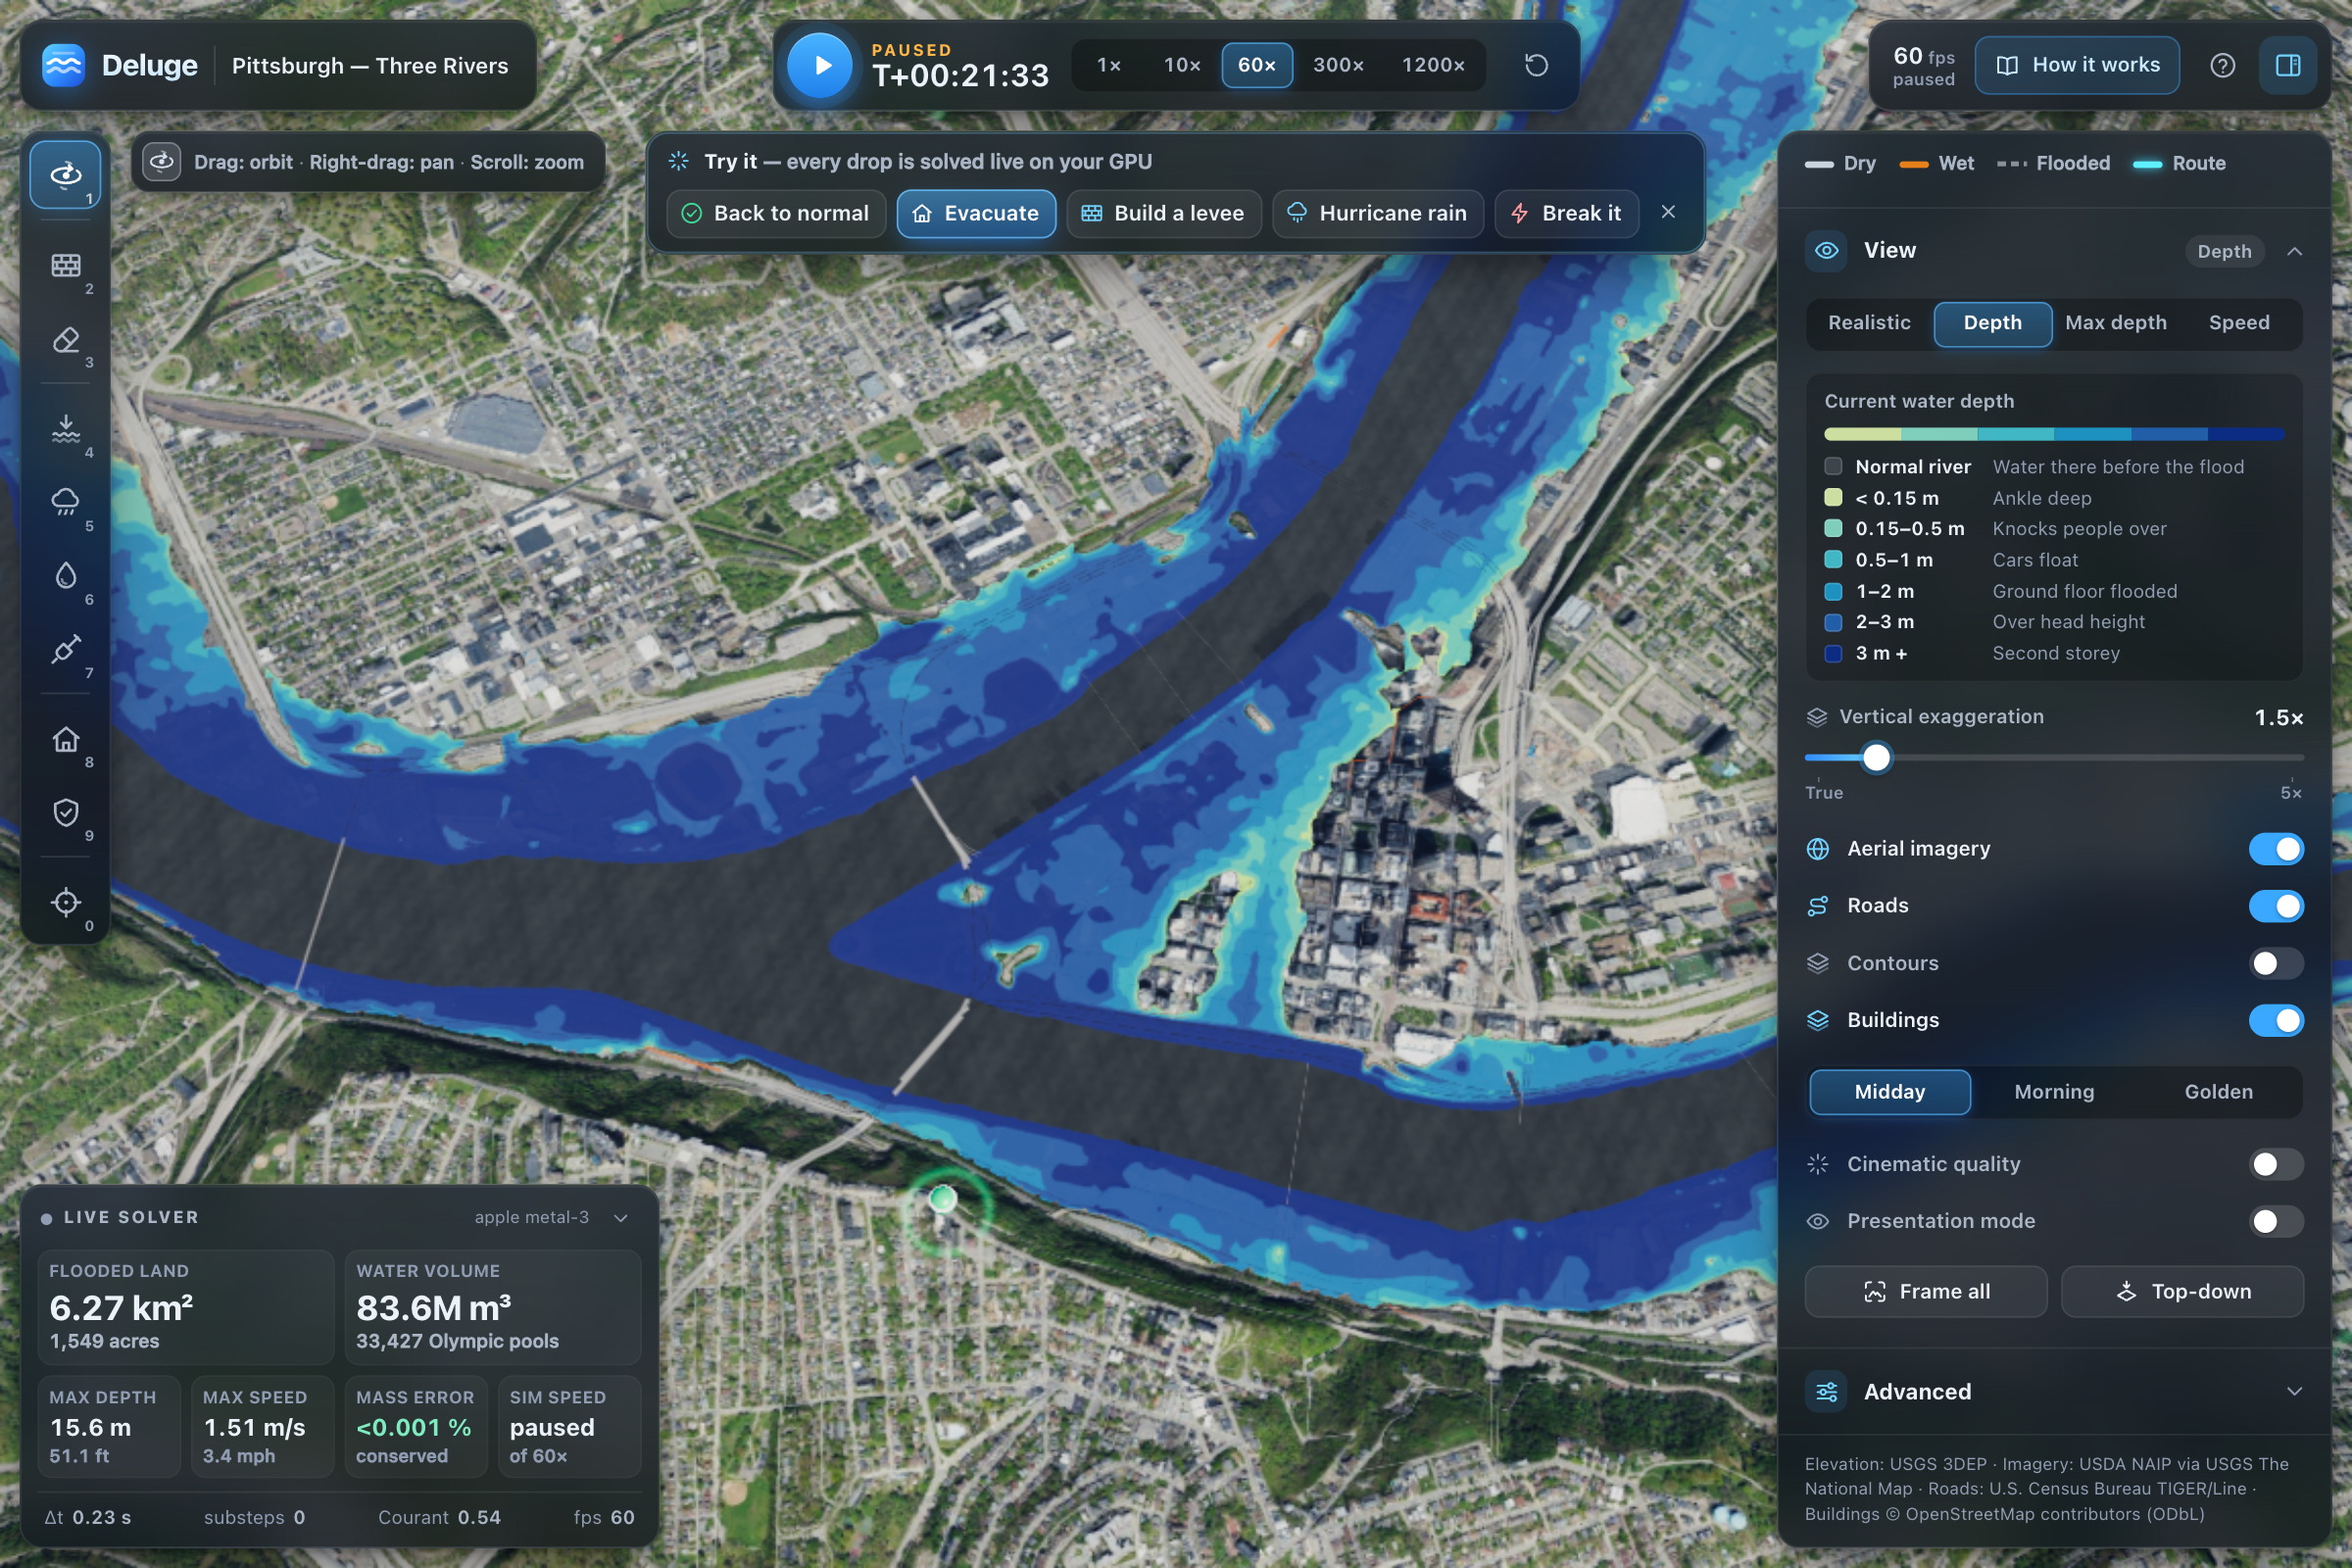
2-D shallow-water equations solved in WGSL: local-inertial scheme with momentum and flux updates.
-

2-D shallow-water equations solved in WGSL: local-inertial scheme with momentum and flux updates.
-
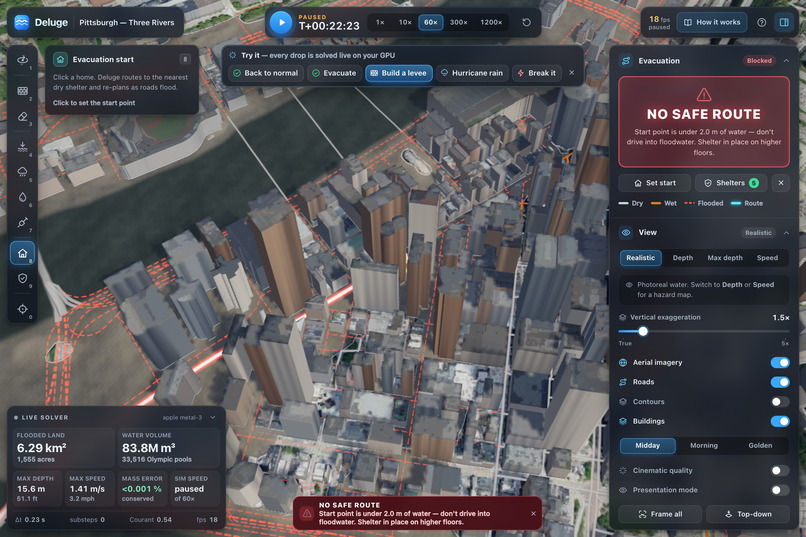
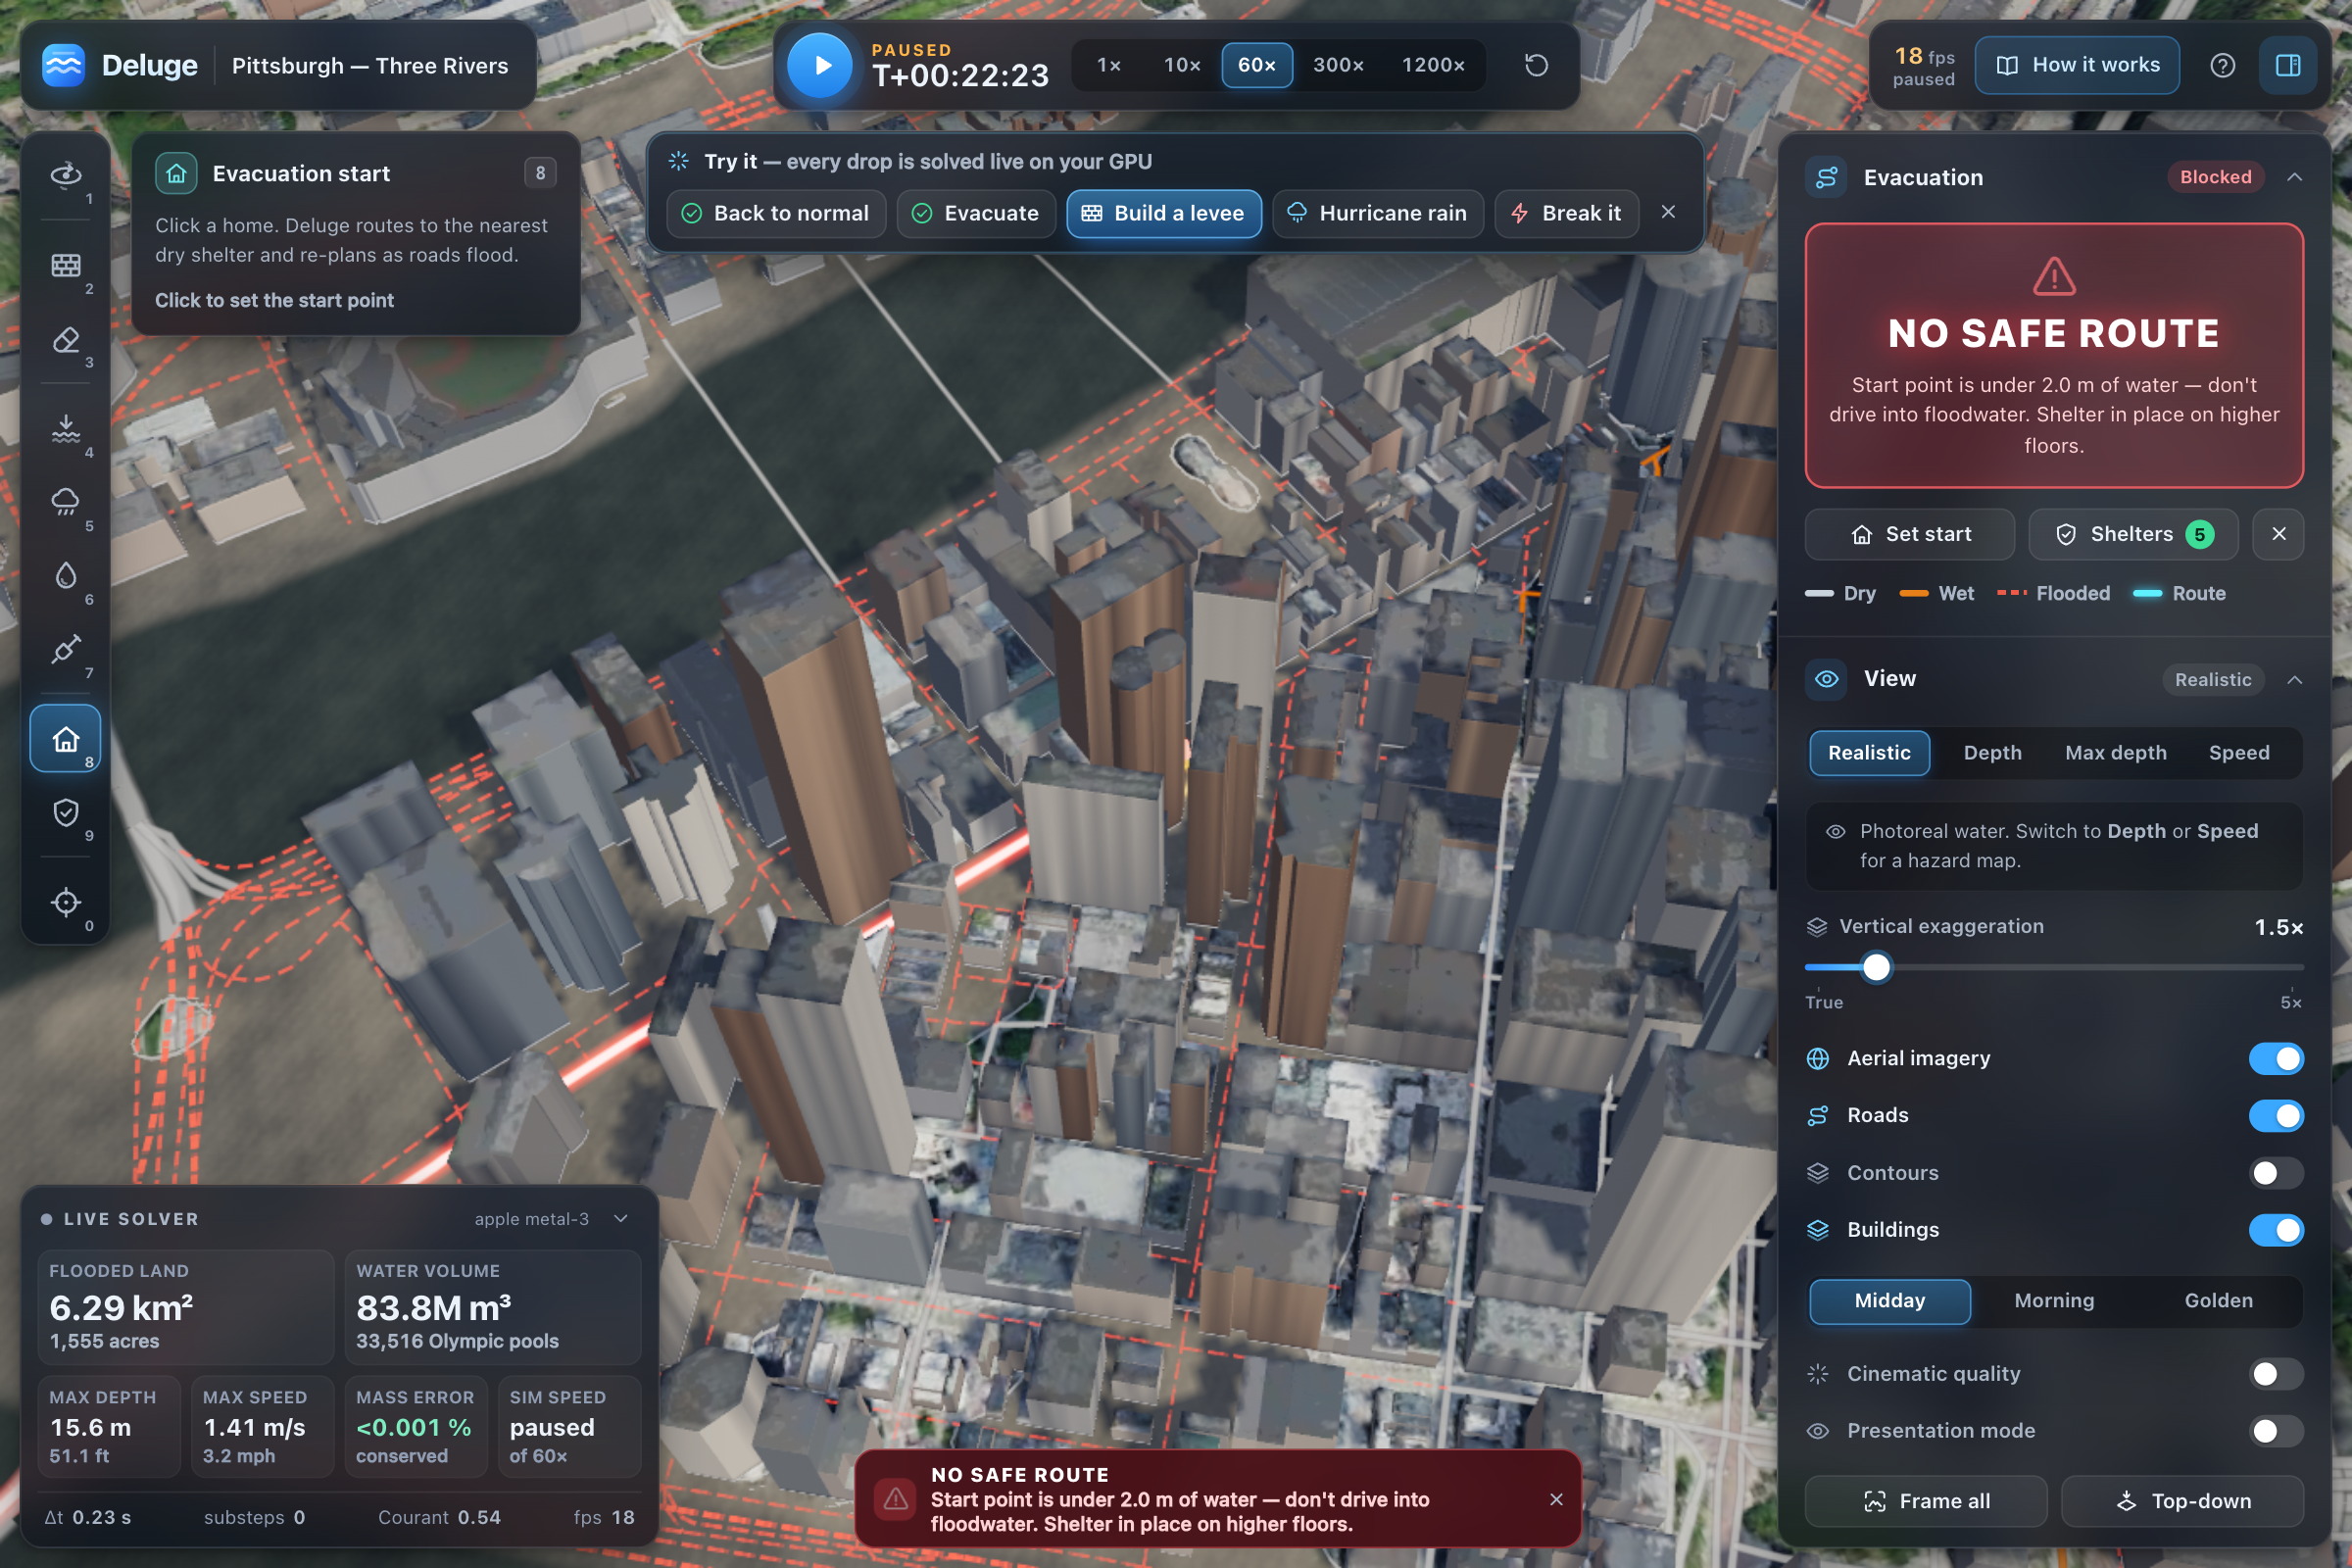
Underwater start point gets refused: no confident wrong answer here, just shelter-in-place advice.
-
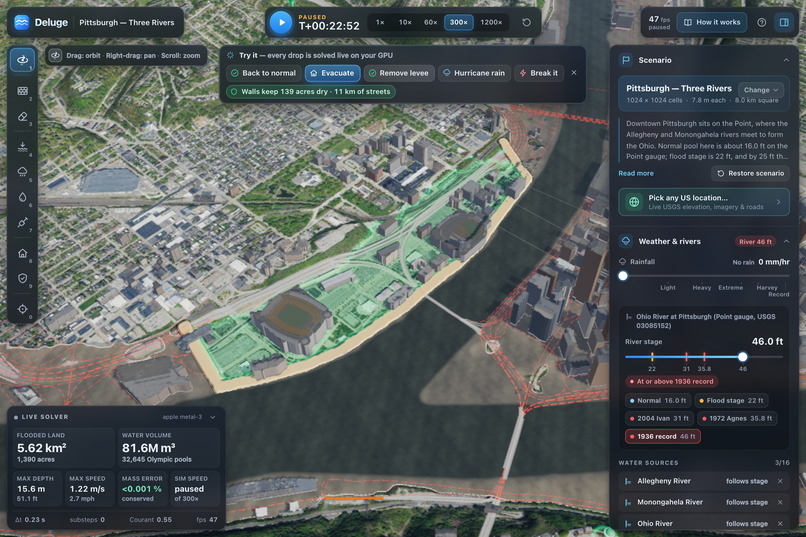
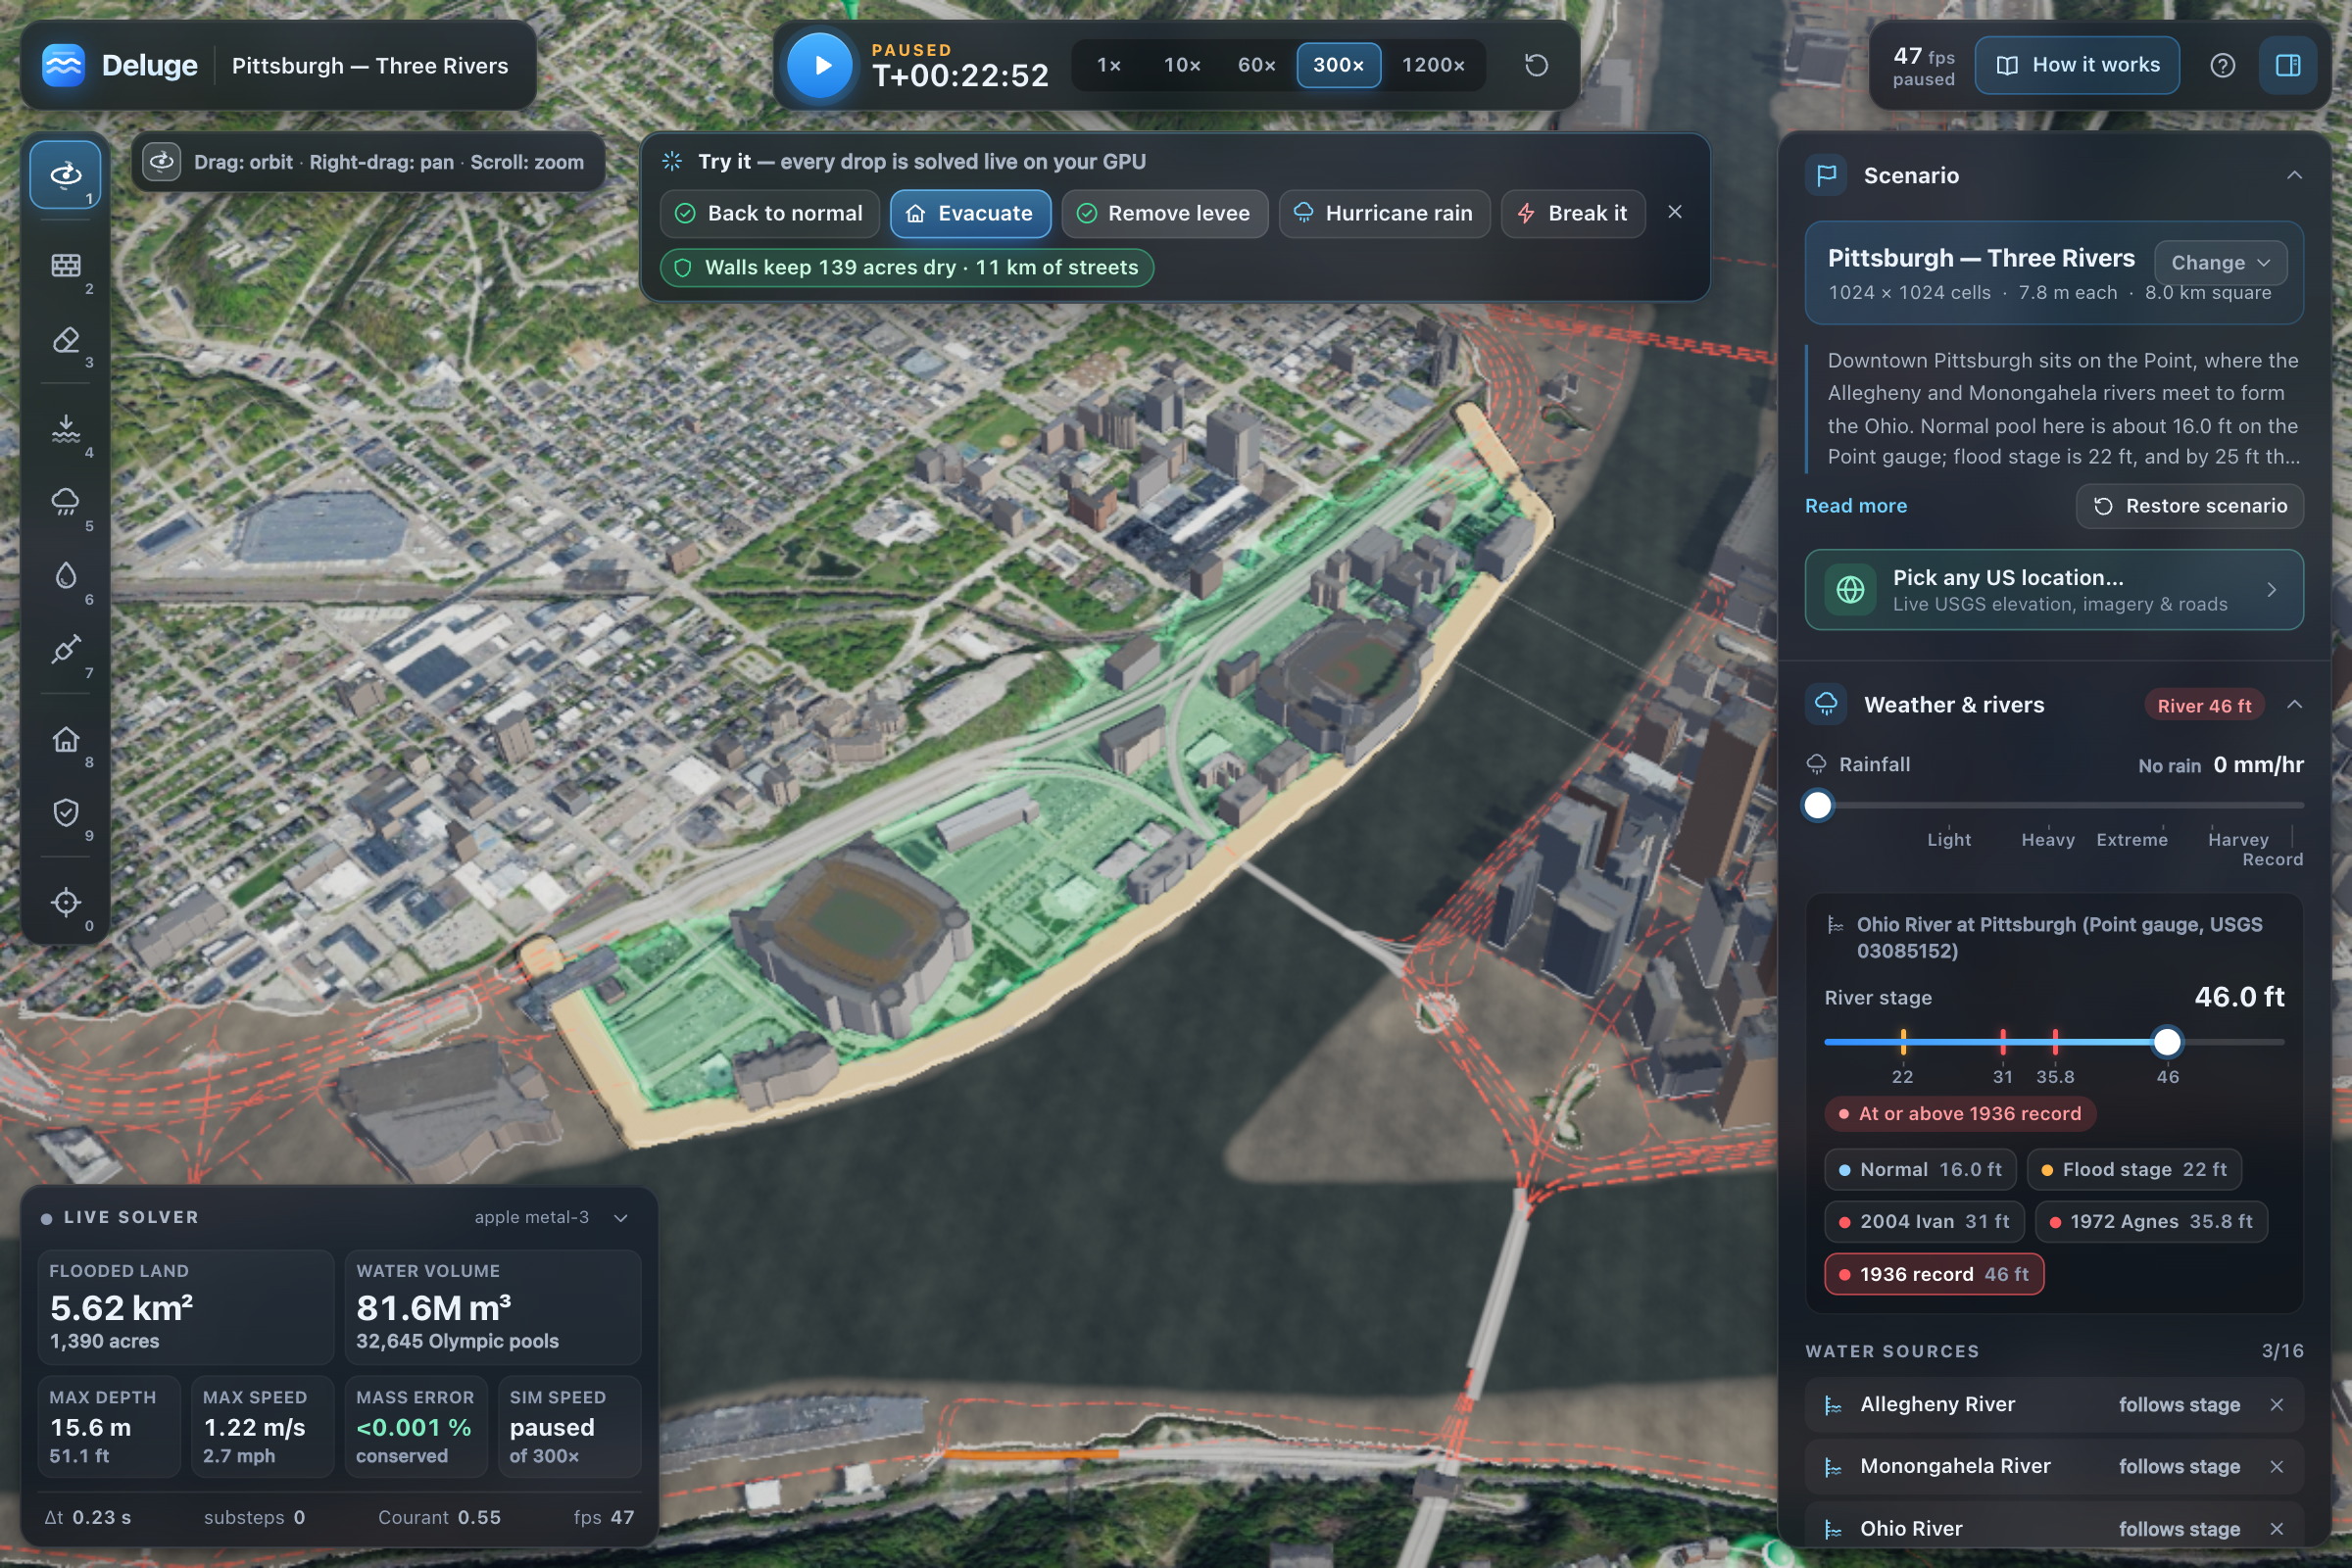
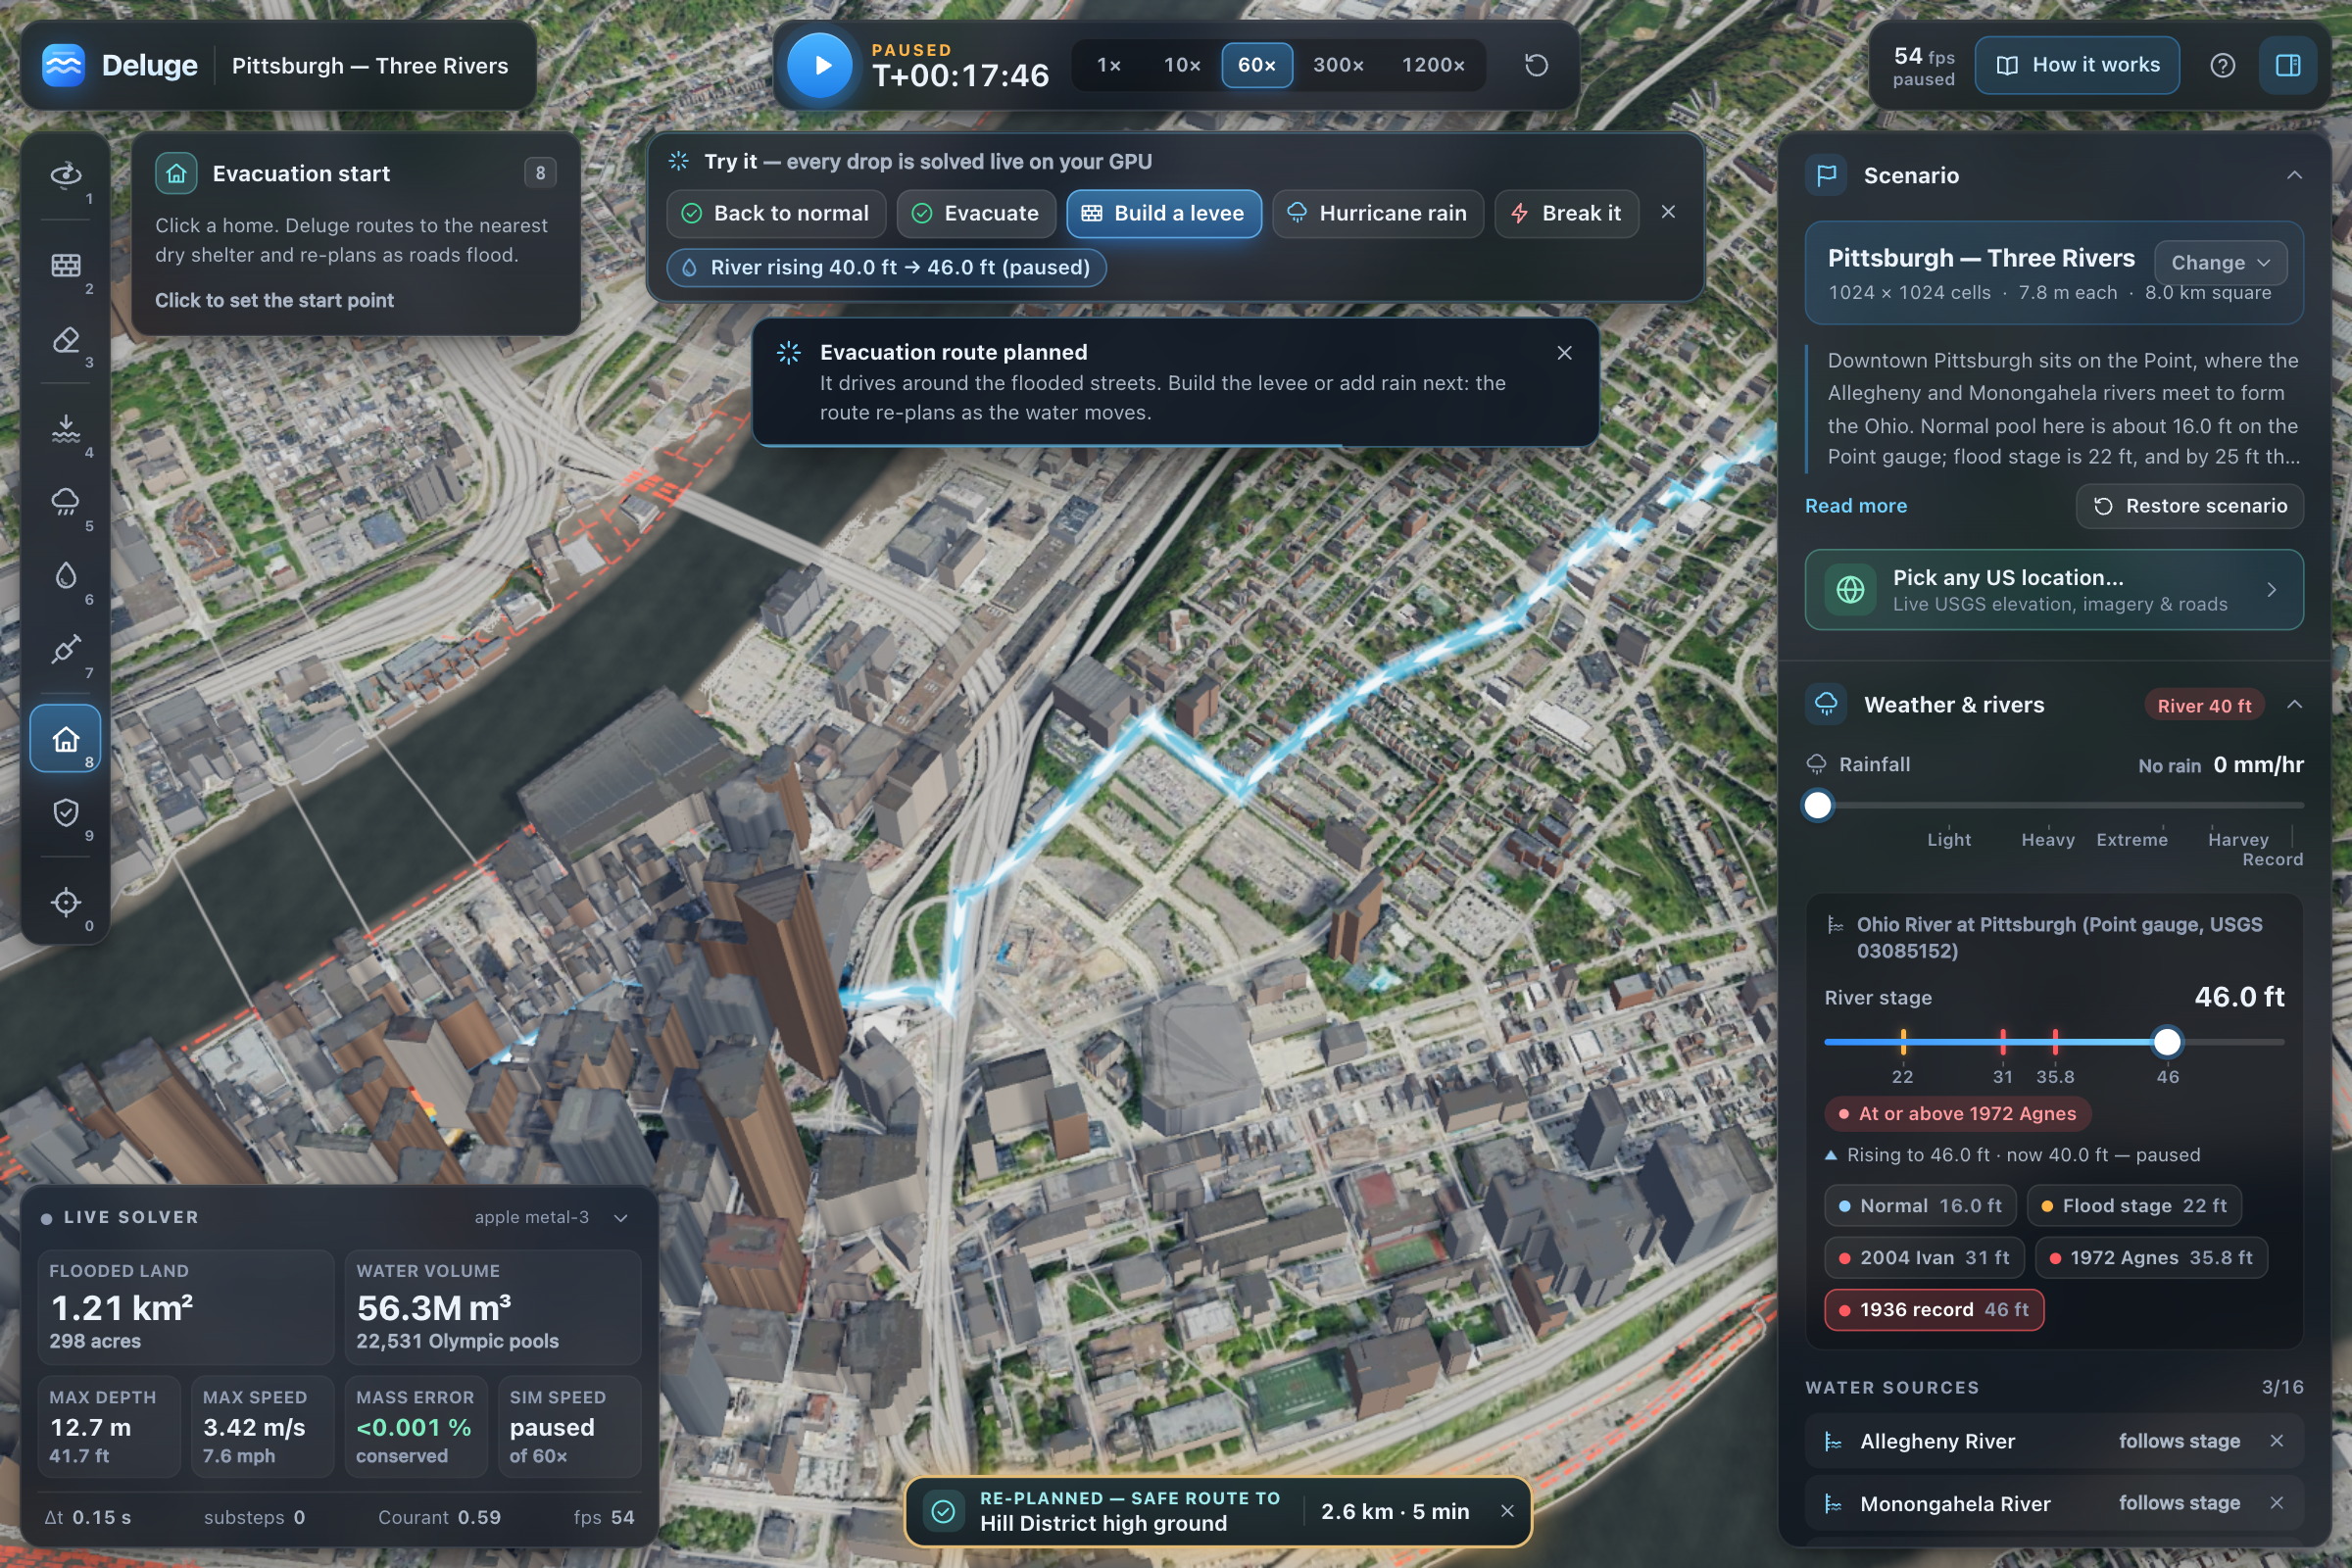
Click to build a levee. Replays 1936 against it. Saves 139 acres and 11 km of streets from water.
-
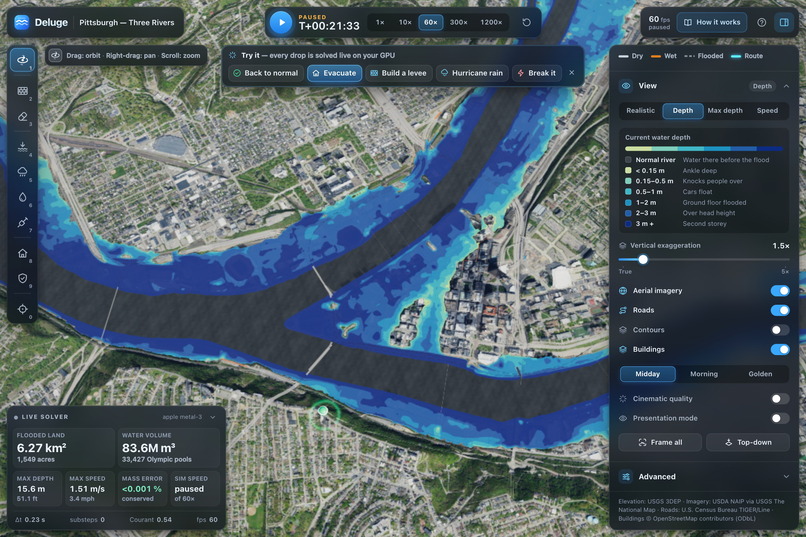
Pittsburgh 1936 crest at 46 feet: 6.27 km² flooded, 83.6 million m³, mass-balance error 0.001%.
-
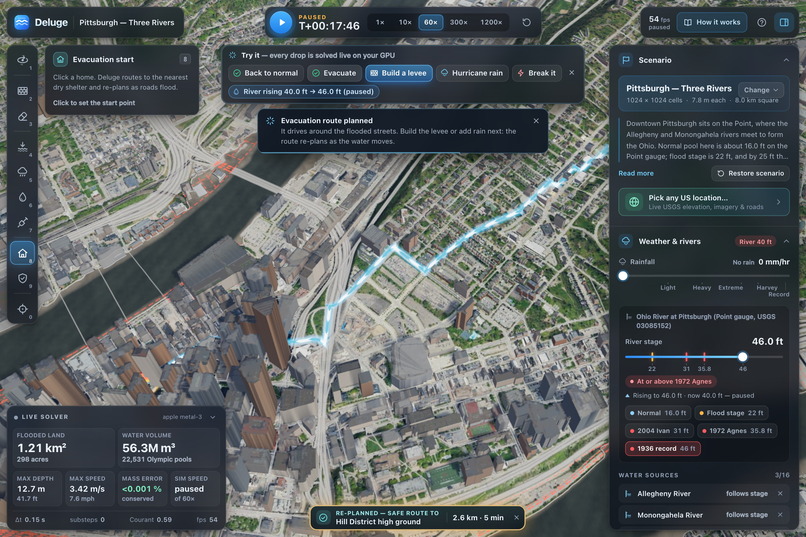
Evacuation re-plans live on Census roads: 2.6 km to Hill District high ground as floods rise.
-
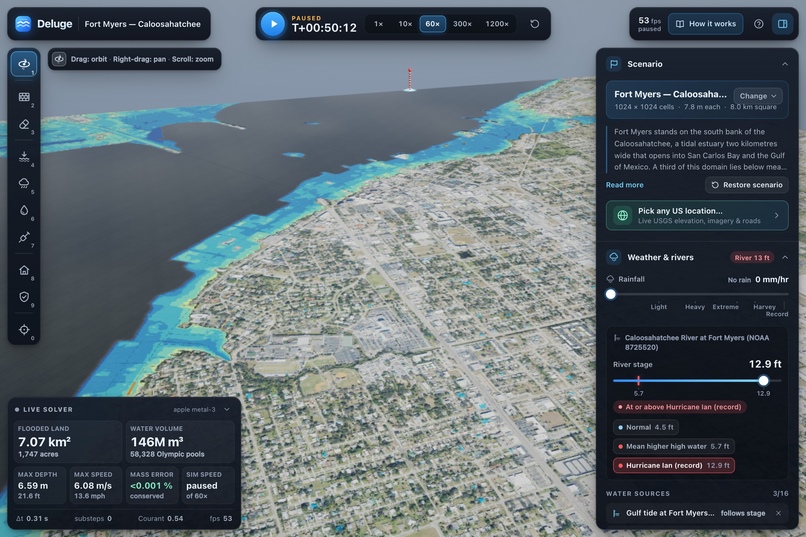
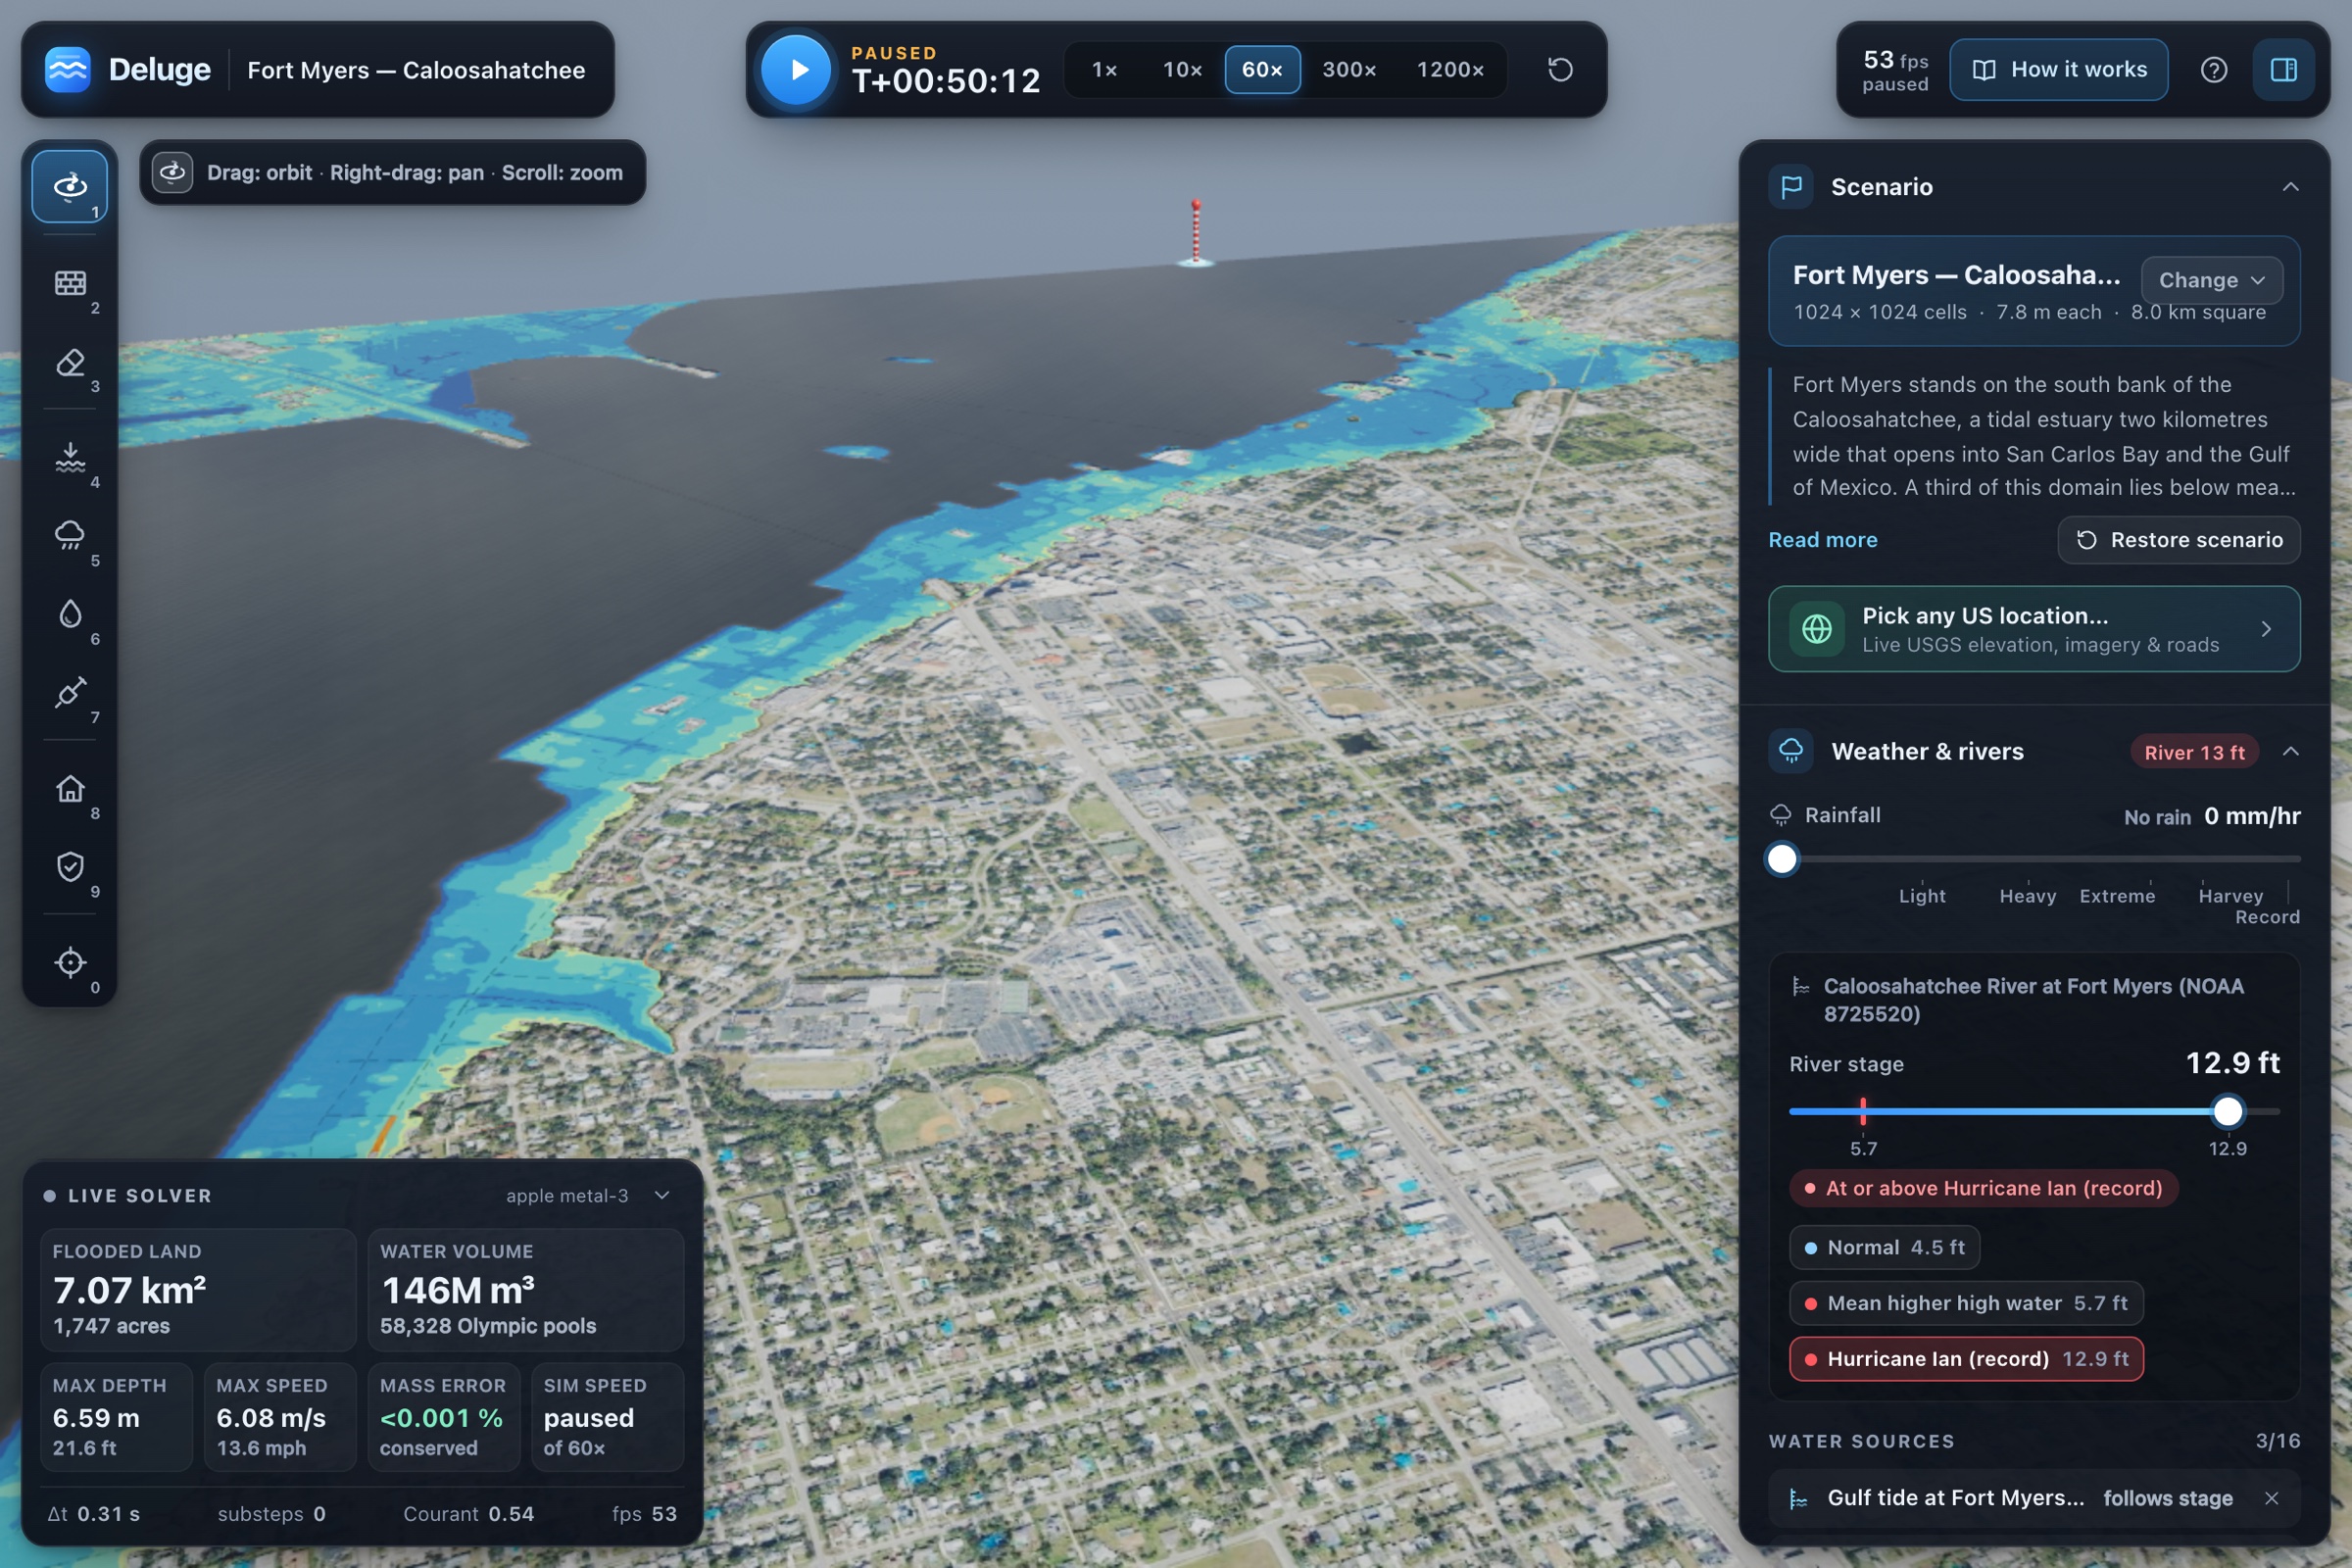
Ian’s 12.9 ft surge pushes Gulf water up Caloosahatchee estuary to Fort Myers: 146 million m³.
-
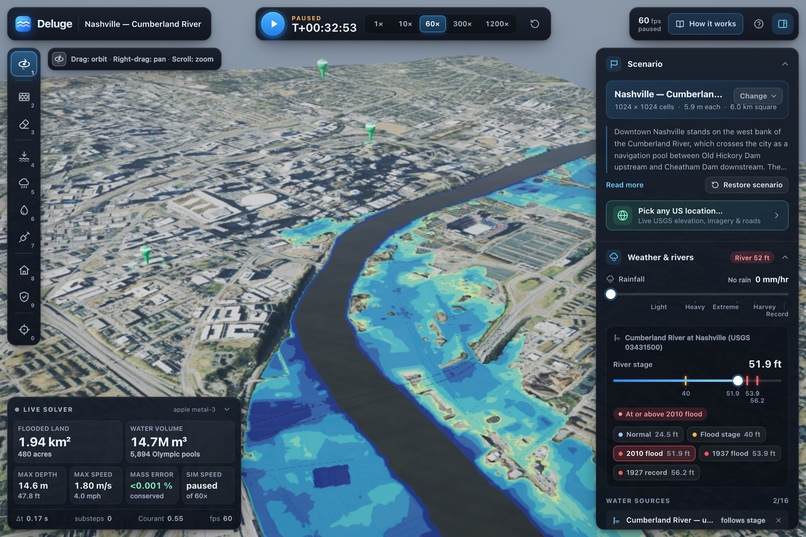
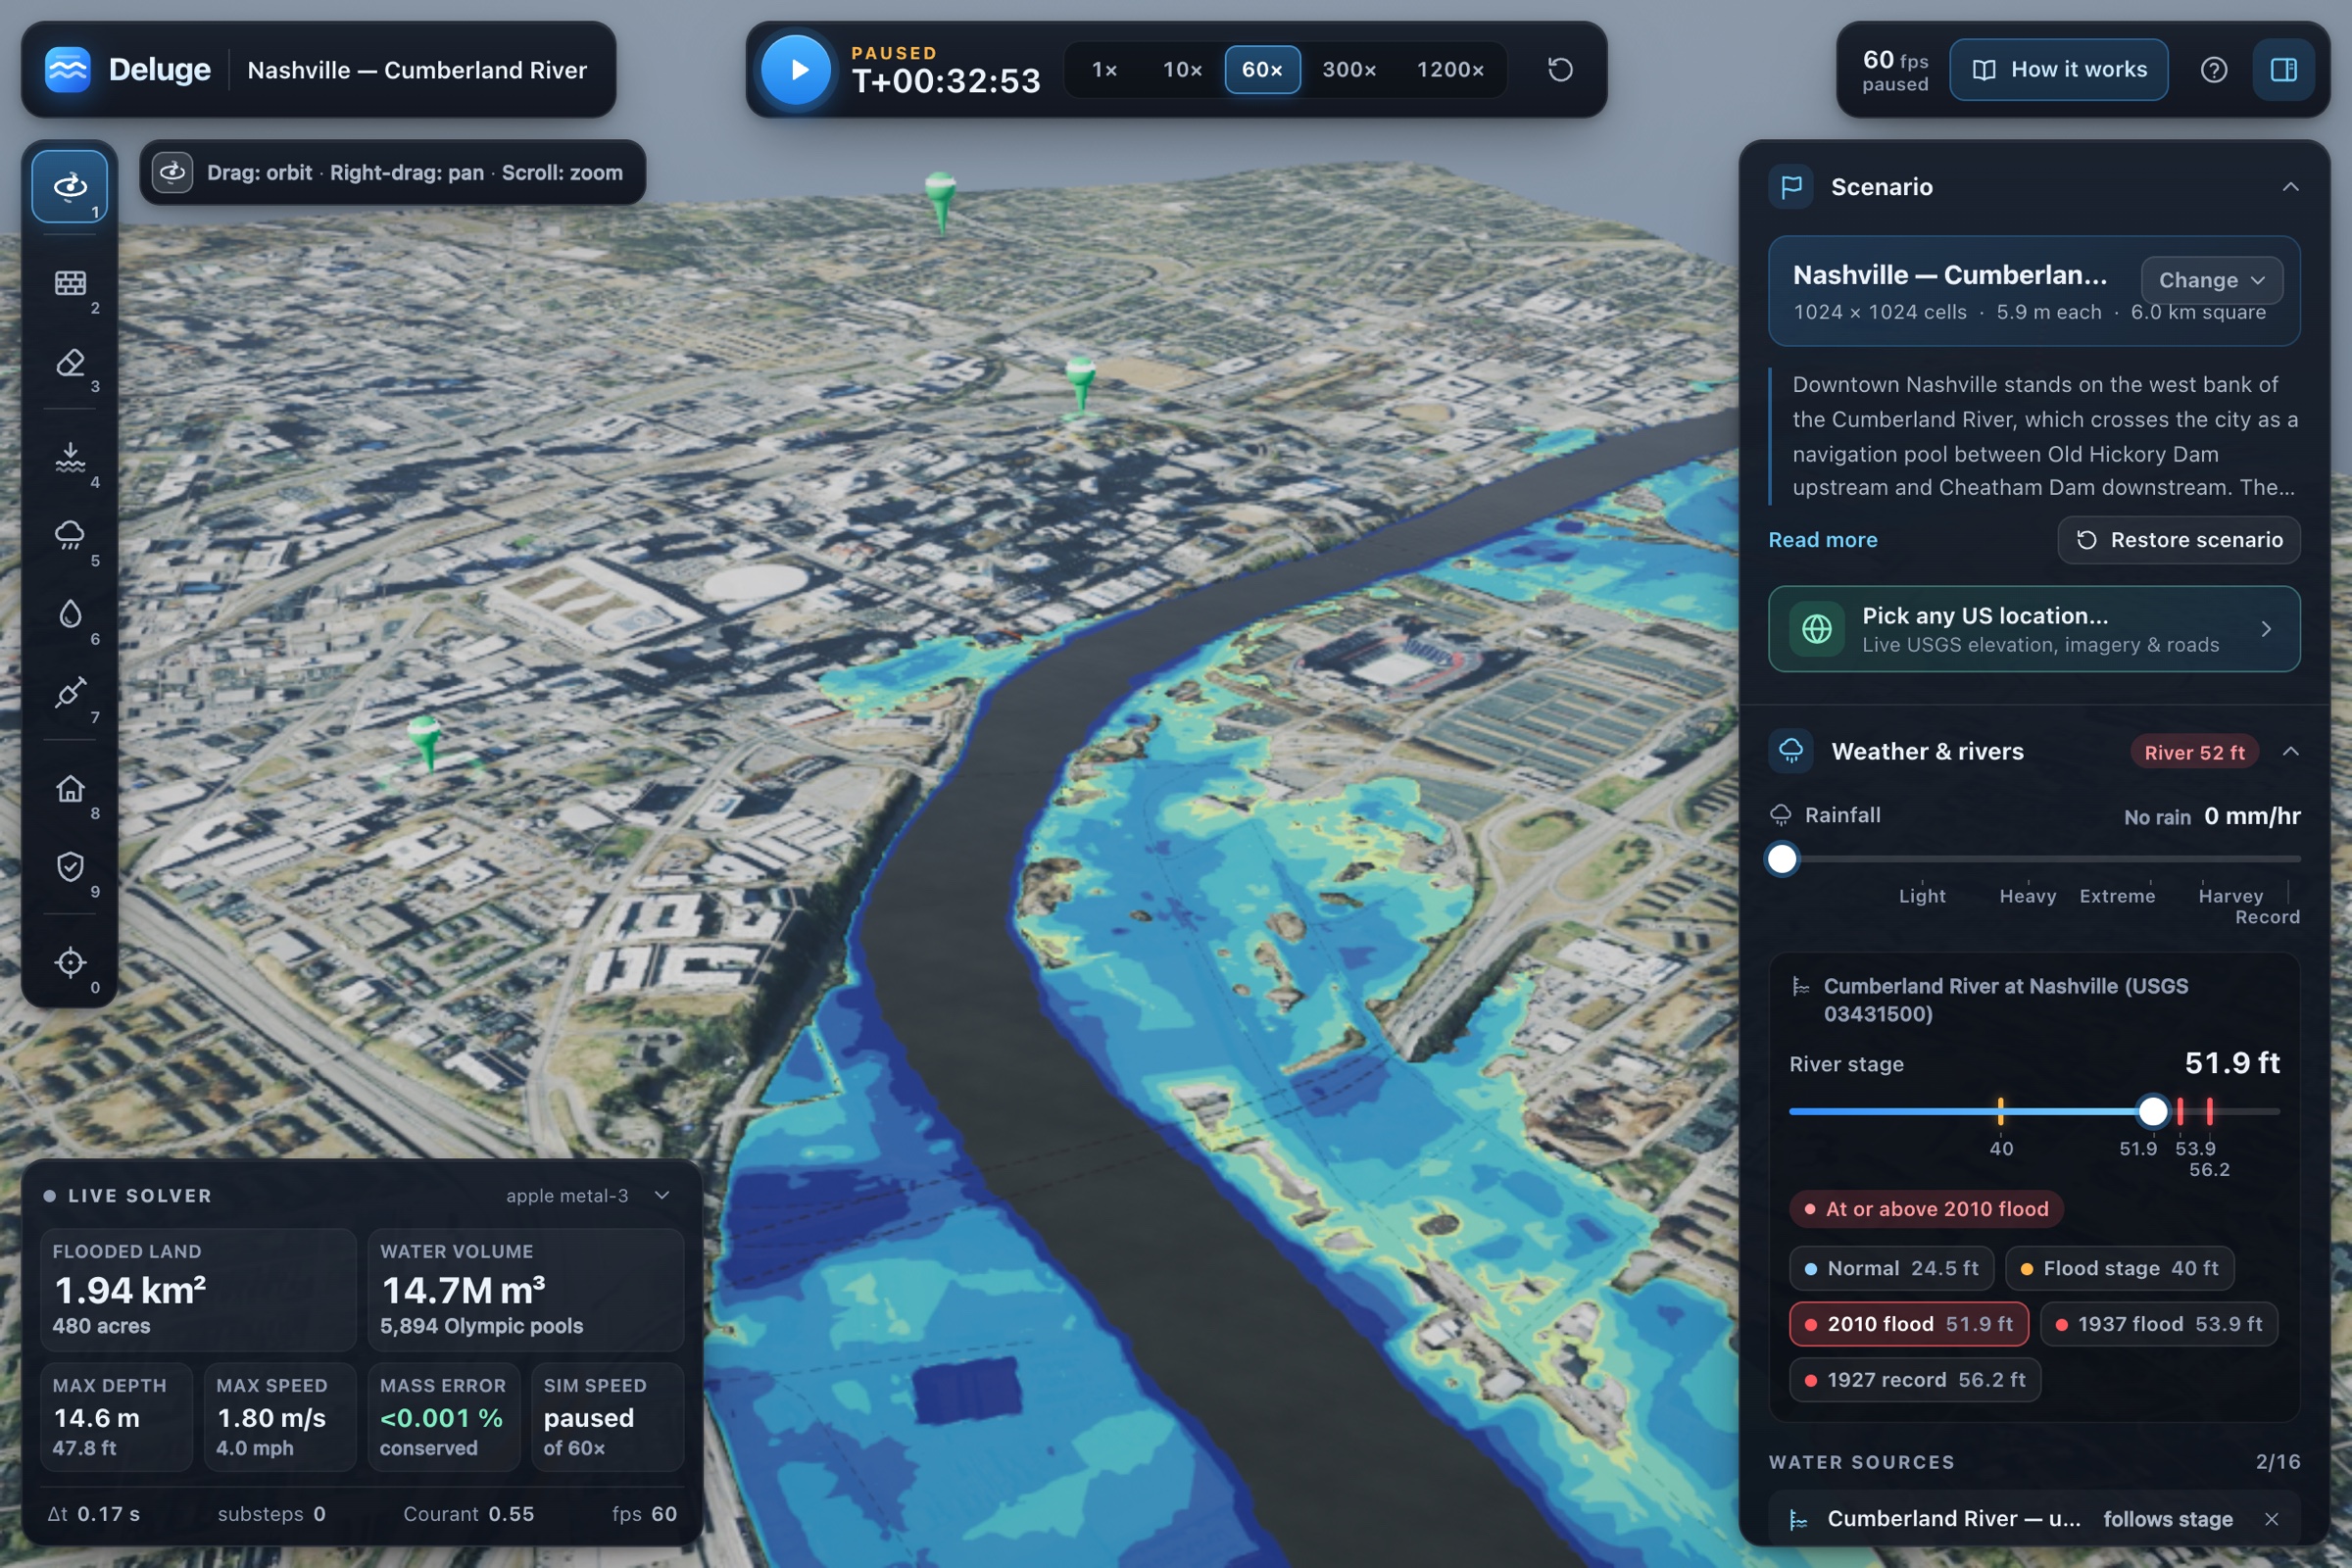
Cumberland at 51.9 ft (May 2010 peak): east bank floods, downtown’s higher west bluff stays dry.
-
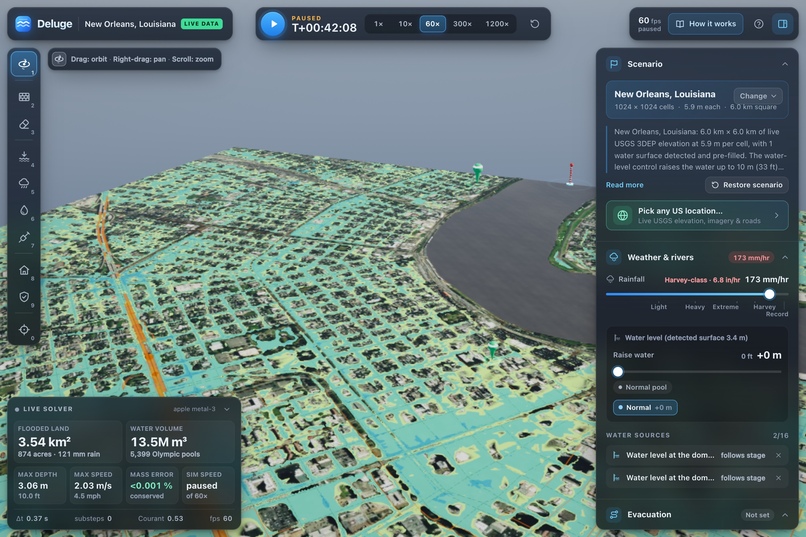
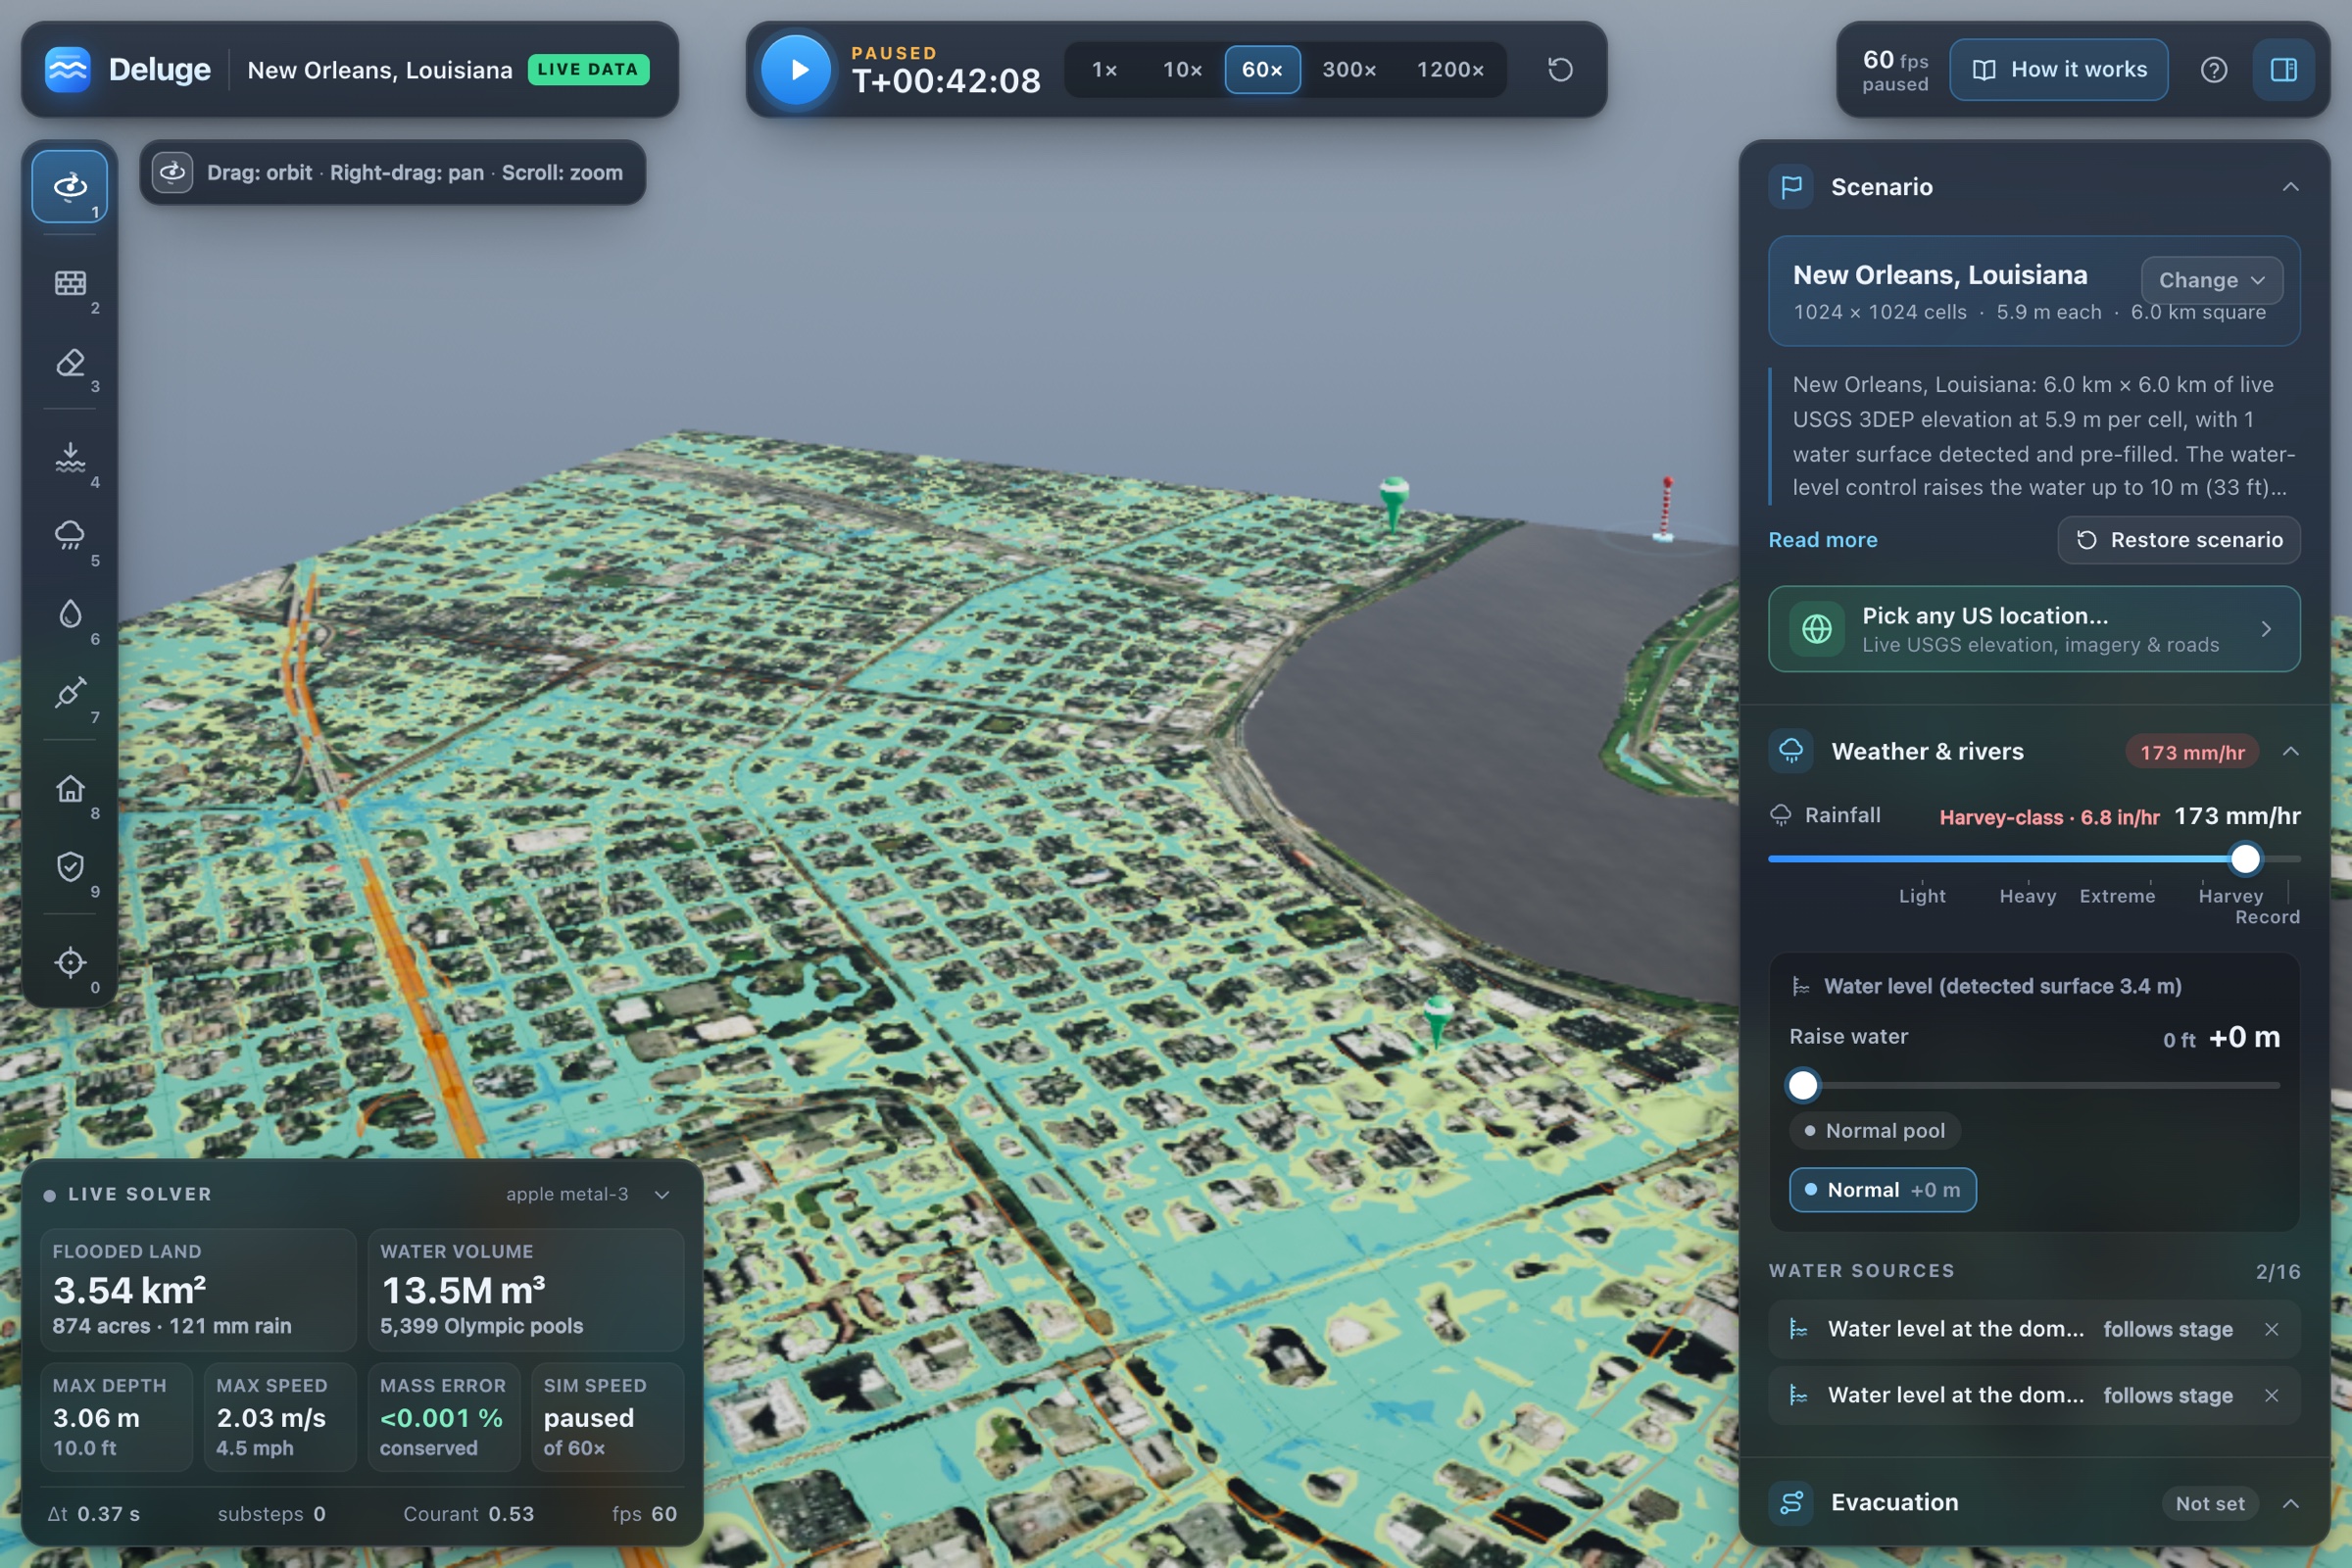
Live New Orleans pulled from USGS data: any US location pipeline live, Harvey rain, instant result.
-
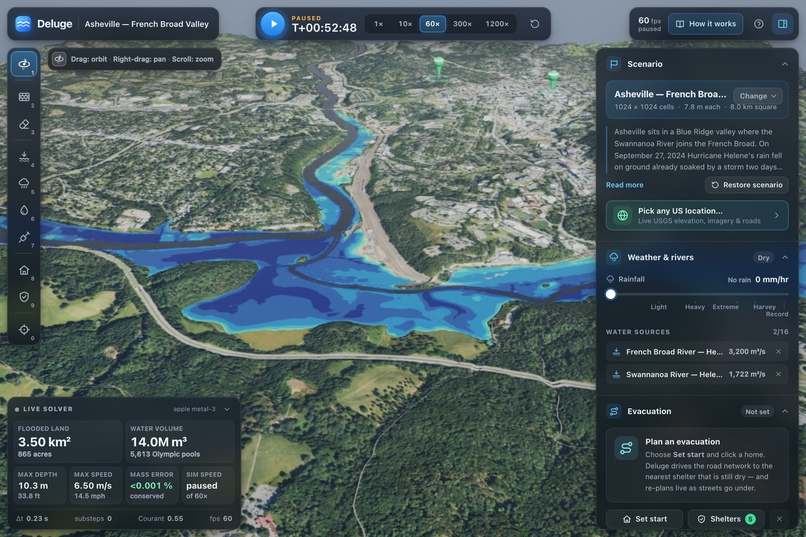
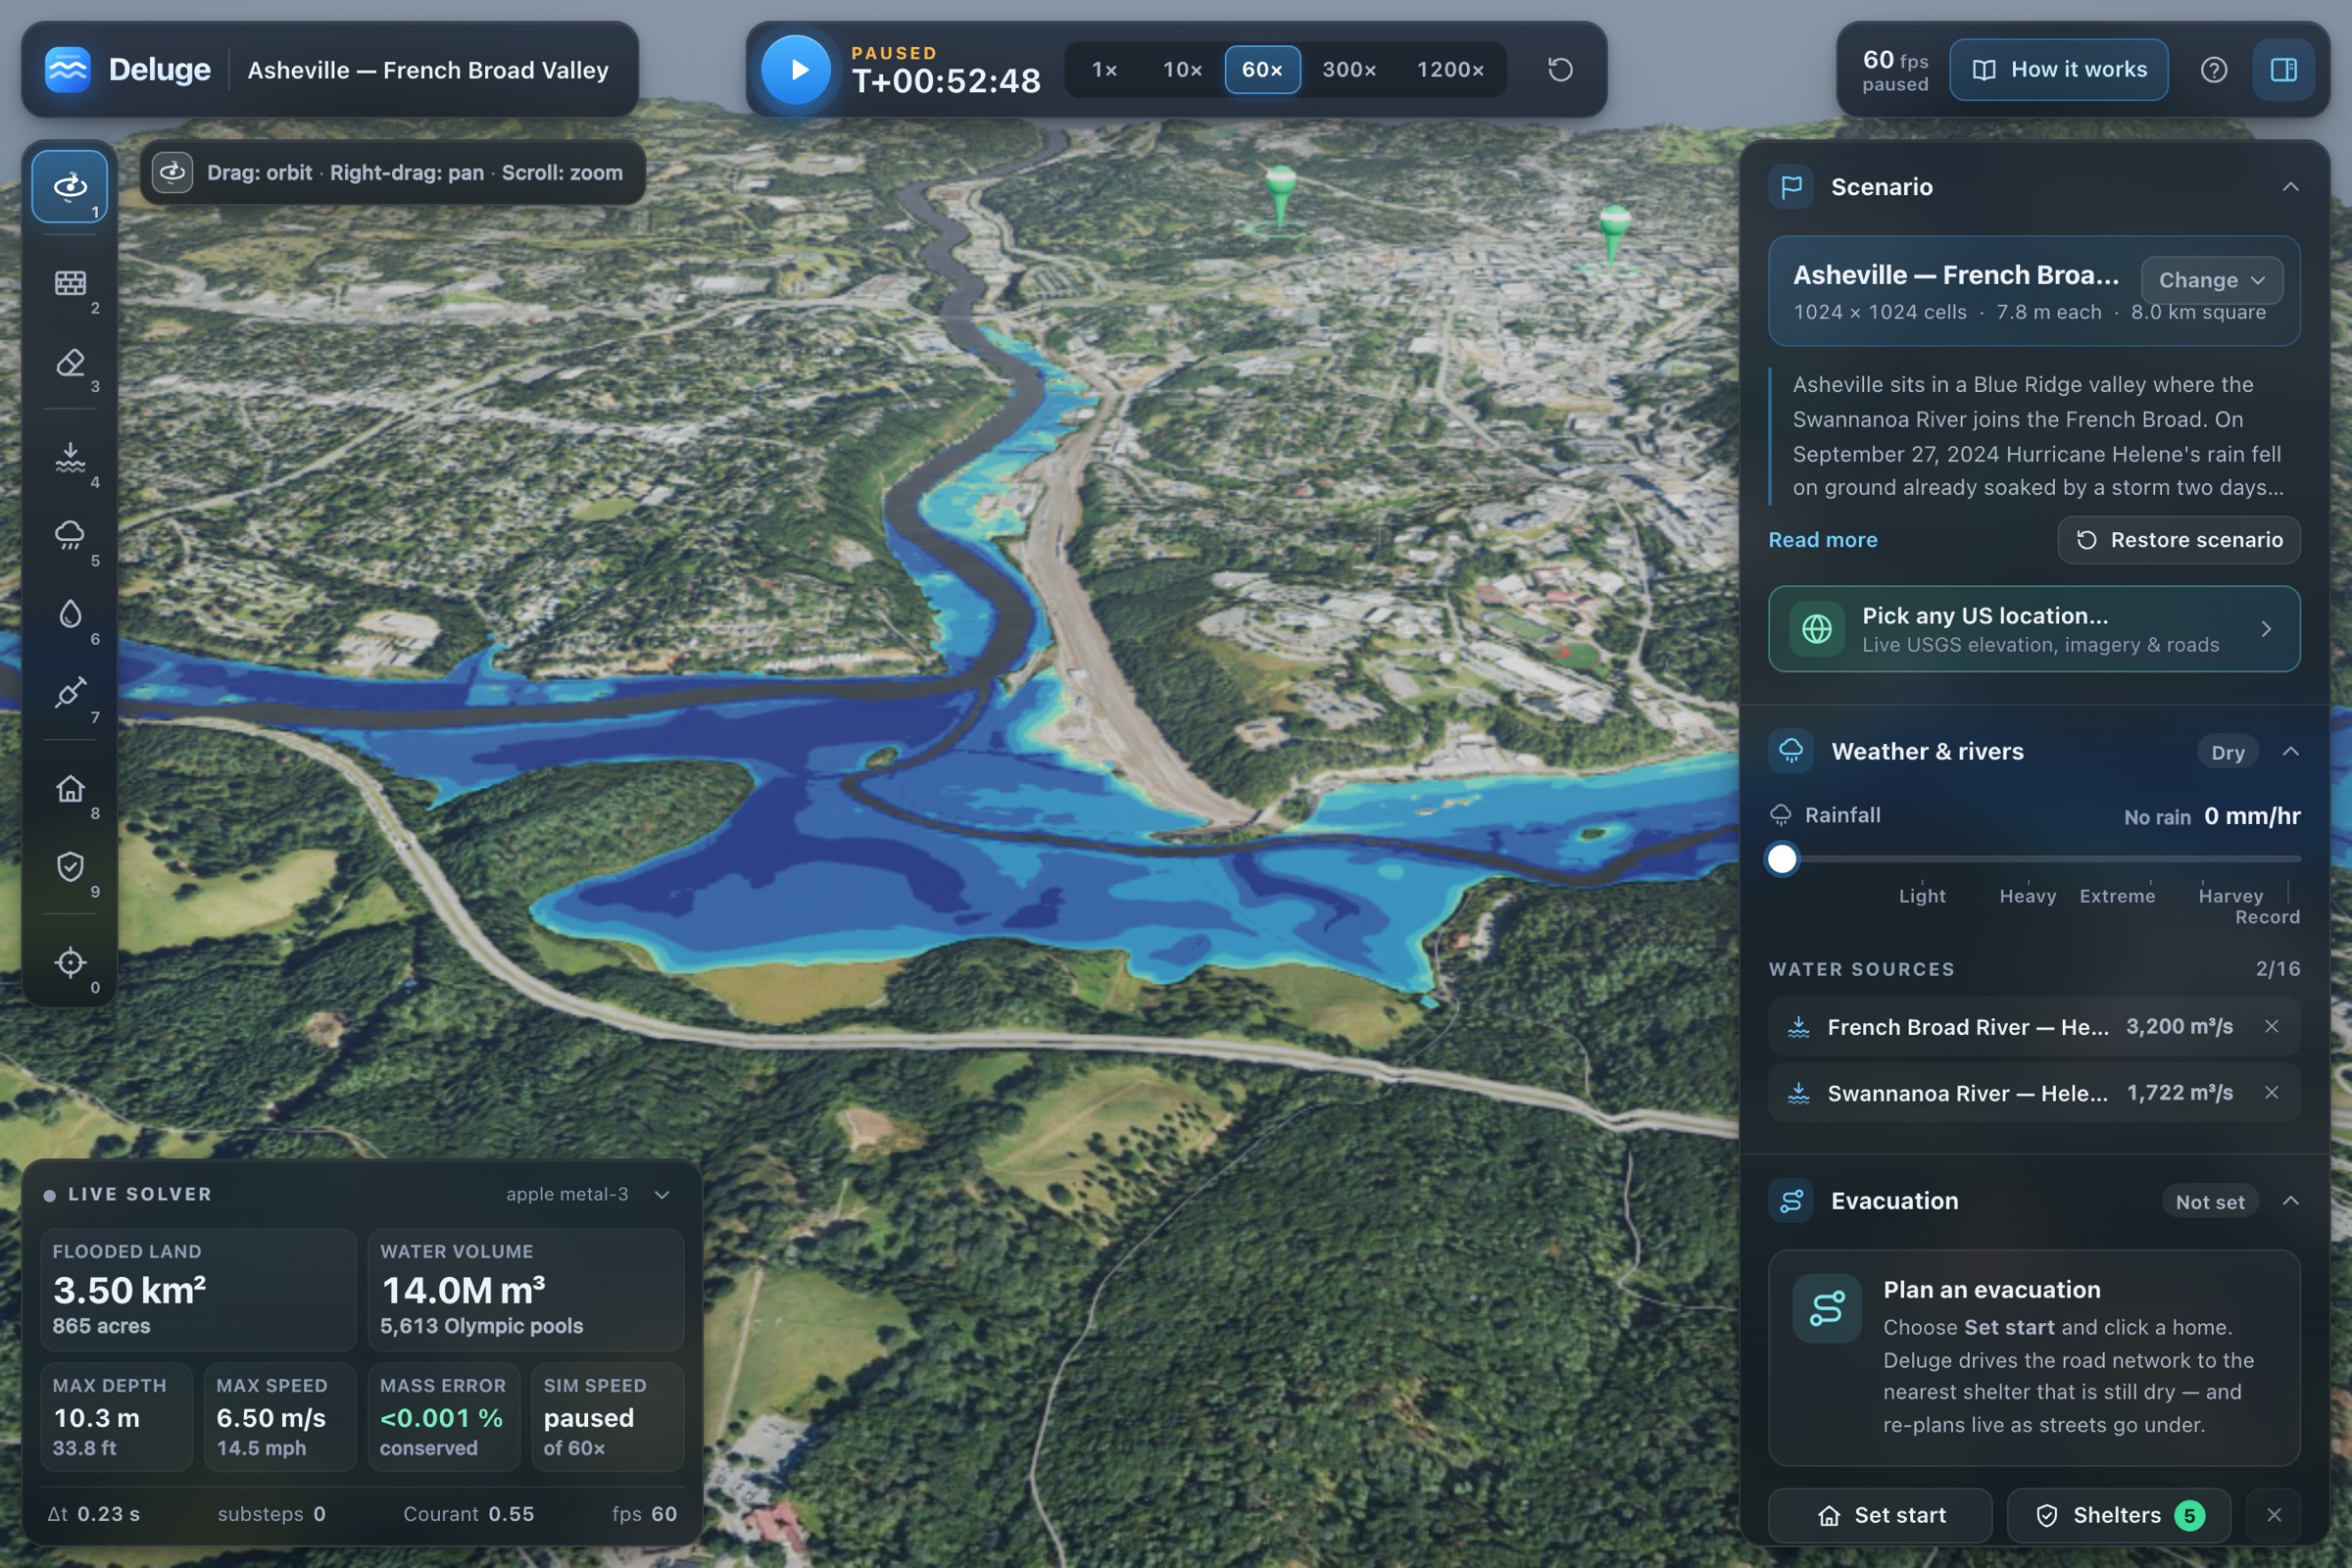
Hurricane Helene: French Broad and Swannanoa meet at Asheville, confluence drowns the river flats.
-
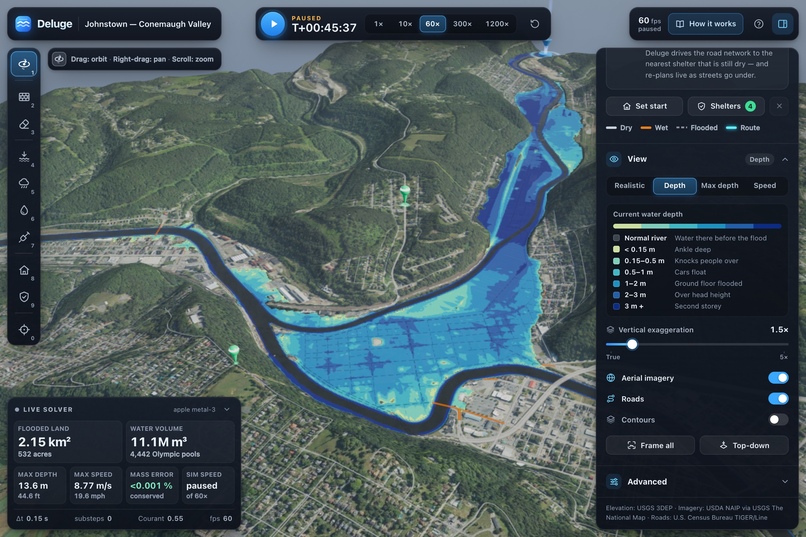
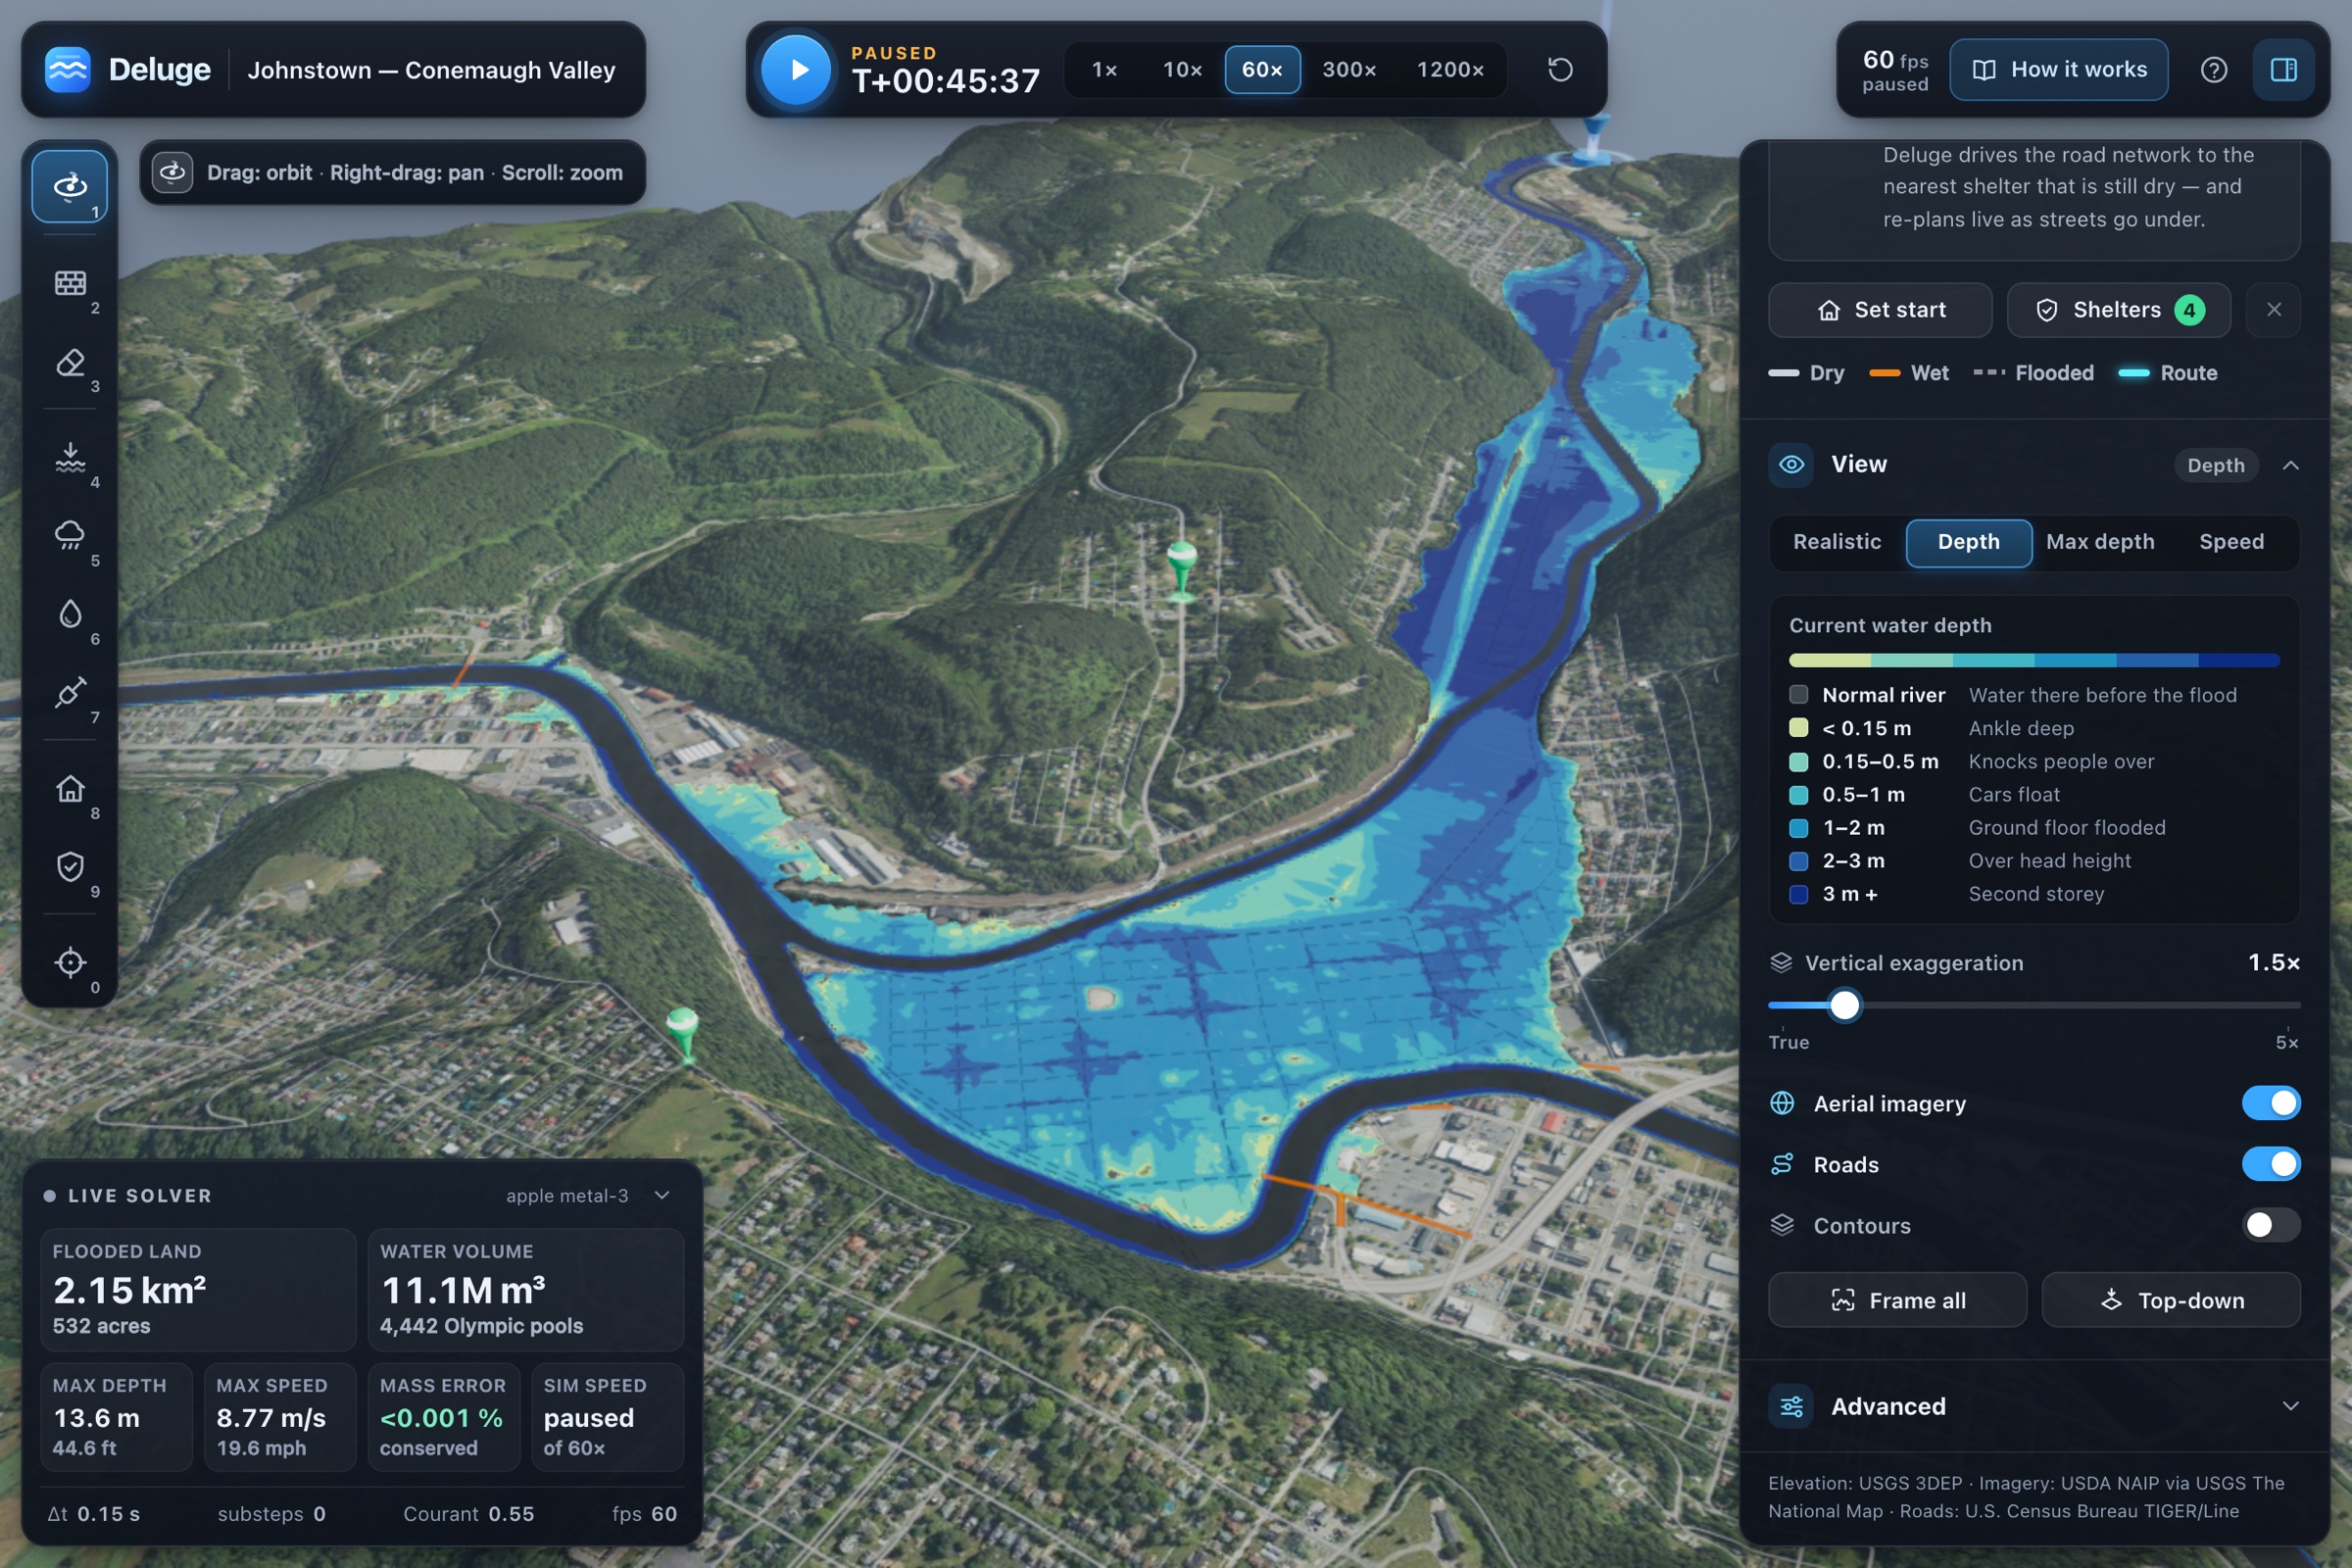
1889 Johnstown dam-break: 8,970 m³/s down Little Conemaugh, flat downtown fills between dry hills.
-
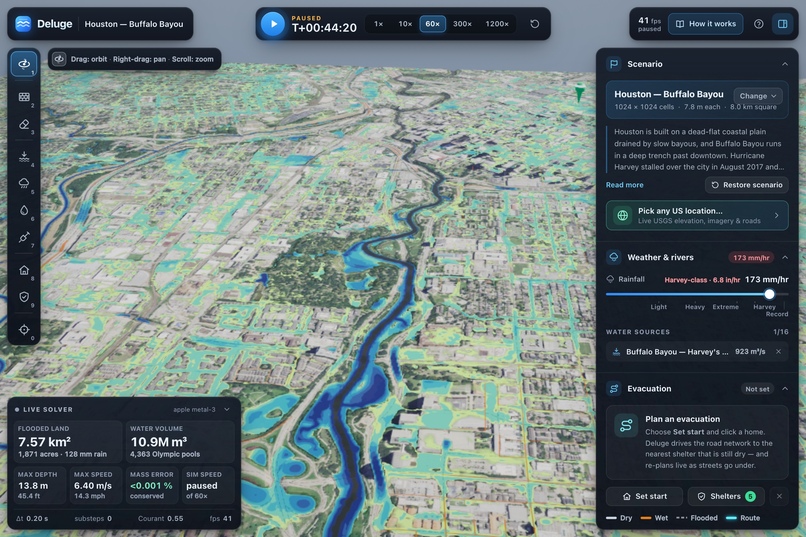
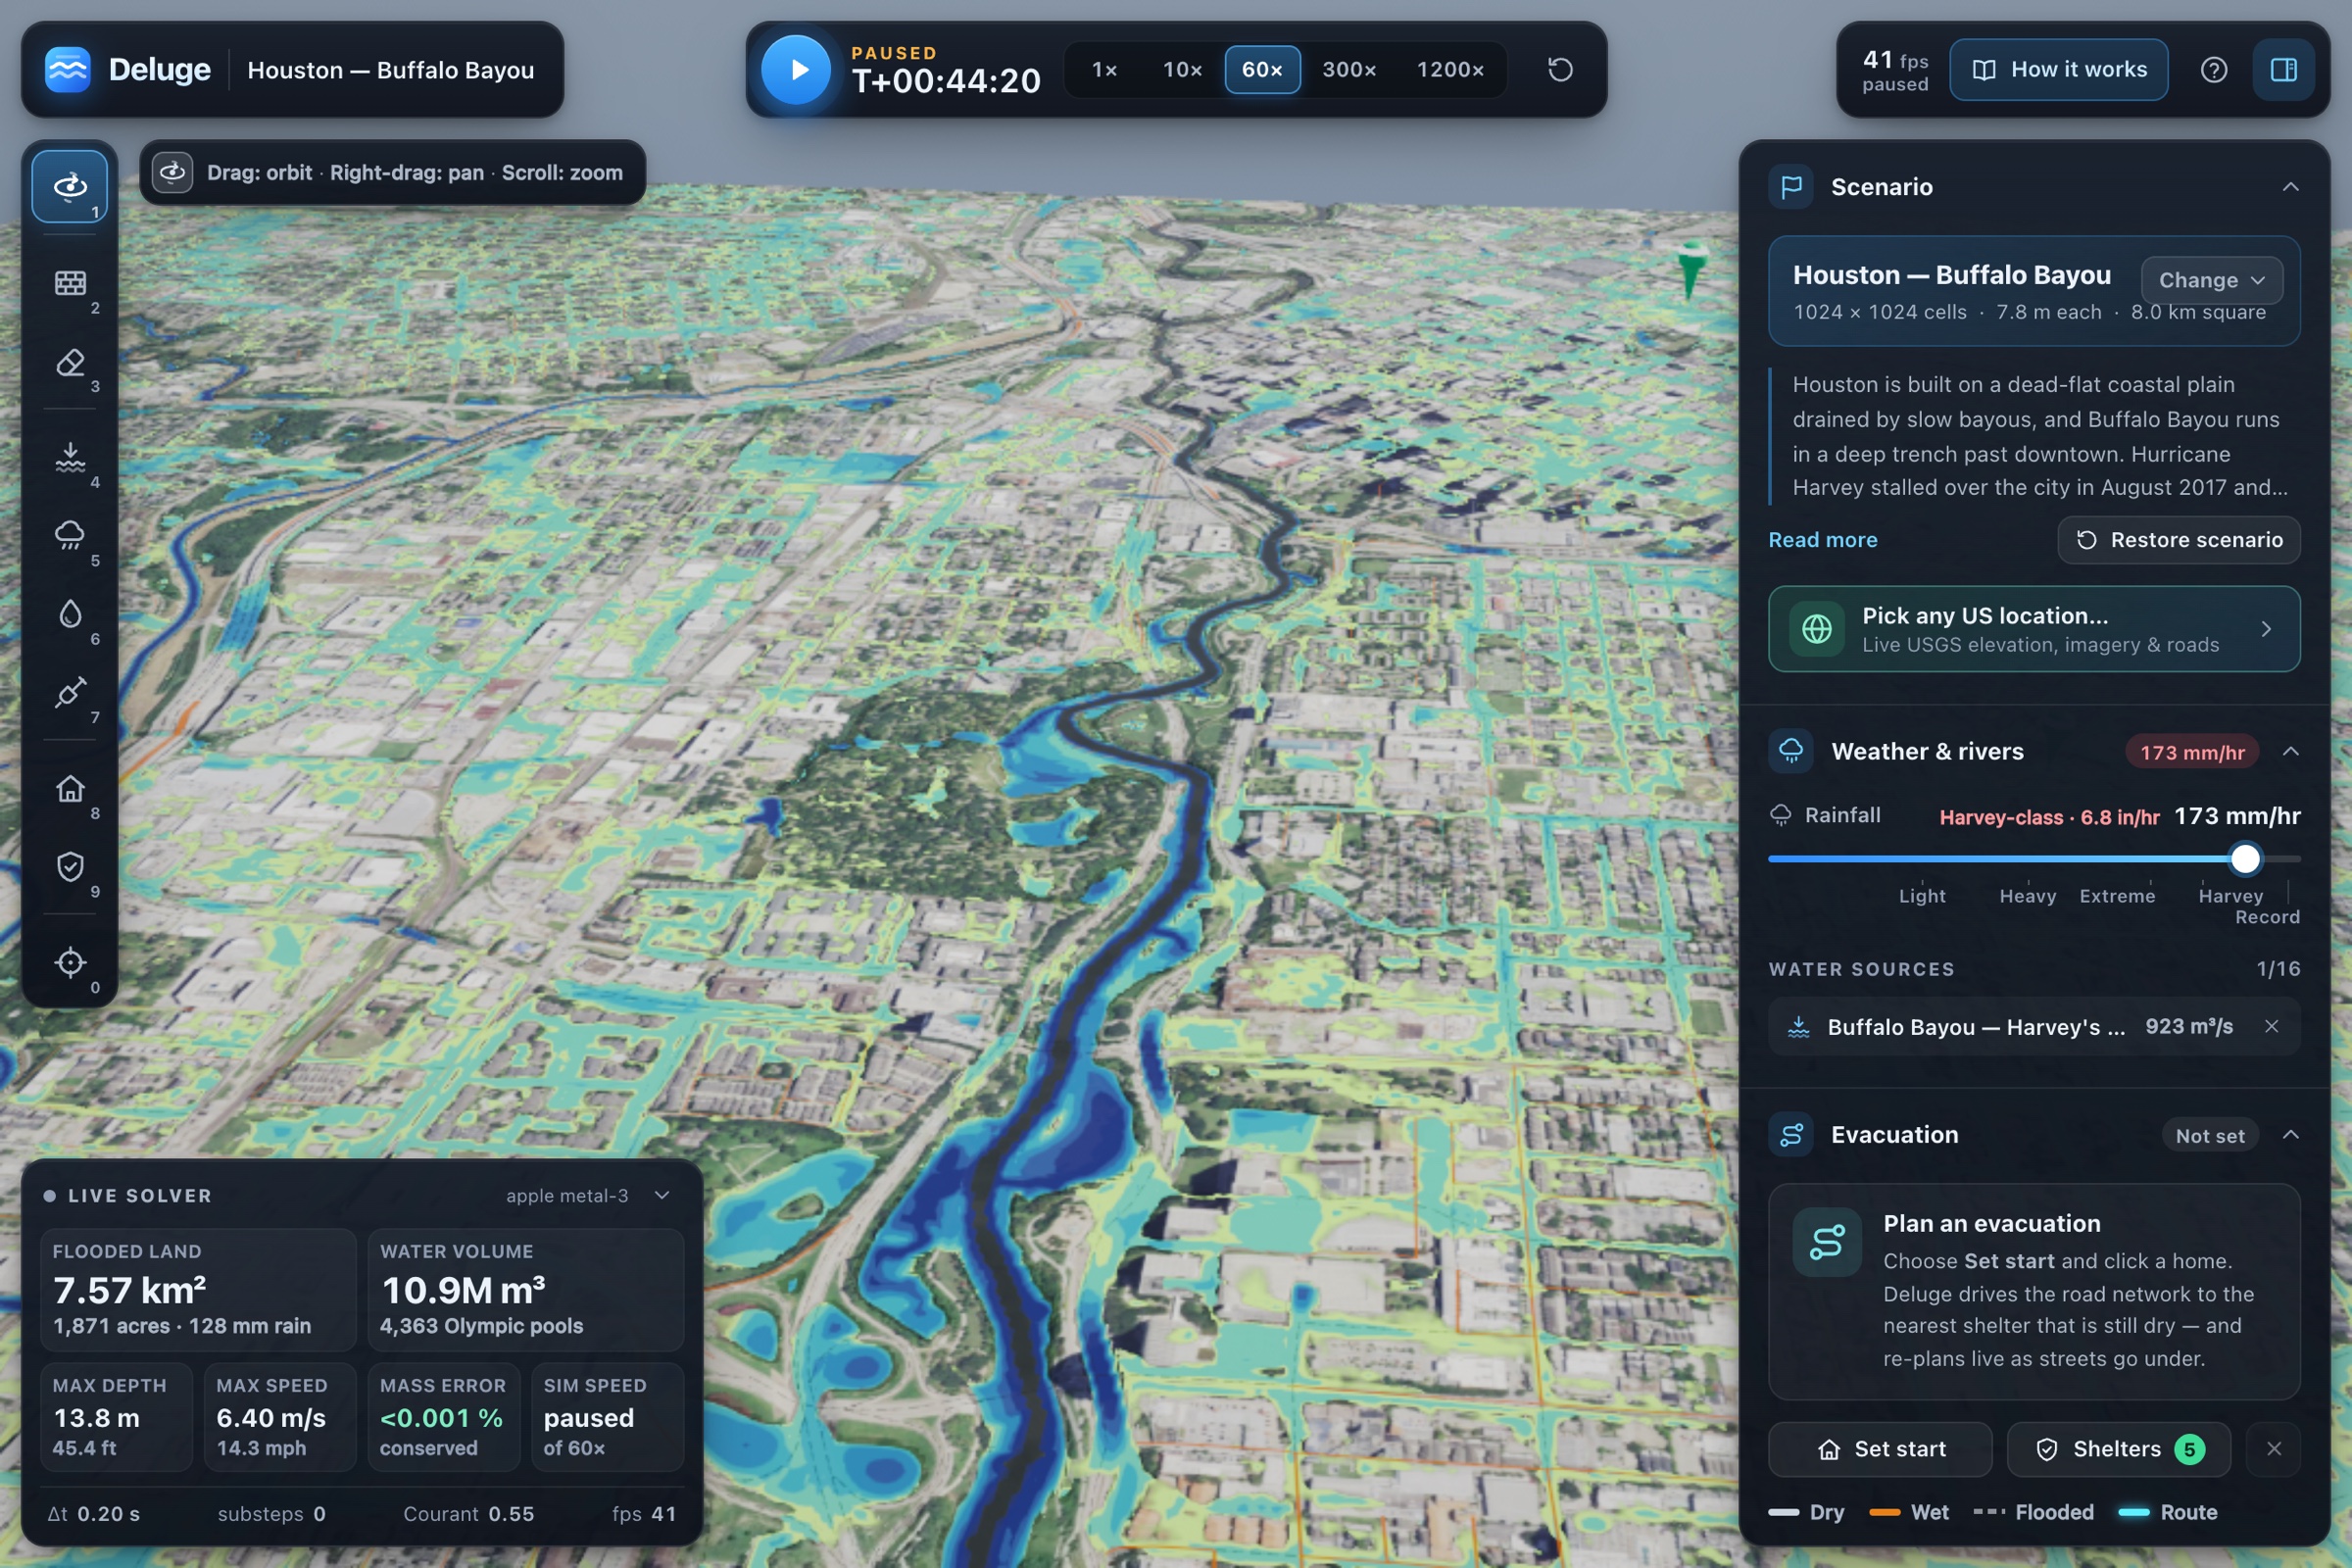
Harvey-class rain on flat Houston: Bayou fills, grid ponds, 7.57 km² underwater after 128 mm.
-
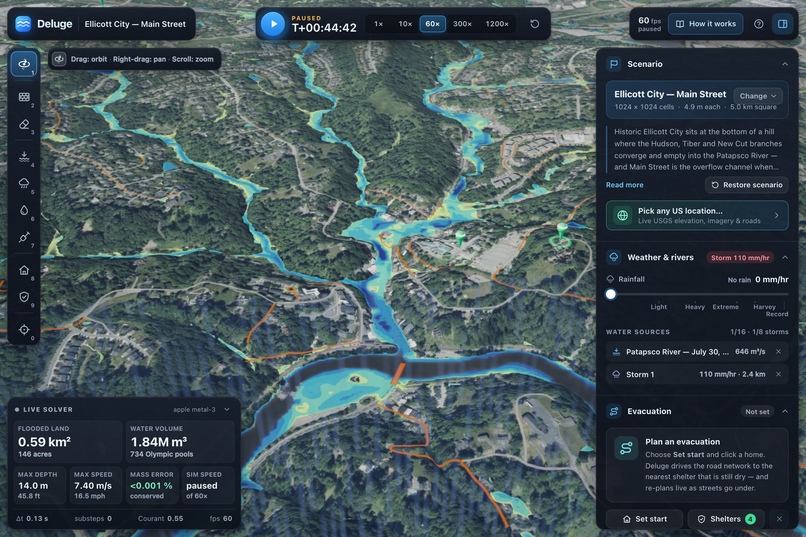
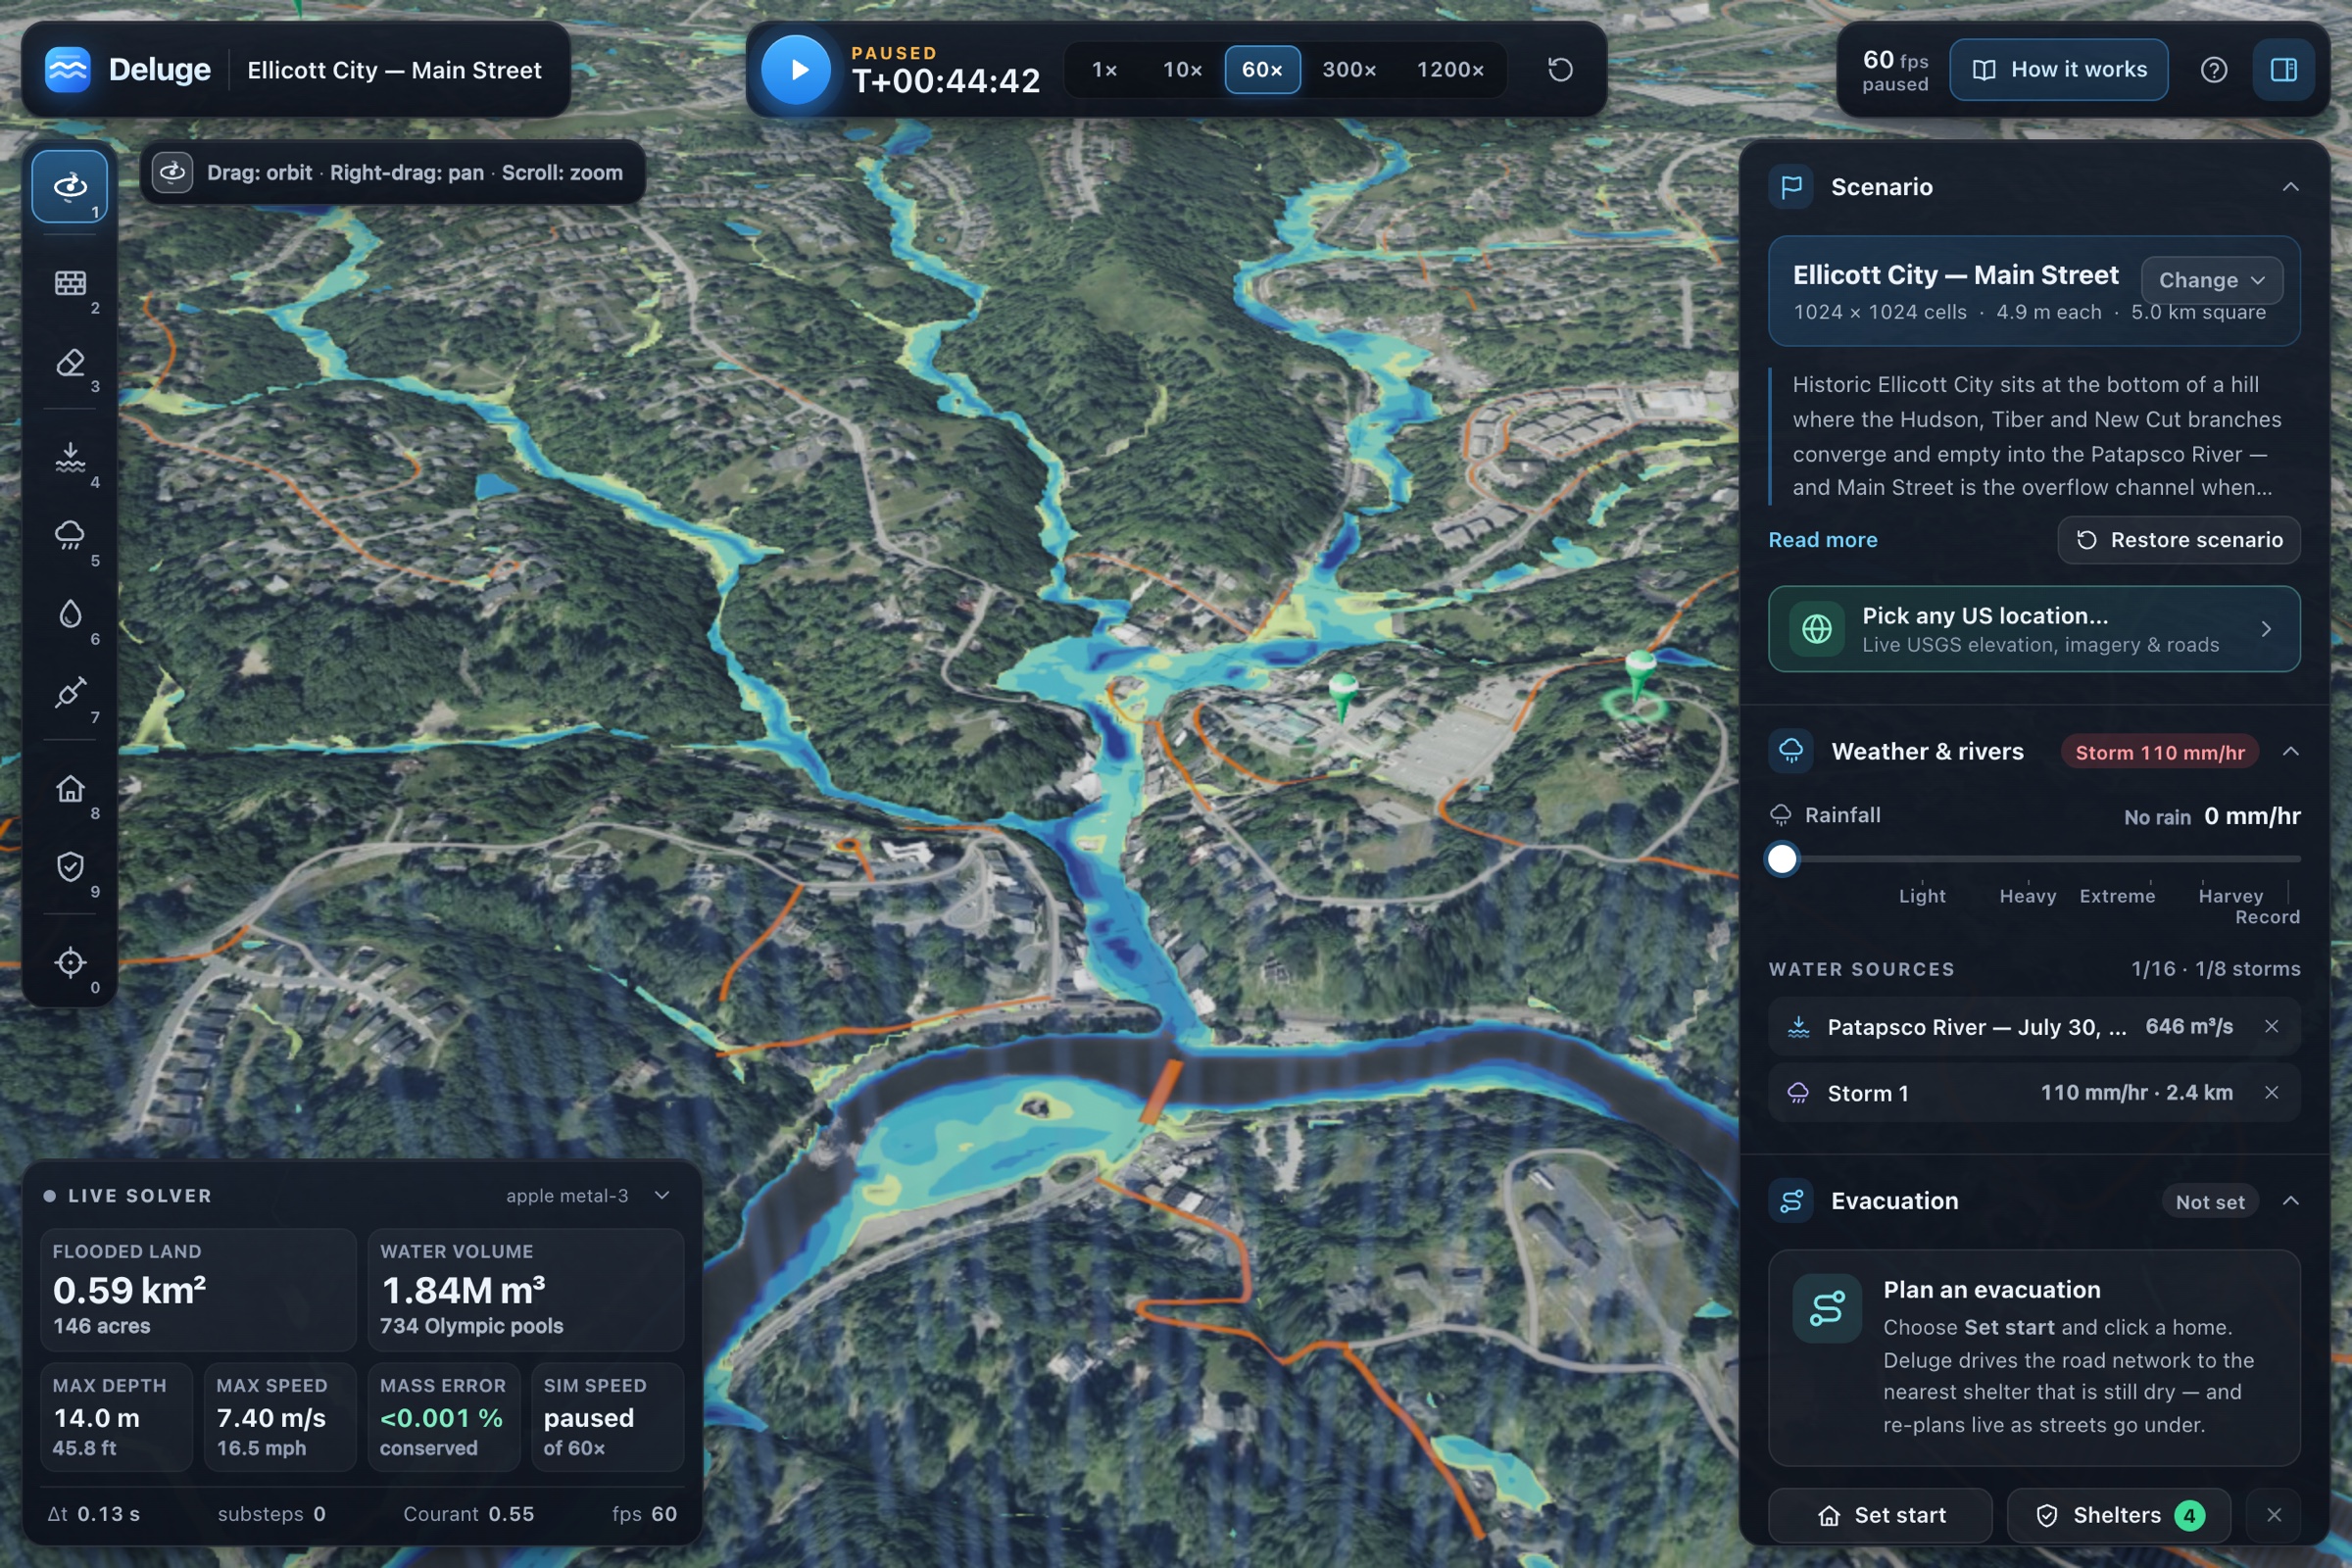
2016 Ellicott City: 110 mm/hr fills three creek branches that converge on Main Street and Patapsco.
-
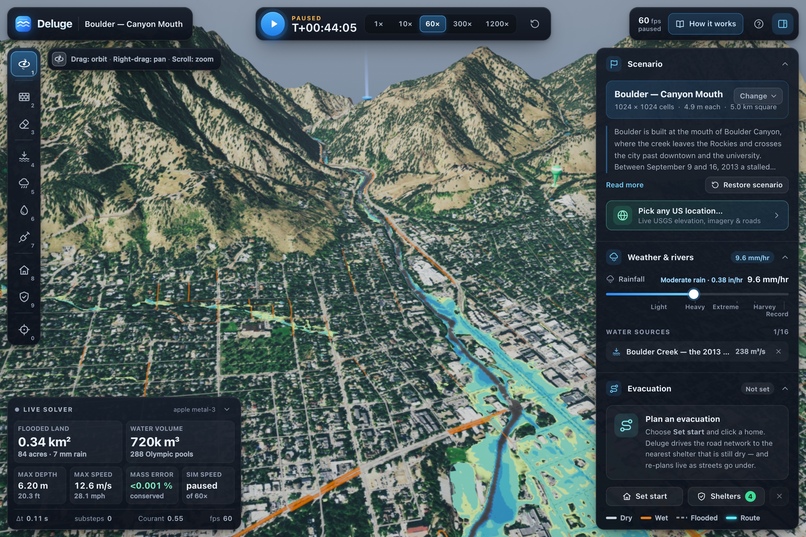
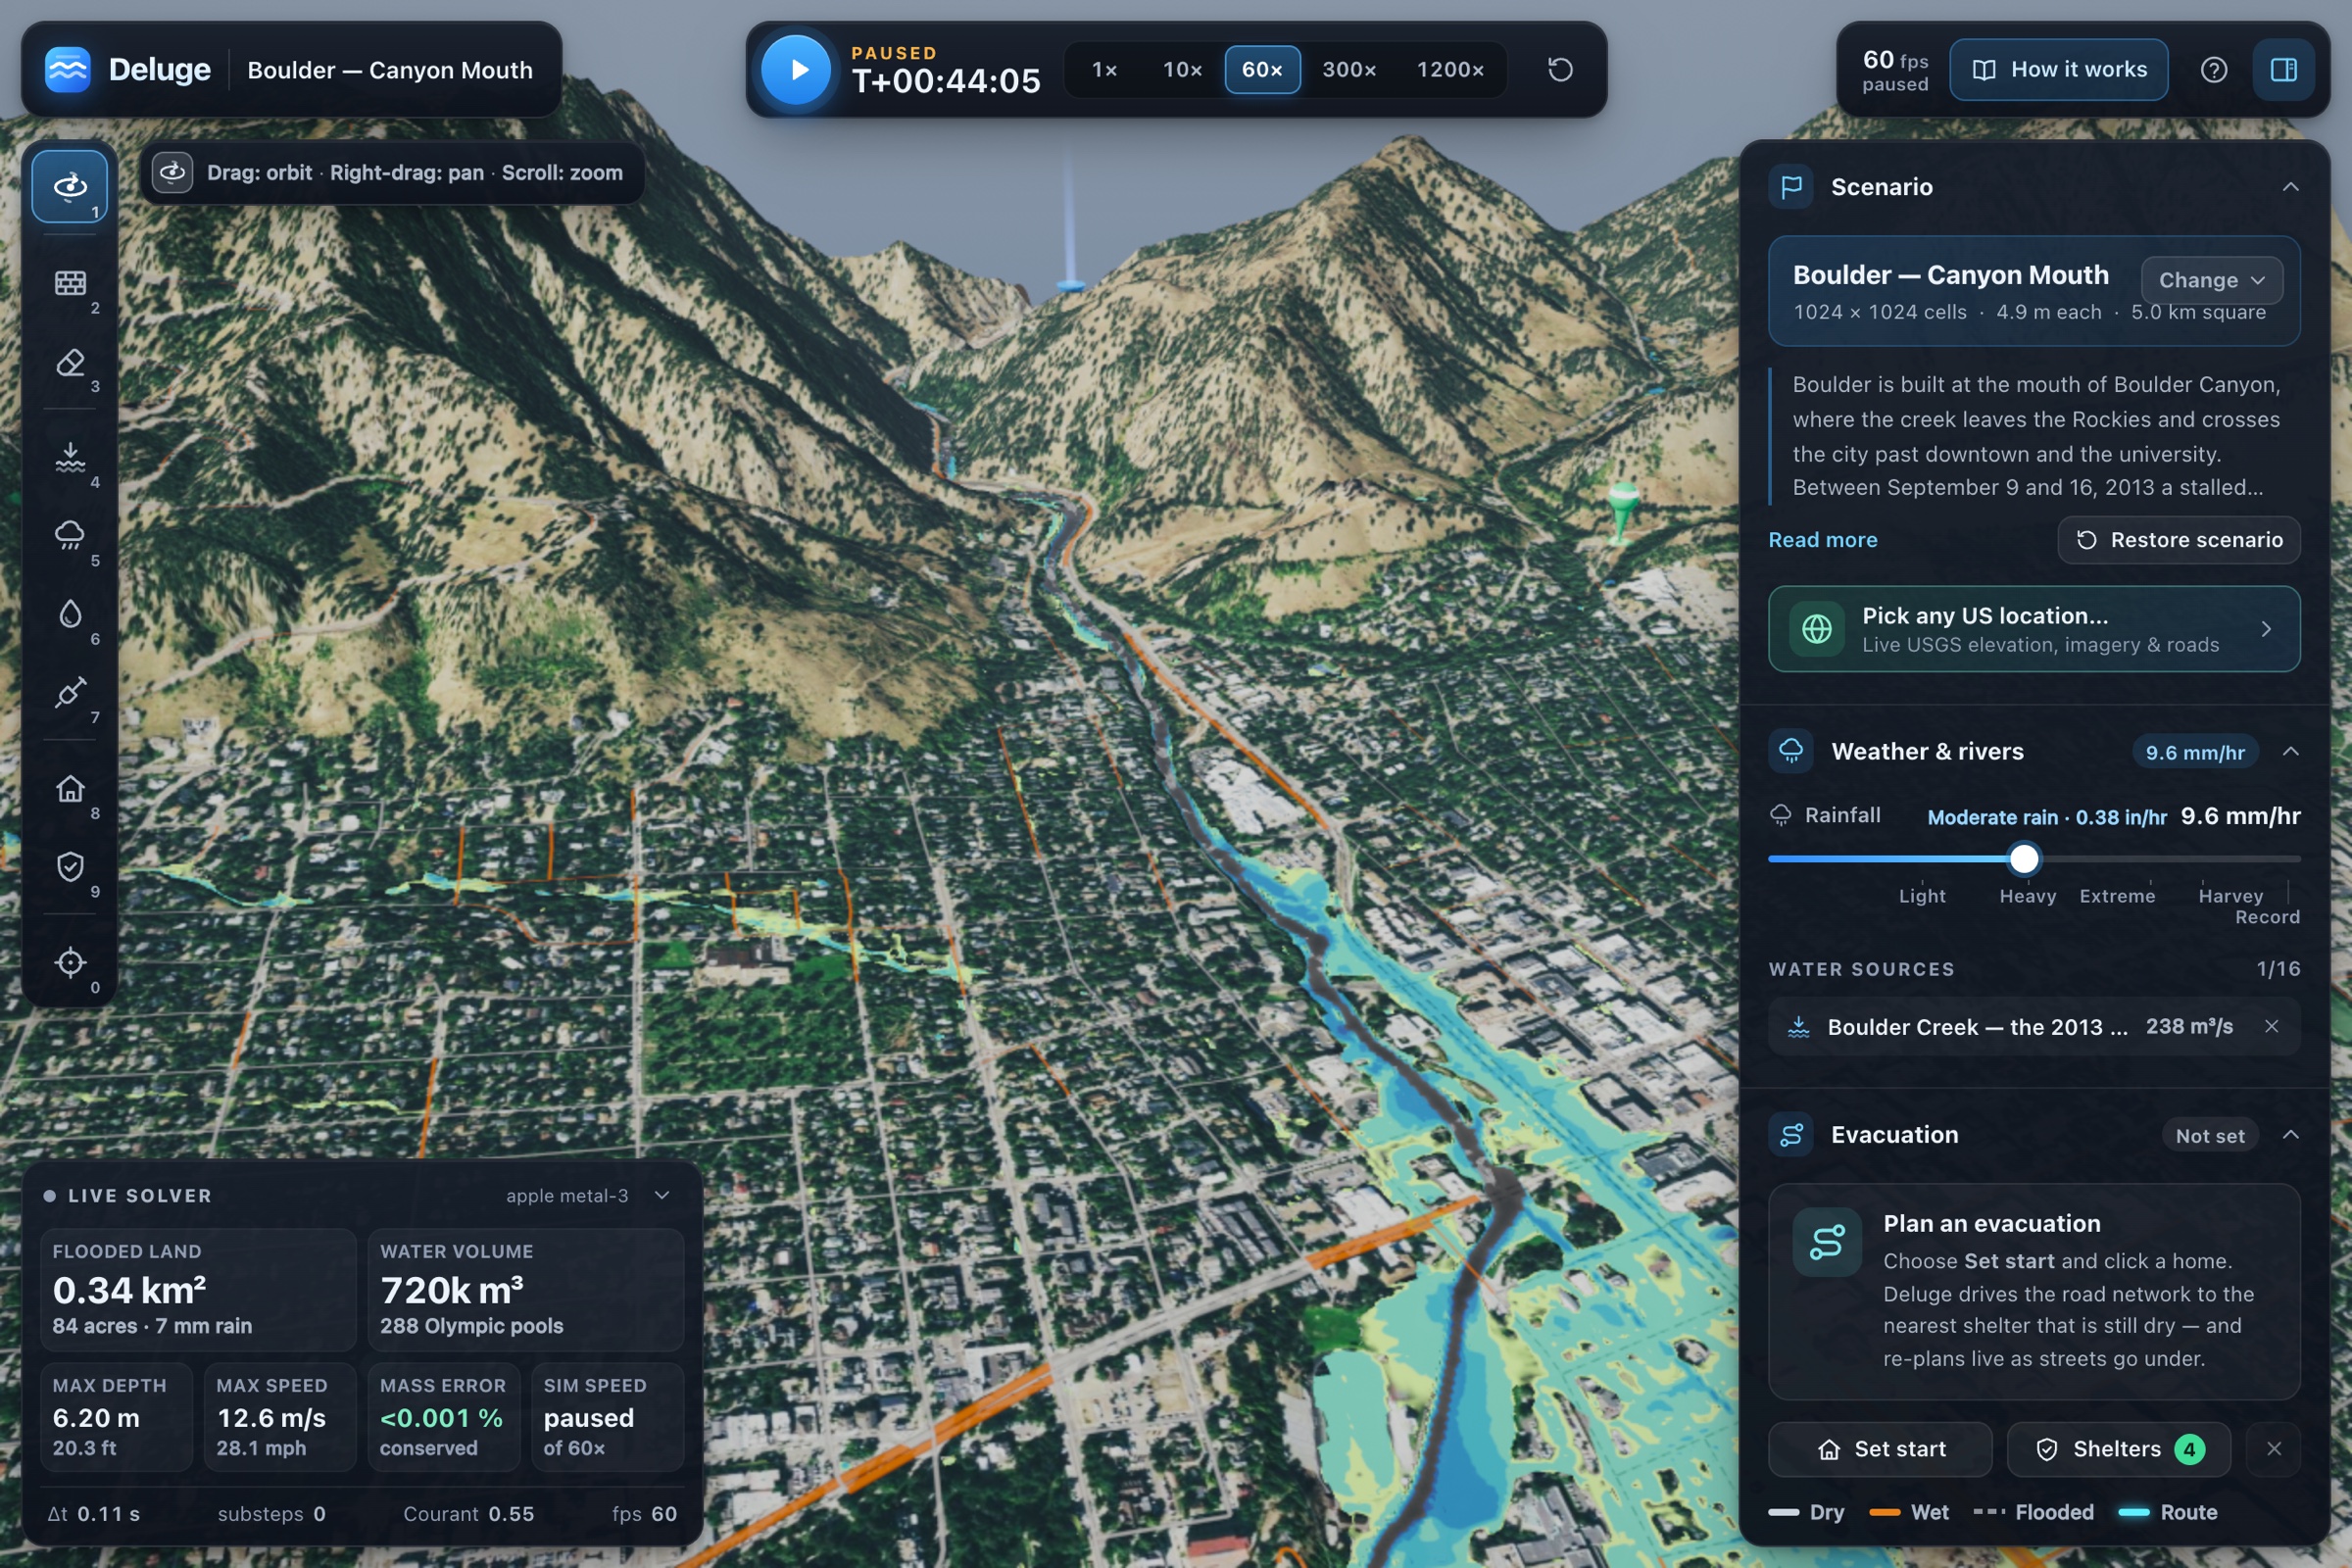
2013 Boulder Canyon flash flood: 238 m³/s creek crossing at 12.6 m/s. Momentum-driven, not ponding.

Inspiration
On August 26, 2026, rock and glacier ice broke off Langtang Lirung and fell into the Lhende Khola in Nepal. The flood it set off ran down the Bhote Koshi and the Trishuli, past five hydropower plants, and took out the only road bridge into Rasuwa at Betrawati. The first SMS alerts went out at 09:15; the Betrawati gauge went silent at 09:20. The places upstream got no warning at all.
Flood models that could have answered "where will the water go, and when?" exist, but they need specialist software, a trained engineer and hours of setup for each question. We wanted to see how far we could get with something anyone could open in a browser: real terrain, real physics, and an answer in seconds — and then turn that answer into the decisions people actually face: where to evacuate, whether a wall is worth building, whether a site is safe to build on, and how many minutes of warning a sensor upstream would buy.
What it does
Deluge is a real-time flood simulator that runs on your GPU, in a browser tab. It loads real elevation, aerial imagery and streets, solves the 2-D shallow-water equations live, and lets you change the world and watch the flood answer.
Simulate
- Raise rivers to historic crests, crank the rain, drop storm cells, pour water, dig channels — the flood re-solves as you go.
- Draw a levee and see the land it keeps dry: Pittsburgh's one-click North Shore floodwall keeps about 139 acres and 11 km of streets dry at the 1936 crest.
- Evacuate: a route to the nearest dry shelter over the real road network, re-planned as roads flood (a road under 30 cm of water is impassable).
- Ten scenarios work completely offline — Pittsburgh 1936, Johnstown 1889, Ellicott City 2016, Asheville (Helene), Nashville 2010, Houston (Harvey), Boulder 2013, Fort Myers (Ian), and three Himalayan glacier floods (Nepal 2026, Sikkim 2023, Chamoli 2021) — plus any US location loaded live from USGS.
Decide
- Impact & loss — damage and dollar loss per building, hazard classes, arrival times, and which buildings lose their access road.
- Site check — due diligence for one parcel: depth at the planned floor, when the last road out closes, how many occupants get out on foot and by car, an indicative floor height, mitigation options with benefit–cost ratios, and expected annual loss. For any US address it sweeps NOAA Atlas 14 rain return periods.
- Uncertainty — a GPU ensemble of perturbed runs turns "this street floods" into "this street floods in 9 of 12 plausible versions of this event."
- Dam breaches — any of 55,276 dams in the National Inventory of Dams, breached with eight published breach relations shown as a low / central / high band.
- Coastal surge — any US coastal site against NOAA's 1- to 100-year tide-gauge water levels.
- Glacier hazards — lake outbursts and rock-ice avalanches routed tens of kilometres down a valley, with an early-warning designer that shows how many minutes a sensor would buy each town and power plant.
- Future climate — 2050 / 2080 / 2100 rain, sea level and glacial-lake growth under SSP2-4.5 or SSP5-8.5.
- Compare designs — two or three mitigation designs side by side: avoided loss, cost, benefit–cost ratio with its range, and who gets wetter.
Use it anywhere — saved projects and share links, narrated stories that walk through a decision, a headless CLI and HTTP API that write GeoTIFFs and CSVs, and a locked-down macOS desktop app for presenting offline.
How we built it
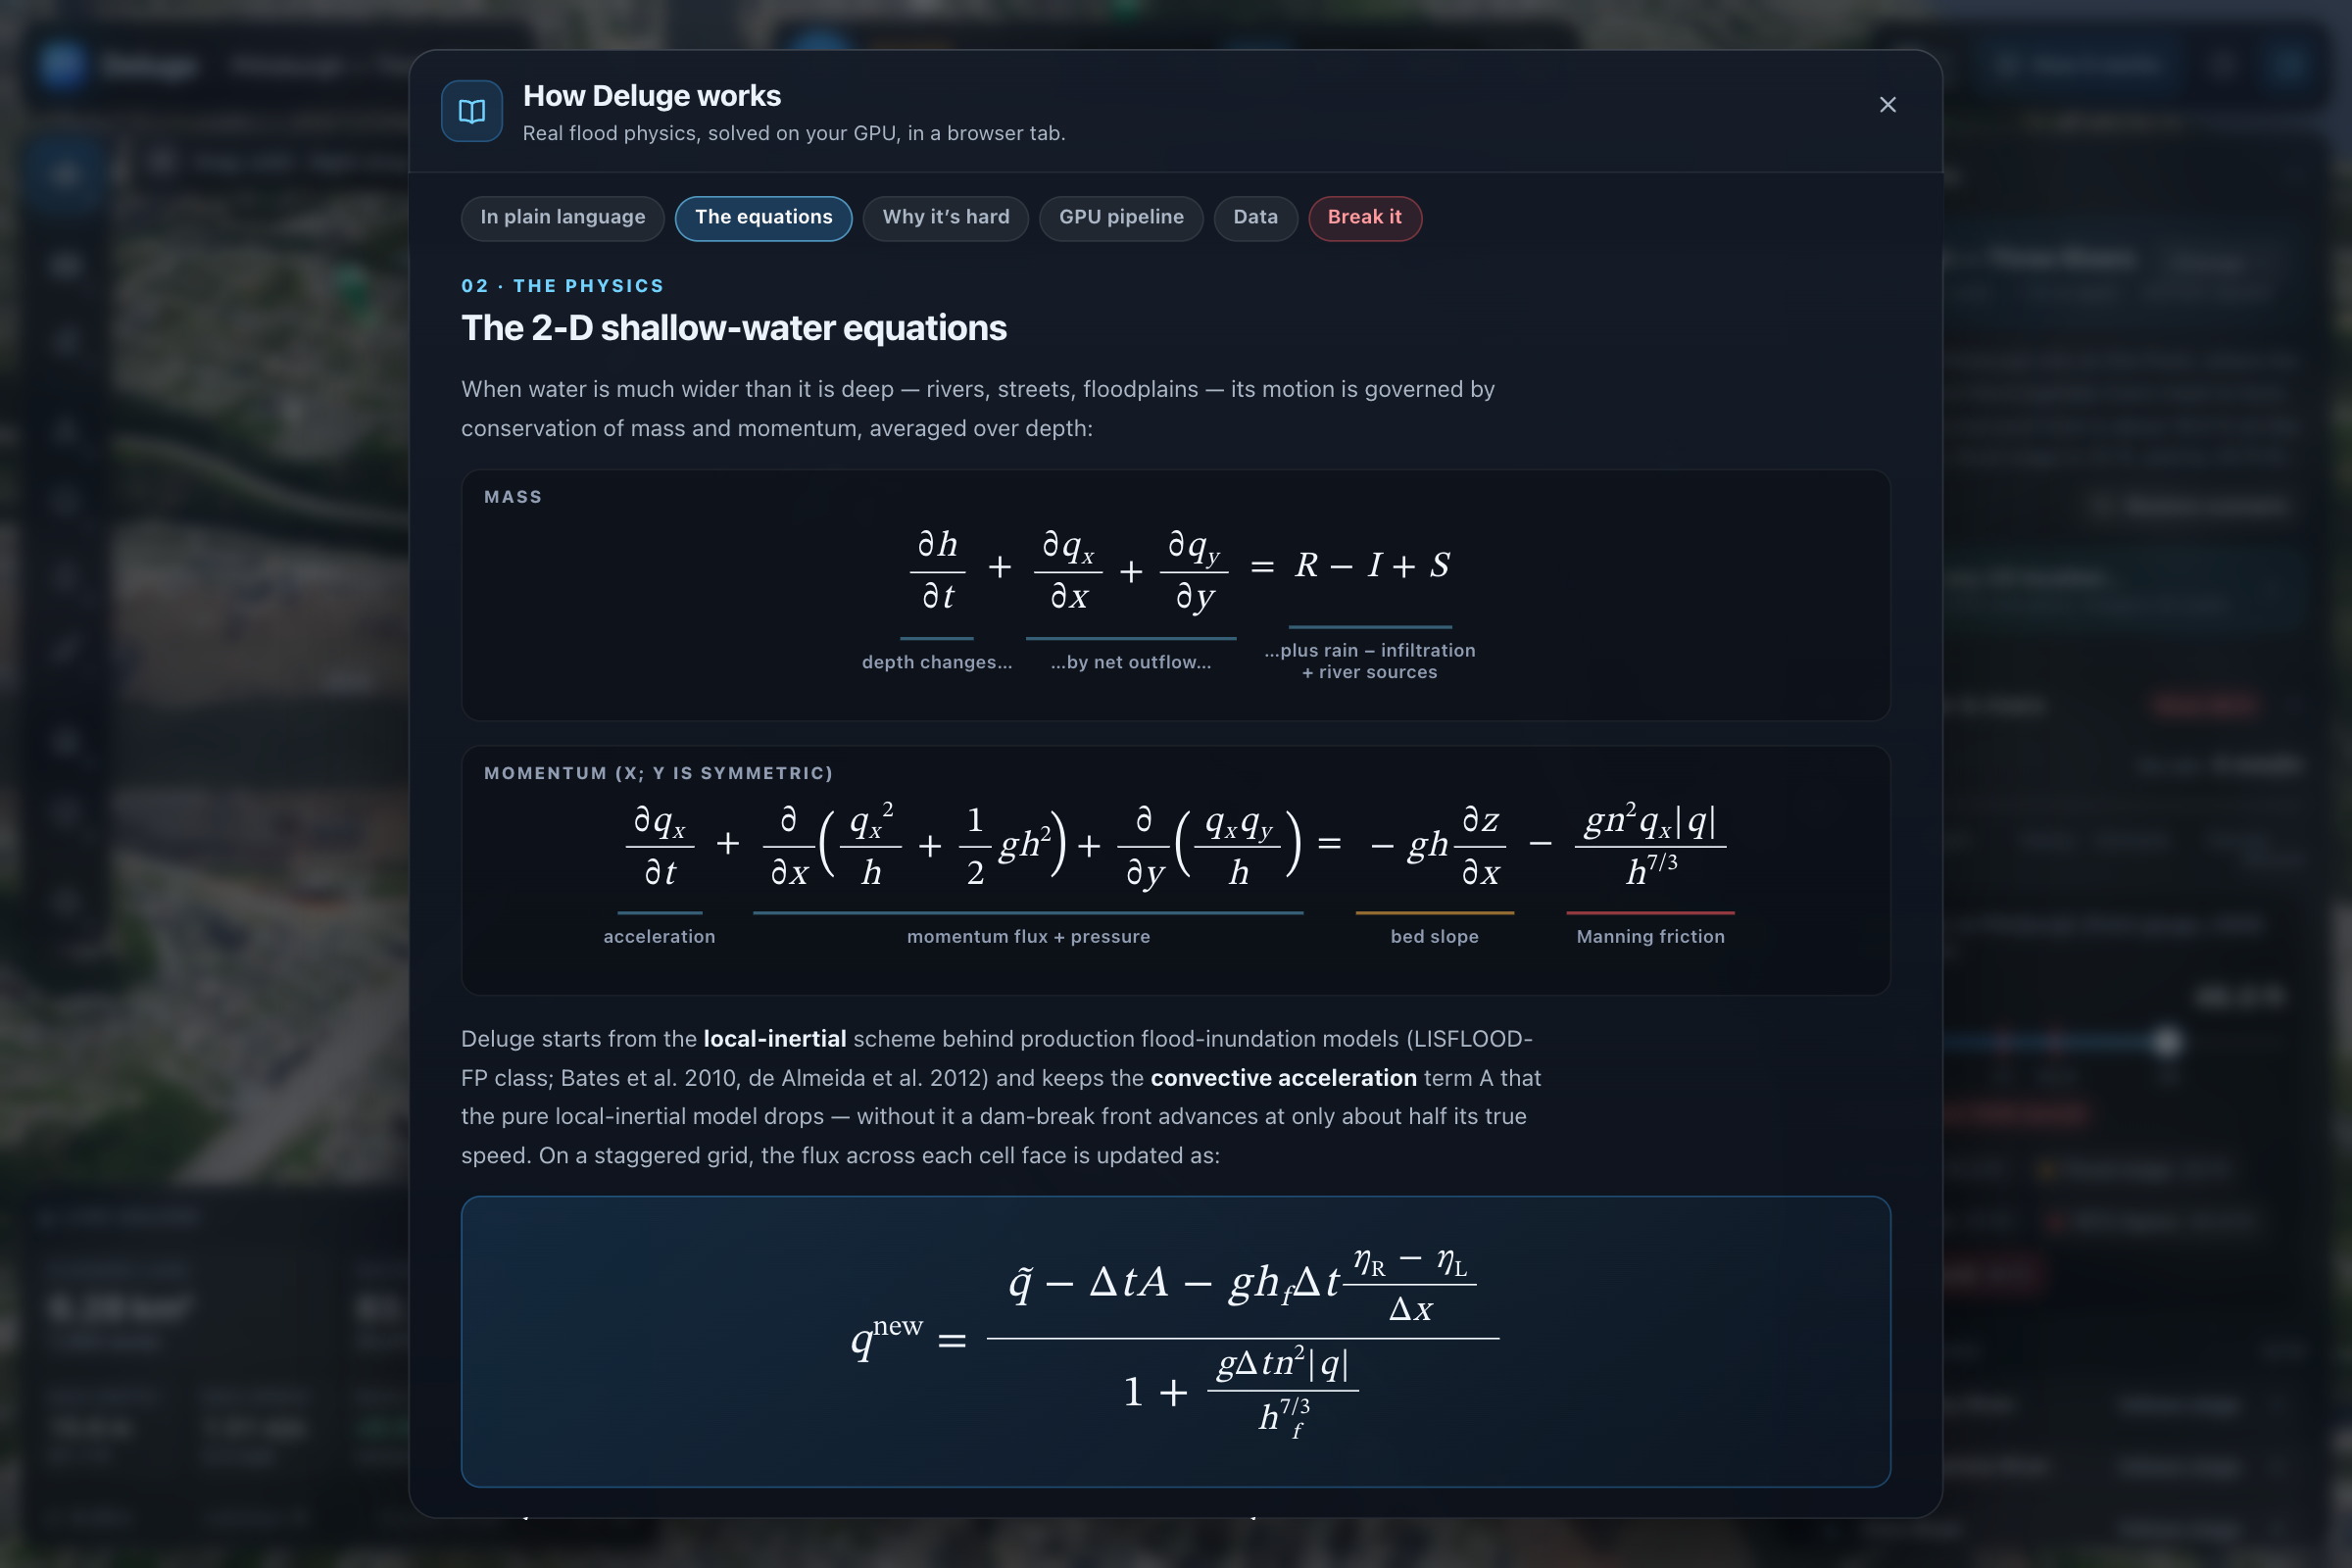
The flood is the 2-D shallow-water equations — conservation of mass and momentum, averaged over depth:
$$ \frac{\partial h}{\partial t} + \frac{\partial q_x}{\partial x} + \frac{\partial q_y}{\partial y} = R - I + S $$
$$ \frac{\partial q_x}{\partial t} + \frac{\partial}{\partial x}\left(\frac{q_x^2}{h}\right) + \frac{\partial}{\partial y}\left(\frac{q_x q_y}{h}\right) = - g h \frac{\partial \eta}{\partial x} - \frac{g n^2 q_x |\mathbf{q}|}{h^{7/3}} $$
where h is water depth, q the flow per unit width, η = z + h the water surface, n Manning's roughness, R rain, I infiltration and S river inflows. We solve them with a local-inertial scheme (the family behind production flood models like LISFLOOD-FP) extended with upwind advection, on a staggered 1024 × 1024 grid of 7.8 m cells. Each face's flow is updated semi-implicitly:
$$ q^{\text{new}} = \frac{\tilde q - \Delta t A - g h_f \Delta t \frac{\partial \eta}{\partial x}}{1 + \frac{g \Delta t n^2 |q|}{h_f^{7/3}}} $$
Everything runs in WebGPU compute shaders (WGSL): all of a frame's solver substeps go into one compute pass, and statistics come back asynchronously so the GPU never waits on the CPU. Four ingredients keep an explicit solver stable on real terrain:
- A CFL-adaptive time step with the 2-D Courant number, Δt = Cr · Δx / (√2 · max(√(gh) + |u|)), so a wave never jumps more than one cell.
- Semi-implicit friction — dividing instead of subtracting, so friction on thin films can only slow water down.
- A positivity-preserving flux limiter — a cell can never give away more water than it holds, so depth stays ≥ 0 without clamping.
- Well-balanced face depths — a lake at rest on steep, rough terrain stays at rest.
A per-cell ledger books every change to the water, down to the GPU's own Float32 rounding, so the mass-balance error on screen stays around 10⁻⁷.
On top of the solver: elevation from USGS 3DEP (and Copernicus GLO-30 abroad), NAIP aerial imagery, Census TIGER roads turned into a routing graph, OpenStreetMap buildings and critical facilities, and baked copies of NOAA Atlas 14, the National Inventory of Dams and NOAA's tide-gauge statistics. Damage comes from the JRC global depth–damage curves; ensembles use Latin-hypercube sampling with the terrain itself perturbed; glacier floods are routed by a 1-D model and then run on the map with debris-flow rheology. The same TypeScript runs headless on the GPU through Dawn for the CLI and API — bit-identical when repeated. There is no backend: the app is static files with a strict Content-Security-Policy that allows exactly seven public data endpoints.
Challenges we ran into
- Rivers with no bottom. US elevation data is hydro-flattened — a river is stored at its water surface — so we had to burn channels in from river centrelines before water could flow through them.
- Rivers running backwards. At Pittsburgh's 1936 crest, with every boundary at one level, floodplain drainage pulled all three rivers backwards (the Ohio ran into downtown at ~2,500 m³/s), and momentum coasting across a boundary came out as an 8 m/s jet. A small head across the confluence, and boundaries that forget their momentum, fixed it.
- A slider is a dam break. Jumping a river 9 m at once sends bores along every bank, so the stage now rises at a bounded rate in simulated time while water is lifted in place along the channels.
- Repeatability. A run asked for 600 s used to stop anywhere between 614 and 706 s, and one parcel's damage flipped between 15 % and 100 % from sweep to sweep. Exact-stop stepping and hazard maxima sampled on simulated time brought it to 79–81 % across fourteen sweeps.
- A fanless laptop. A MacBook Air throttles under sustained GPU load, so an adaptive work budget trades simulated speed for a steady 60 fps.
- No reliable network. Venue wifi tends to hang rather than fail, so every scenario ships offline and live loads give up fast and honestly. Some services (NOAA's rainfall server, the dam inventory) can't be called from a web page at all, so we baked their data into the app.
- Being honest with the numbers. Optional building, roughness and storm-drain layers are more physical — but none of them improved every score against real floods, so they ship off by default.
Accomplishments that we're proud of
- Converged on its own grid. Against a 4096 × 4096 run of the same solver (16× the cells), the demo grid's 1936 flood is within 0.92 % in flooded area and 98.0 % in extent overlap, with a 6 cm median depth difference.
- Checked against analytic answers. A lake at rest stays still to 9.3 × 10⁻⁵ m/s, a dam break matches the Ritter solution within 1.6 %, and the GPU agrees with a Float64 CPU reference to 4.3 × 10⁻⁵ m.
- Checked against real floods. Hurricane Ian at Fort Myers: 25 USGS high-water-mark sites, RMSE 0.14 m, all within ±0.3 m. FEMA's 1 % flood zone at FEMA's own 1 % level: CSI 88 % (Fort Myers), 82 % (Nashville), 61 % (Pittsburgh). Against Nashville's May 2010 damage survey it reaches 98 % of the damaged buildings the river could reach. At the Pittsburgh Point gauge the water surface stays within 3 cm of the reading at every stage, and the National Weather Service's impact statements line up within a few feet.
- Dam breaches scored on history. The central breach relation reproduces all 21 documented failures in the USBR compilation within a factor of two.
- Fast. 60 fps and about 70× real time on an Apple M4 at the 1936 crest with extreme rain; every built-in city cold-loads in under 0.75 s offline.
- Tested. 1,043 unit tests, 31 end-to-end flows on a real GPU, and dedicated suites for frame rate, graphics glitches, security (our own penetration test, automated) and the desktop build.
What we learned
- Stability is a design problem, not a bug hunt. Every safeguard we kept can be switched off in a test mode, and the tests require the unsafe version to blow up — that is how we know each one earns its place.
- The data is as hard as the physics. Elevation, rivers, roads, imagery, buildings, rainfall statistics and tide gauges all come from different agencies, datums and grids; getting them to agree was half the project.
- Report the whole distribution. Our median depth error is 6 cm, but the worst 1 % of flooded cells differ by more than 1.28 m. Asheville runs 1.2–1.4 m low; our Nepal flood arrives 22–32 minutes late. We publish those next to the good numbers, and we refused to tune parameters to hit the observations.
- A number is only useful attached to a decision. "4 m of water" means something to a developer once it becomes "the last road out closes at T+3 minutes" and "a higher floor pays; a wall does not."
- Minutes matter. The Nepal flood showed that warning time is the whole game — which is why the early-warning designer exists.
What's next for Deluge Flood Sim
- Better physics where it counts: a second-order solver for violent dam breaks, measured river bathymetry and culverts instead of burned channels, buildings that leak, and a real storm-drain network.
- Calibrated probabilities: weight ensemble members against observed floods so "9 of 12" becomes a real probability.
- Return periods everywhere: FEMA profiles and USGS StreamStats for river floods on any US address, and NOAA Atlas 15 when it is published.
- Watch mode: ingest live forecasts (NWS, GloFAS), re-run automatically, and tell asset owners their lead time.
- Evacuation with traffic: background traffic on shared roads, real lane counts, and warning spread ahead of departures.
- Coverage and reach: higher-resolution terrain beyond the US, phones and touch, and webhooks and metering on the API for portfolios of thousands of assets.
Built With
- anthropic
- census
- computational-fluid-dynamics
- copernicus
- dijkstra
- electron
- esri
- fema
- geospatial
- geotiff
- github
- gpu-computing
- leaflet.js
- noaa
- node.js
- numerical-analysis
- openstreetmap
- playwright
- shallow-water-equations
- typescript
- usgs
- vercel
- vite
- webgpu
- wgsl

Log in or sign up for Devpost to join the conversation.