-
-
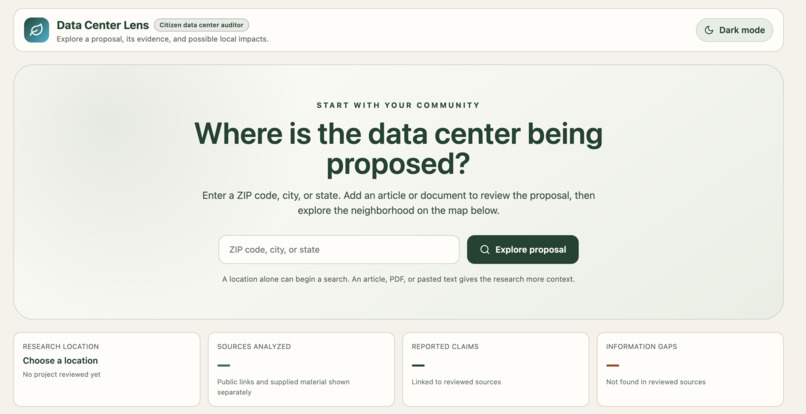
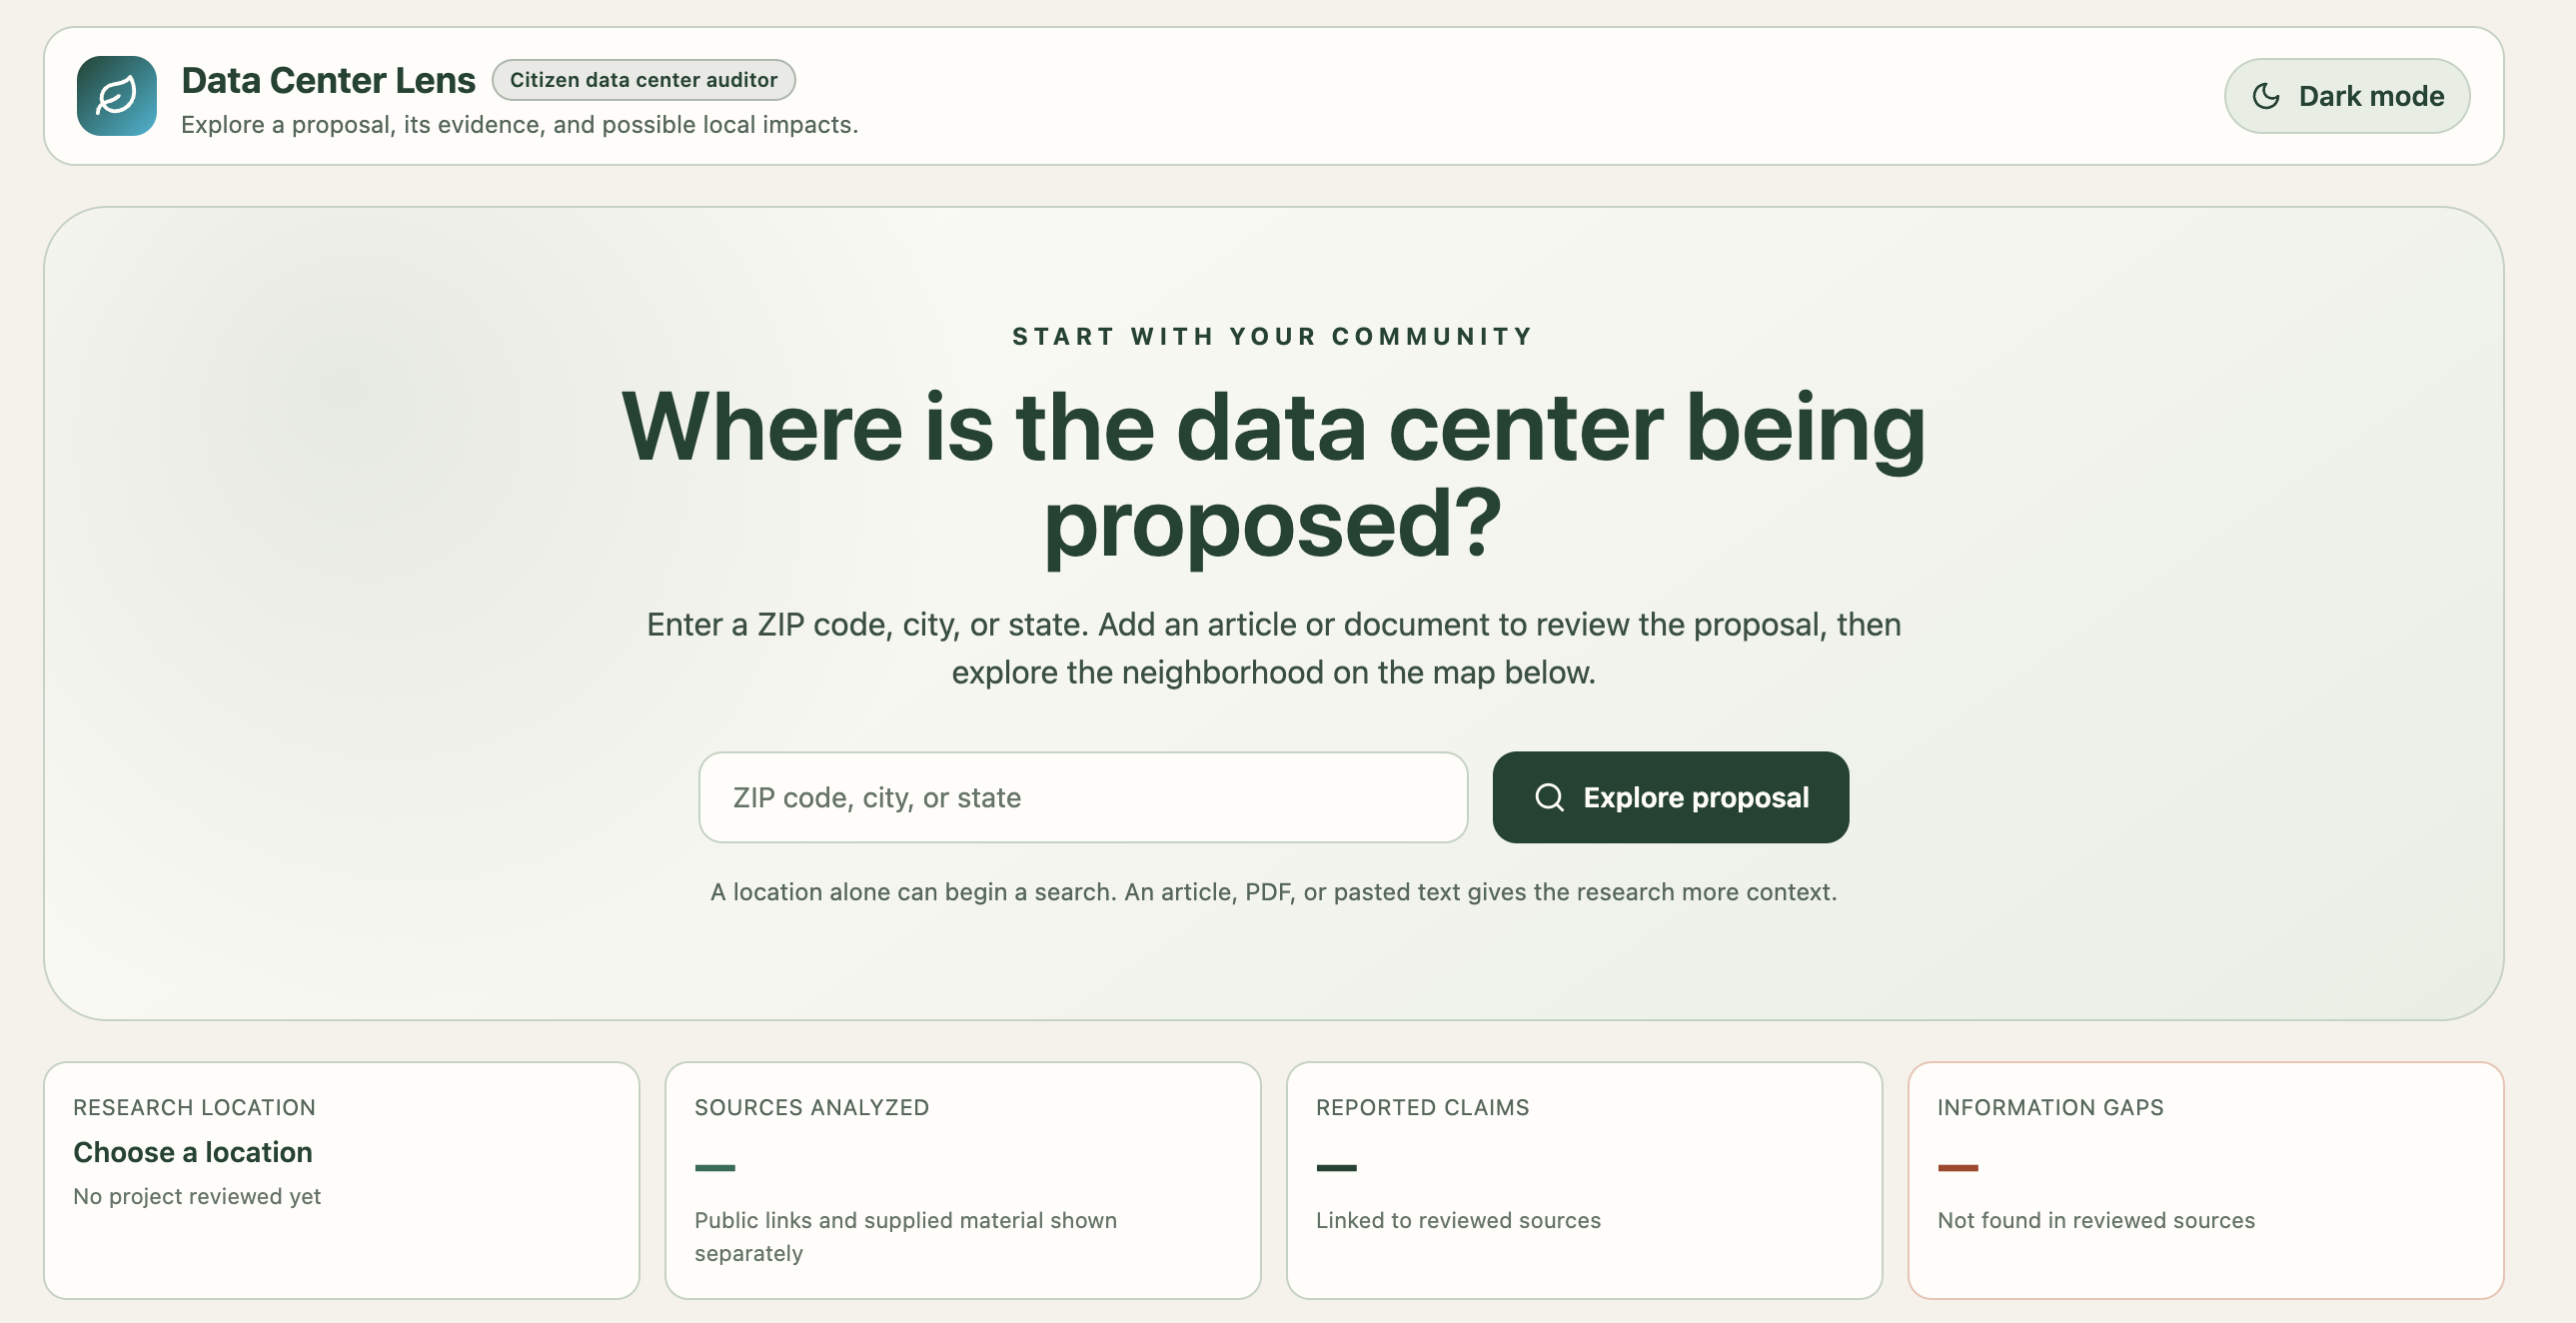
Home Page
-
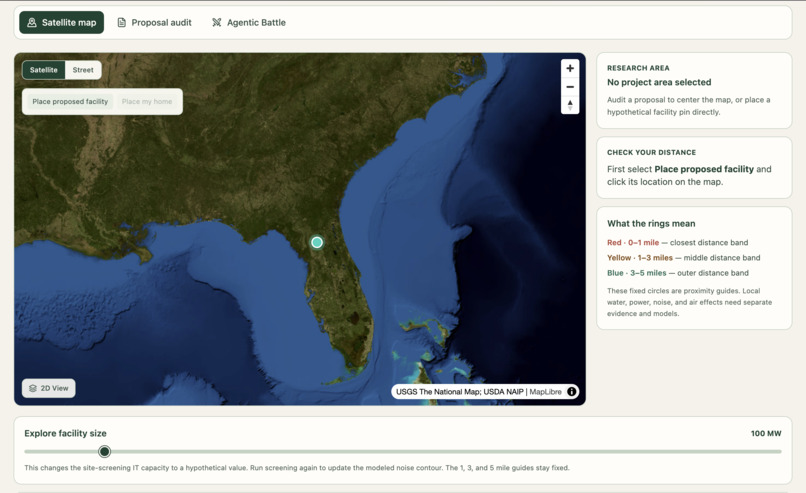
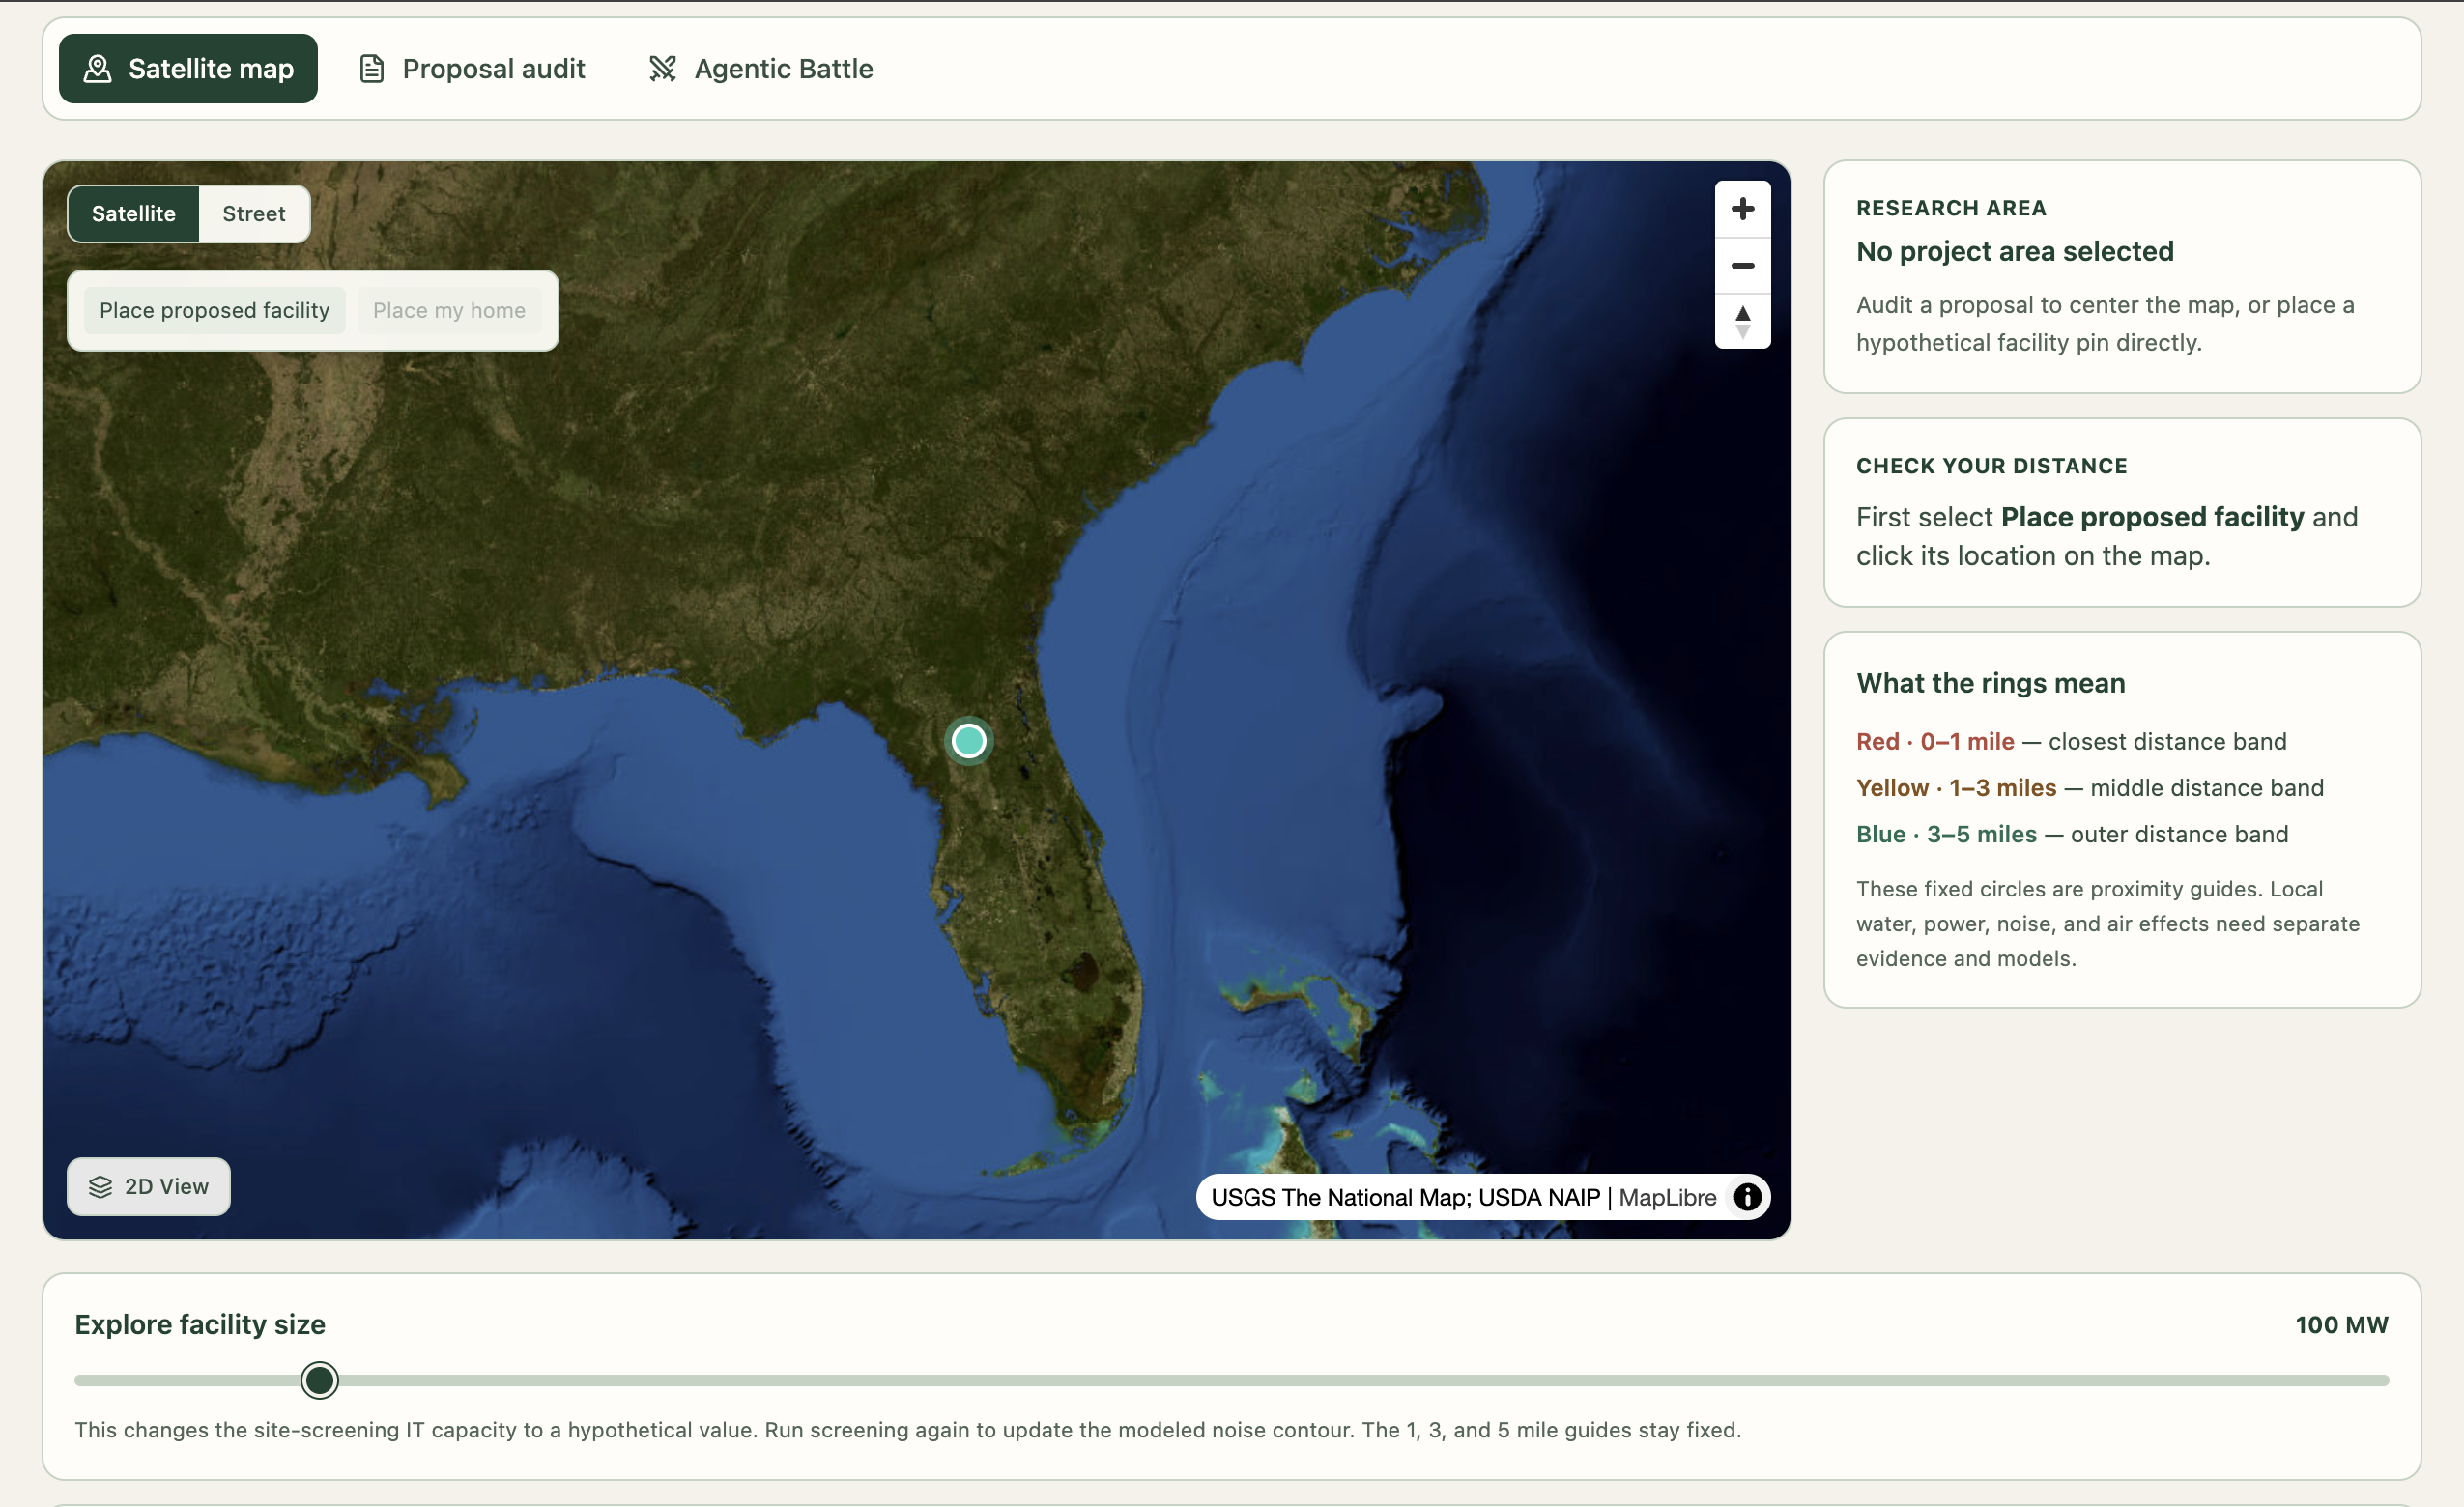
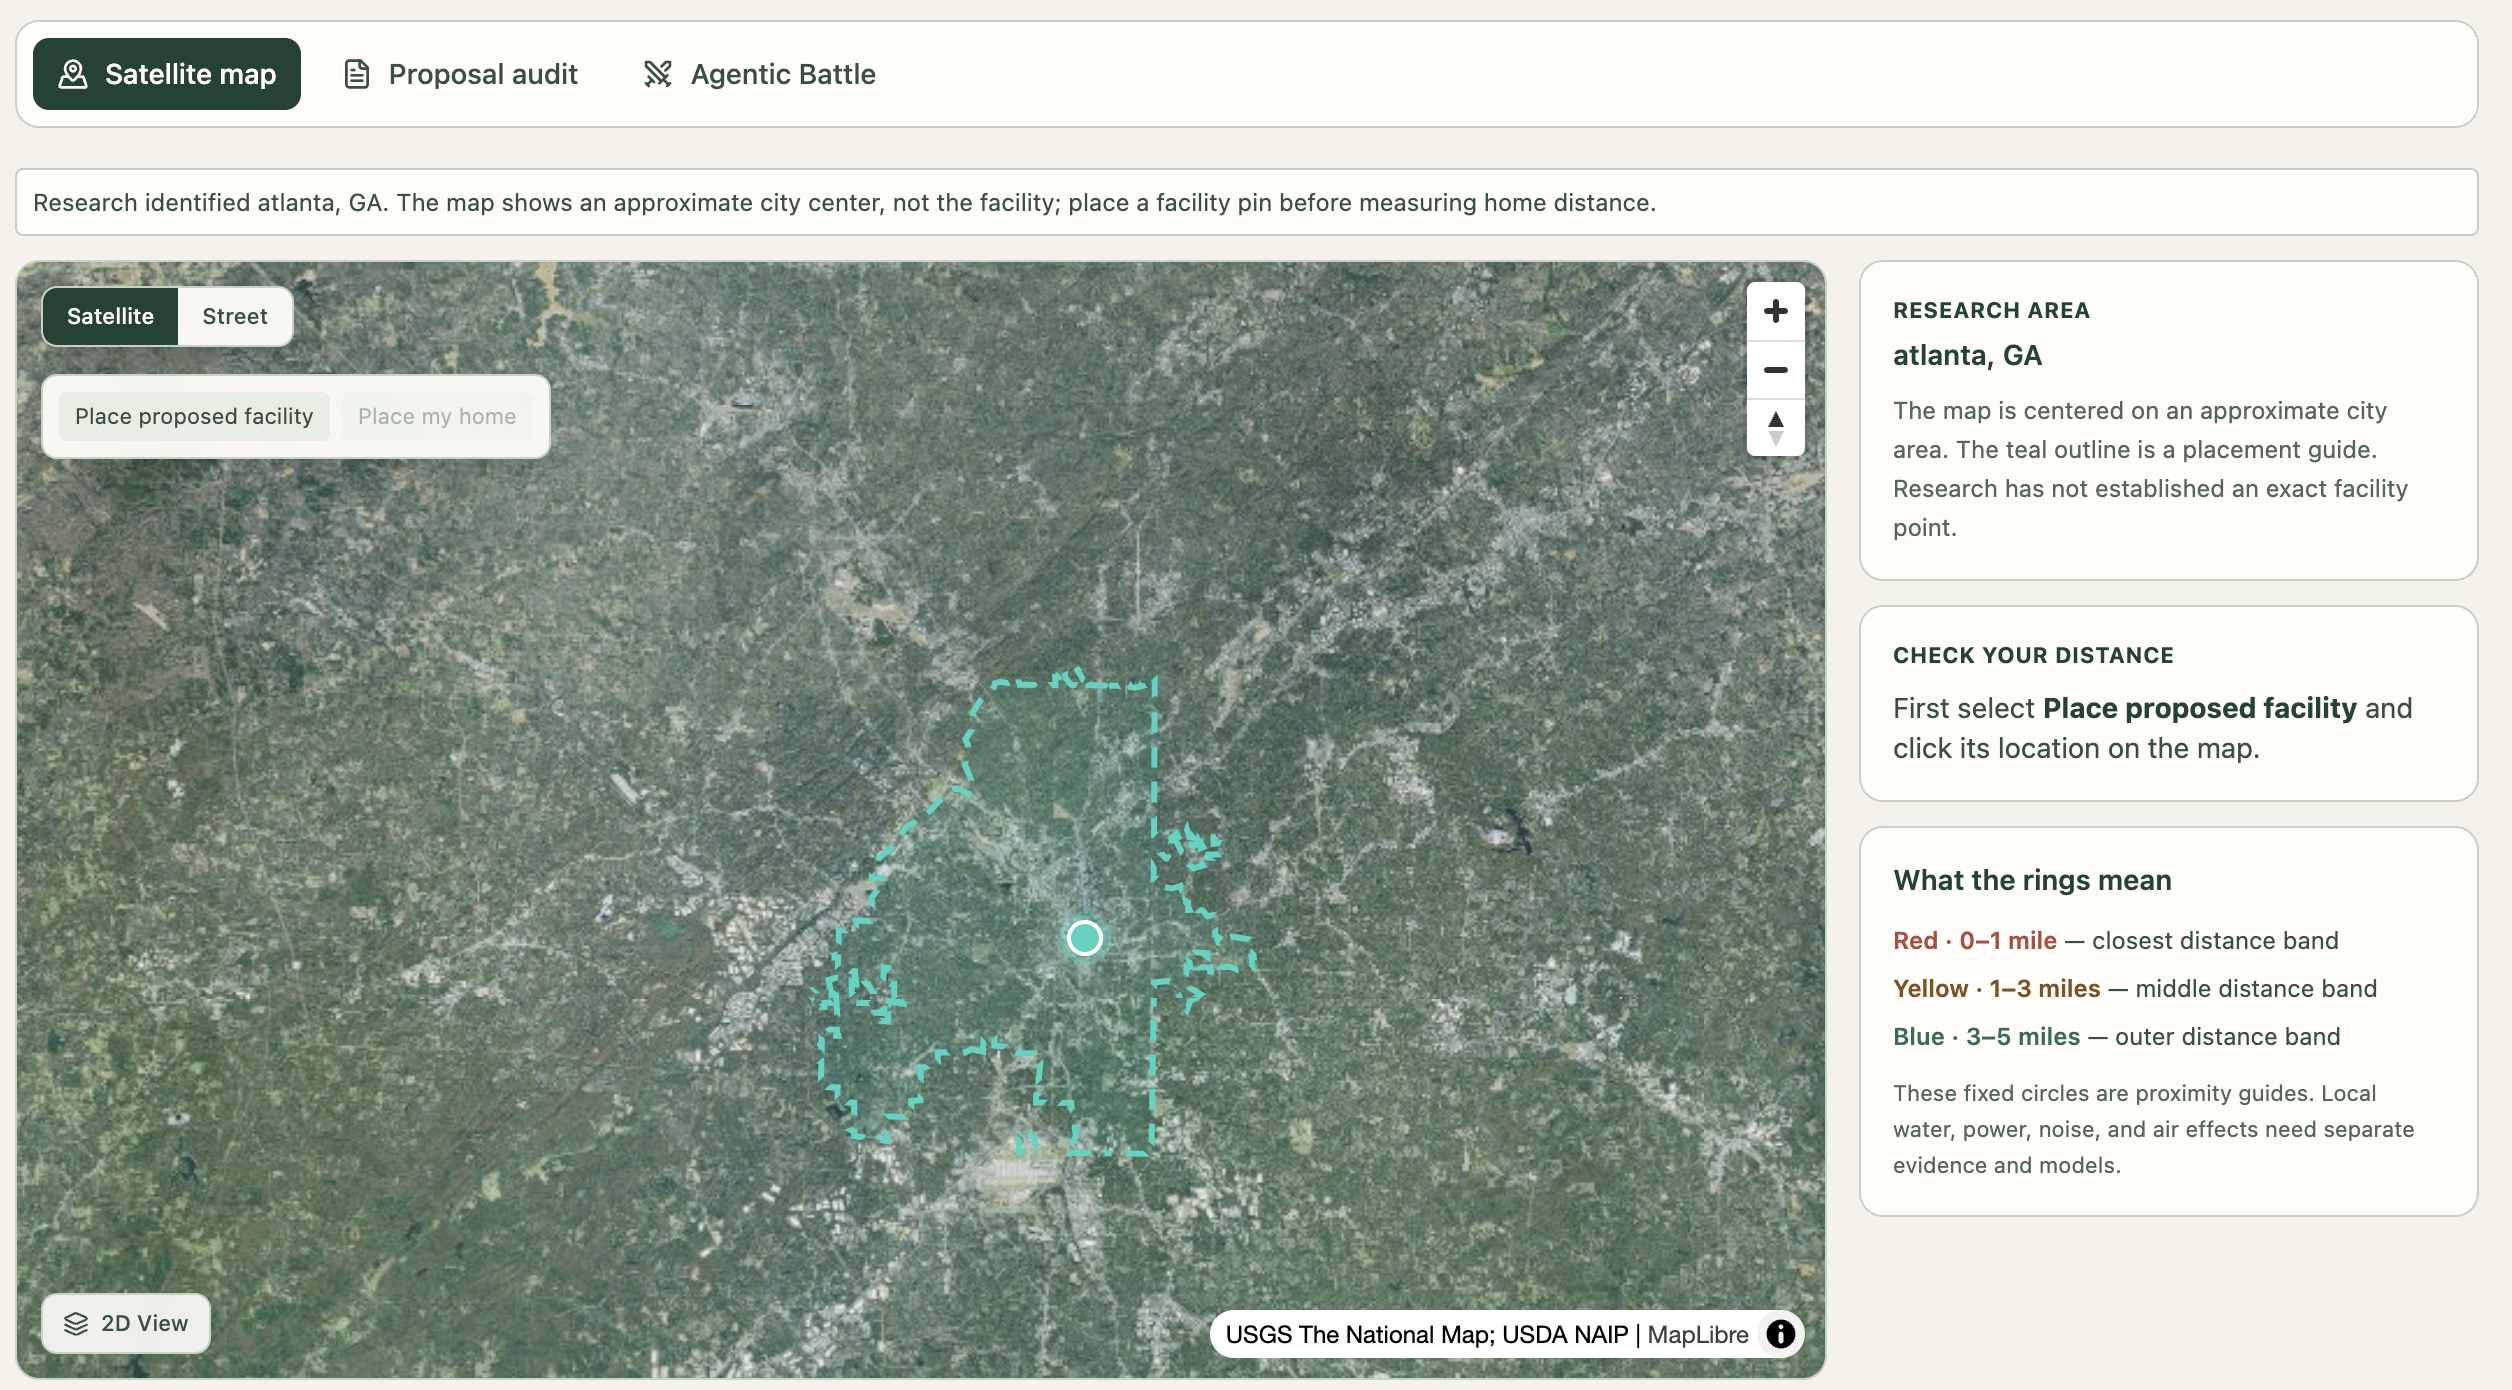
Map view
-
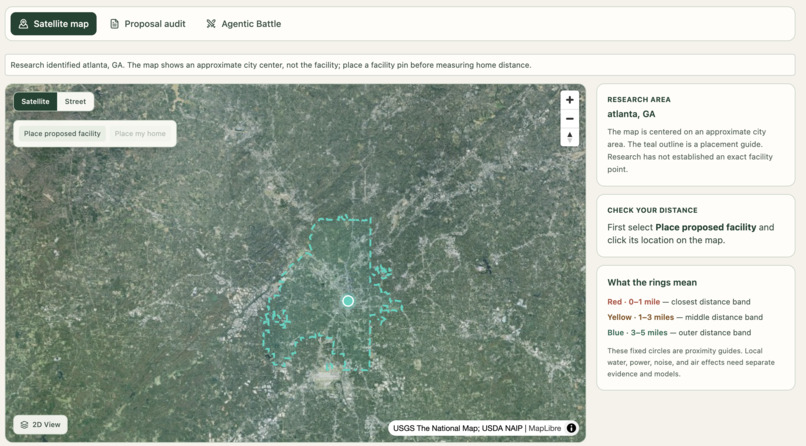
Satellite view of data center location and its state
-
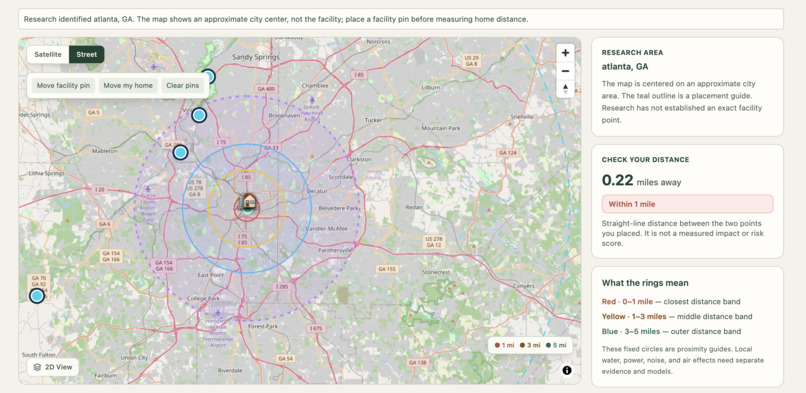
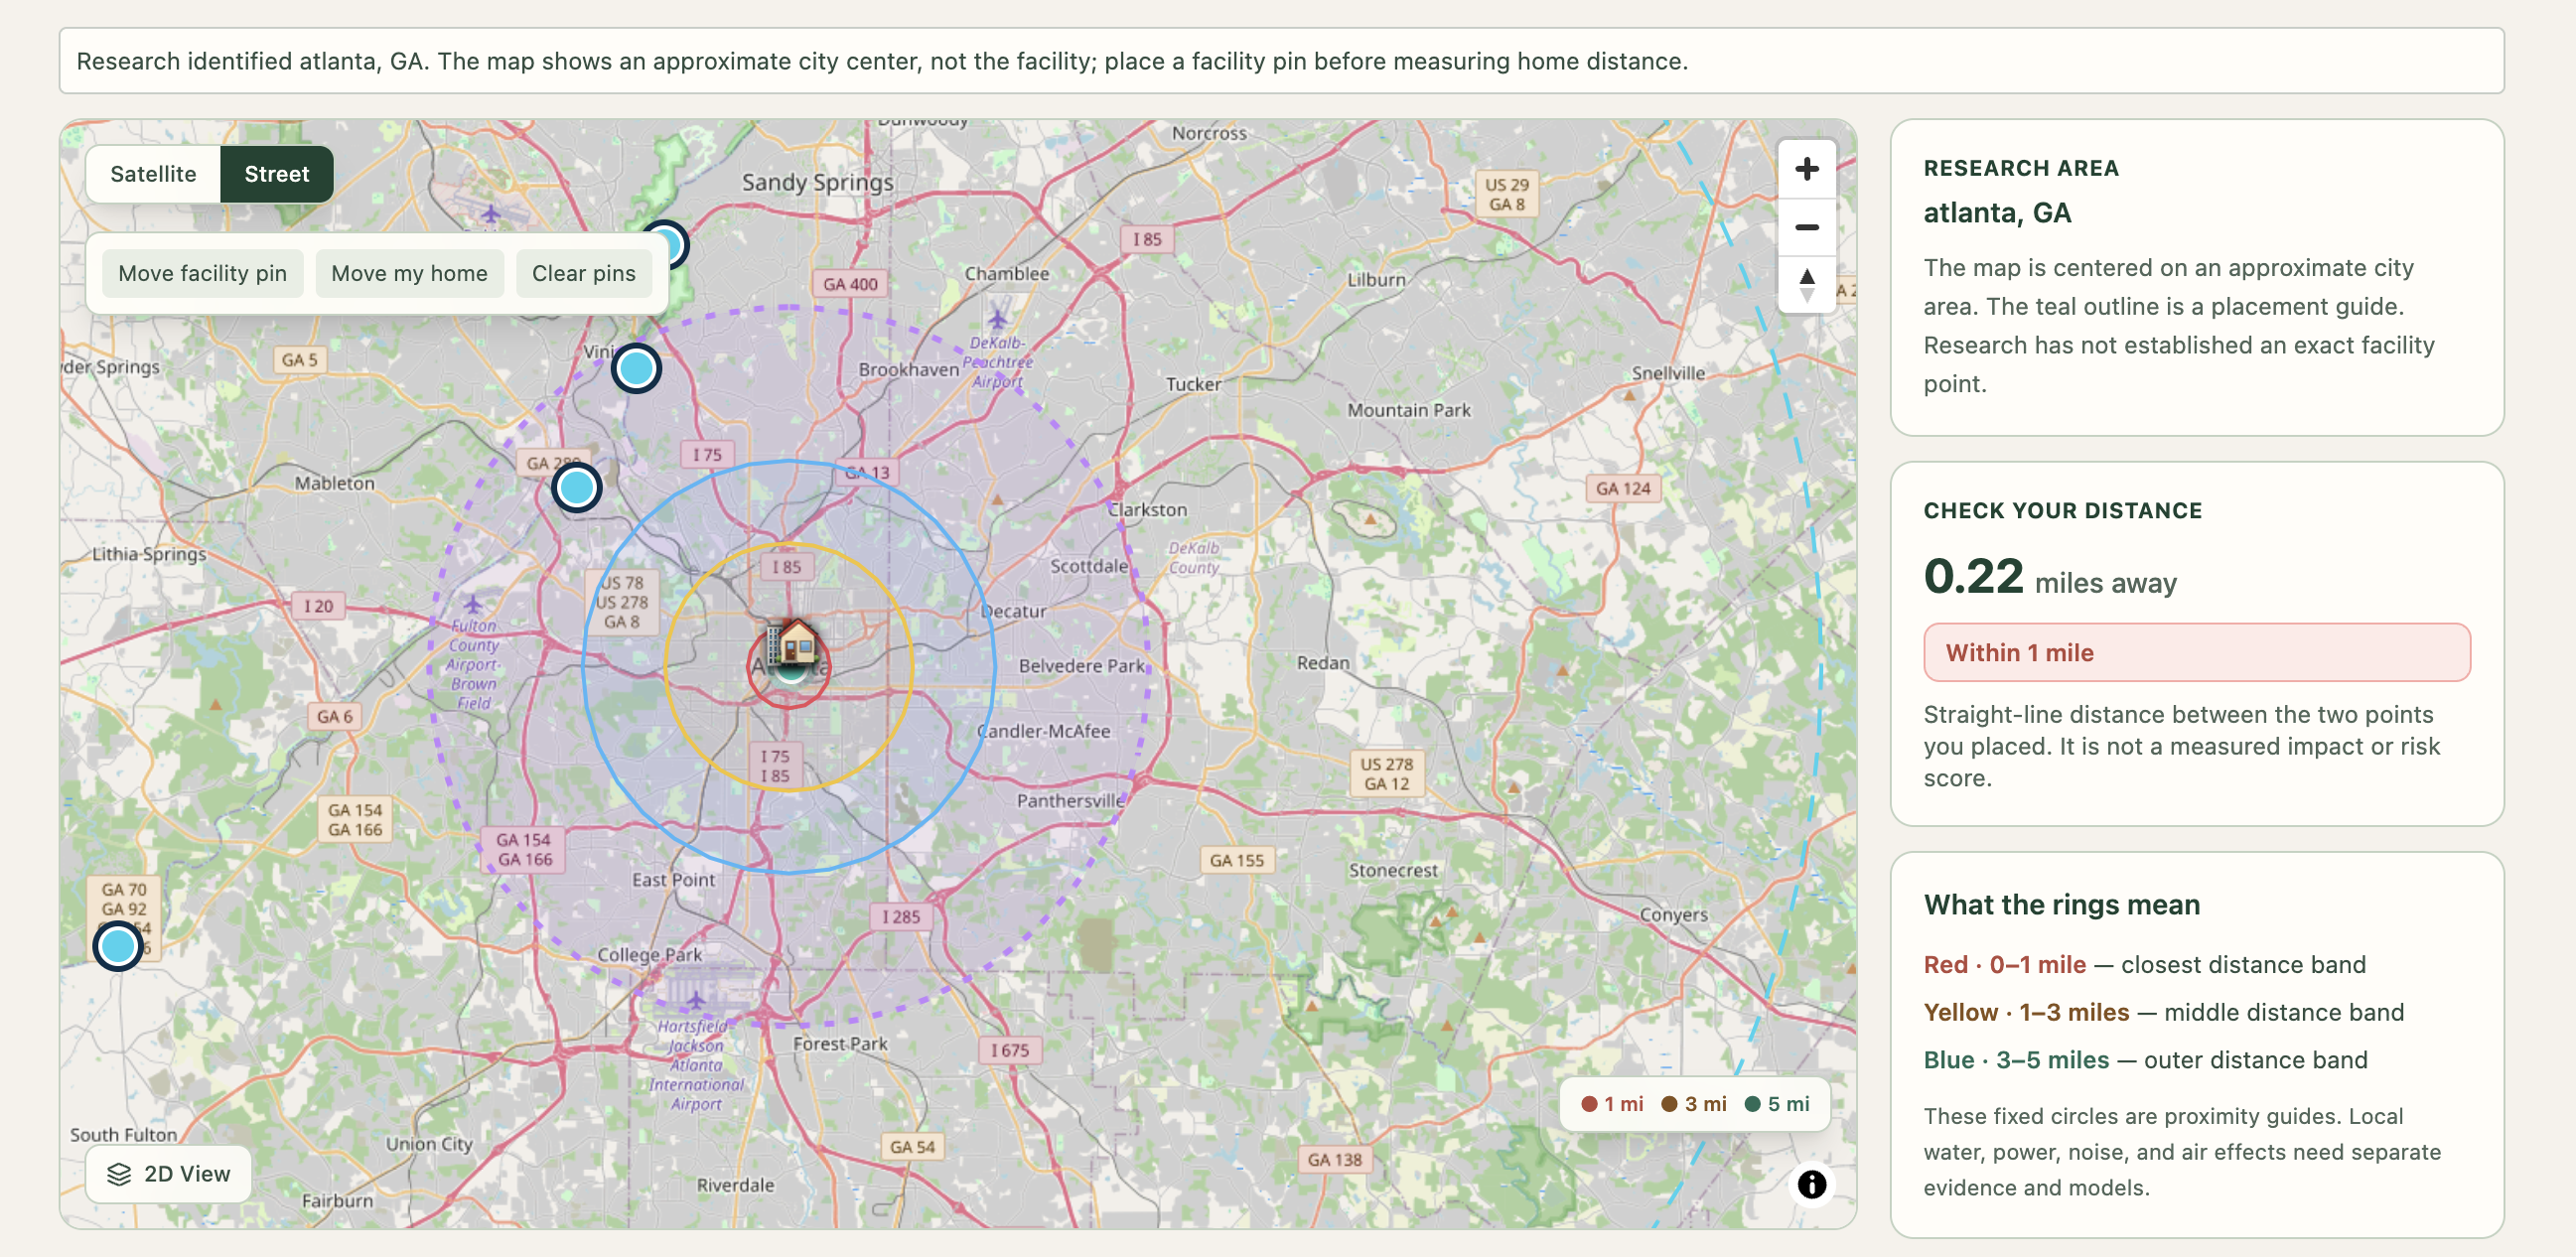
Street view of map to mark data center and home location
-
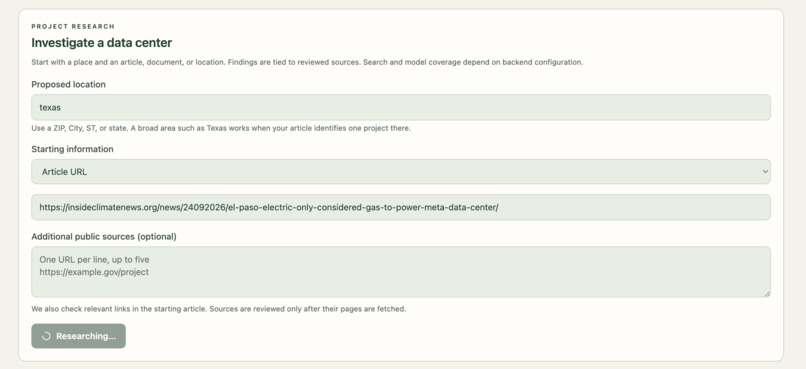
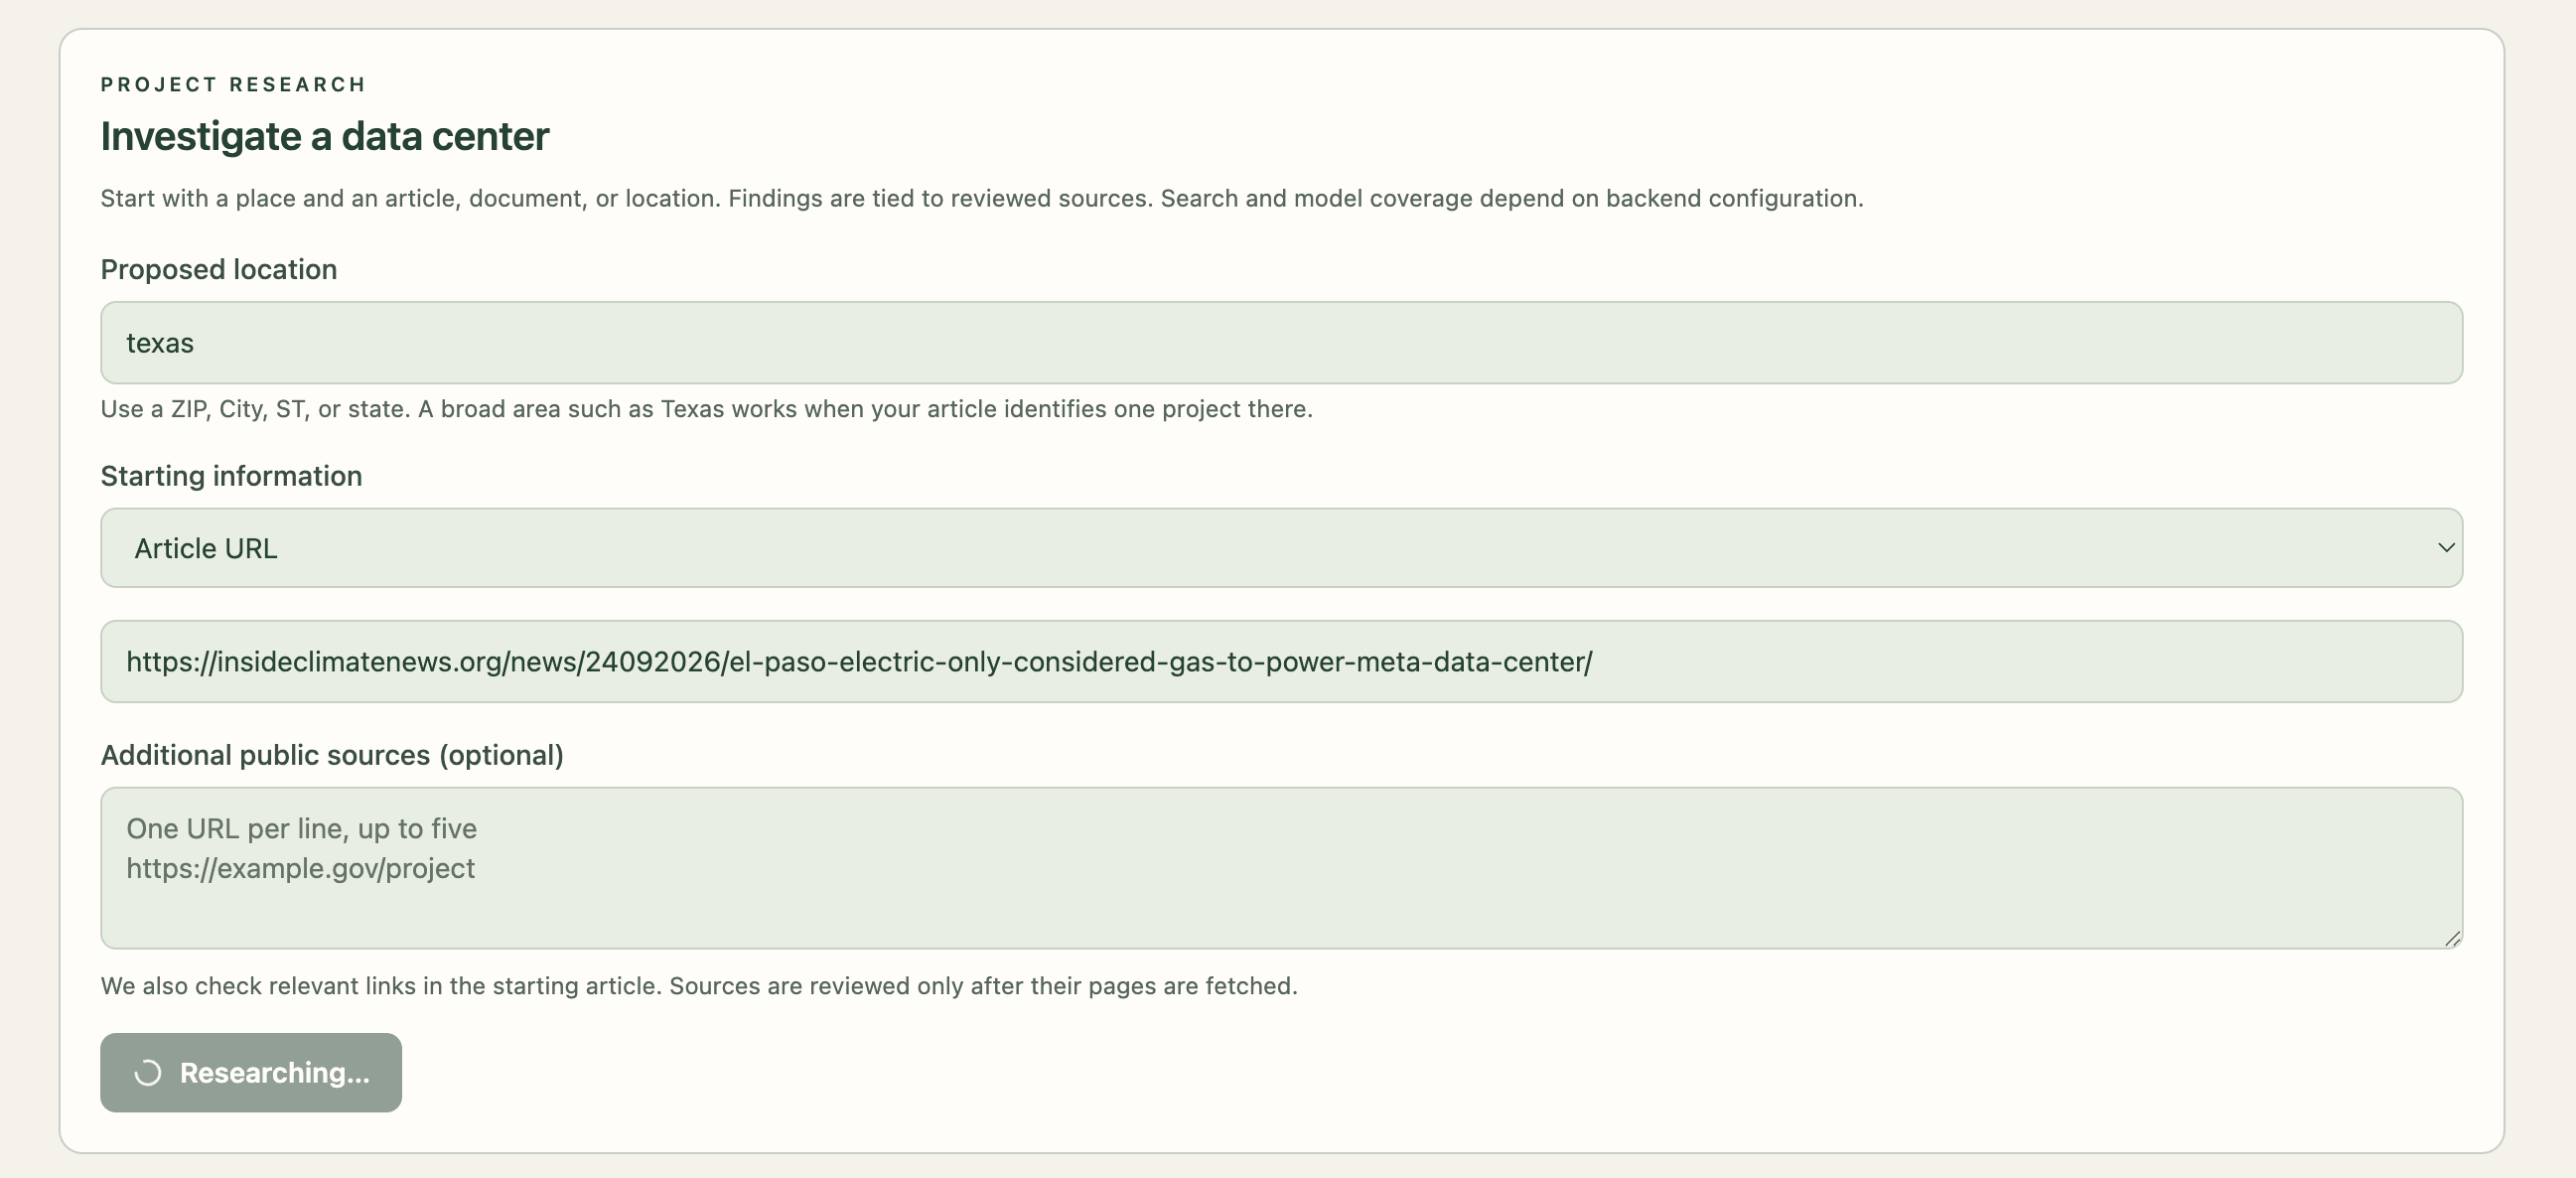
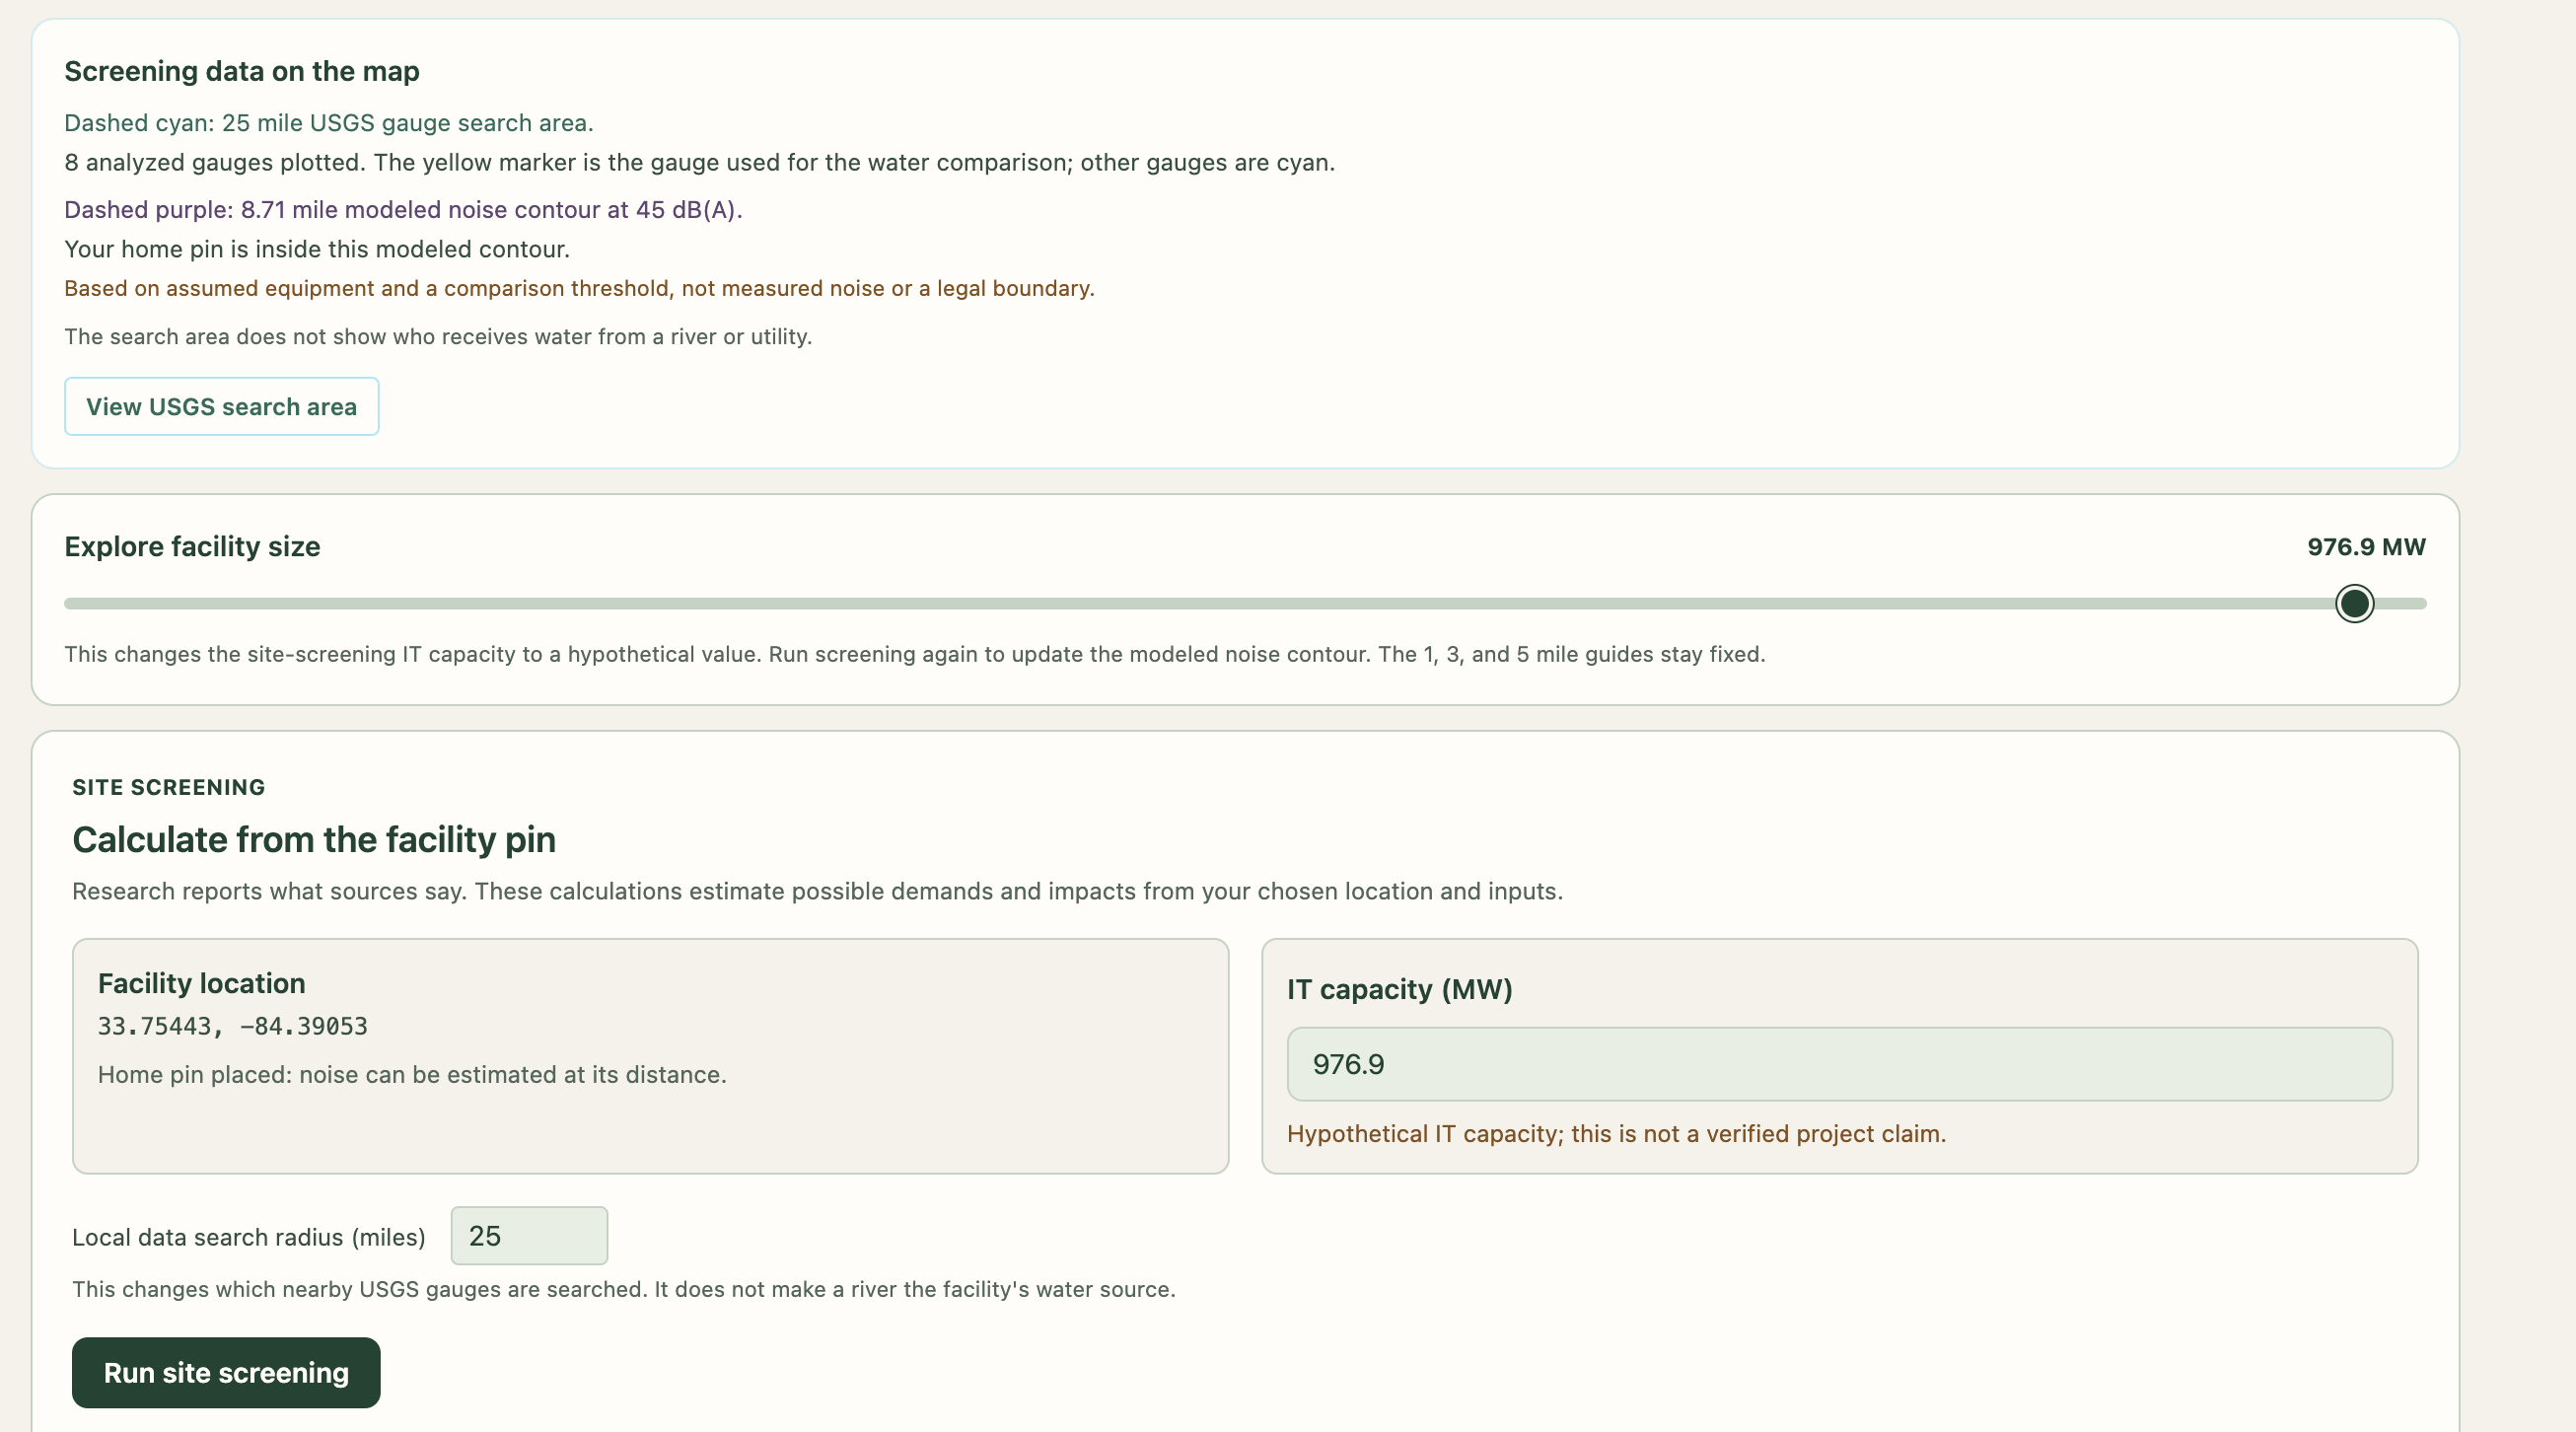
Details to enter about data center to explore
-
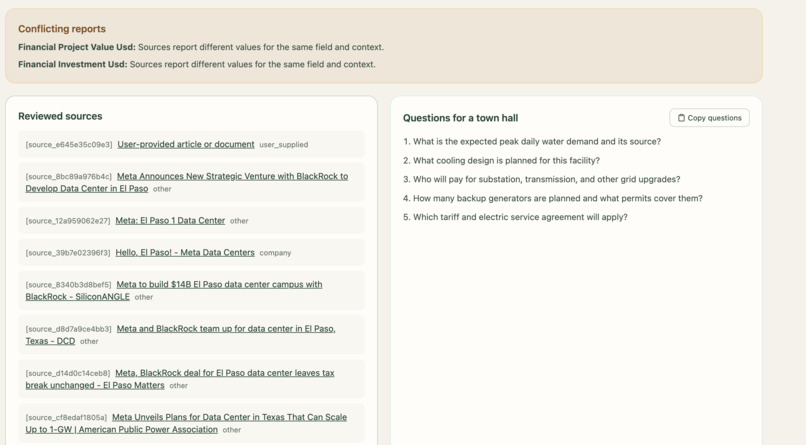
Displaying Information about Data center
-
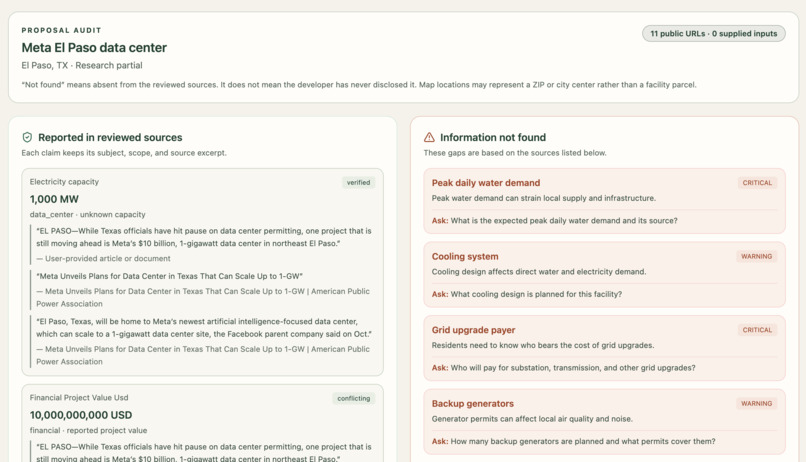
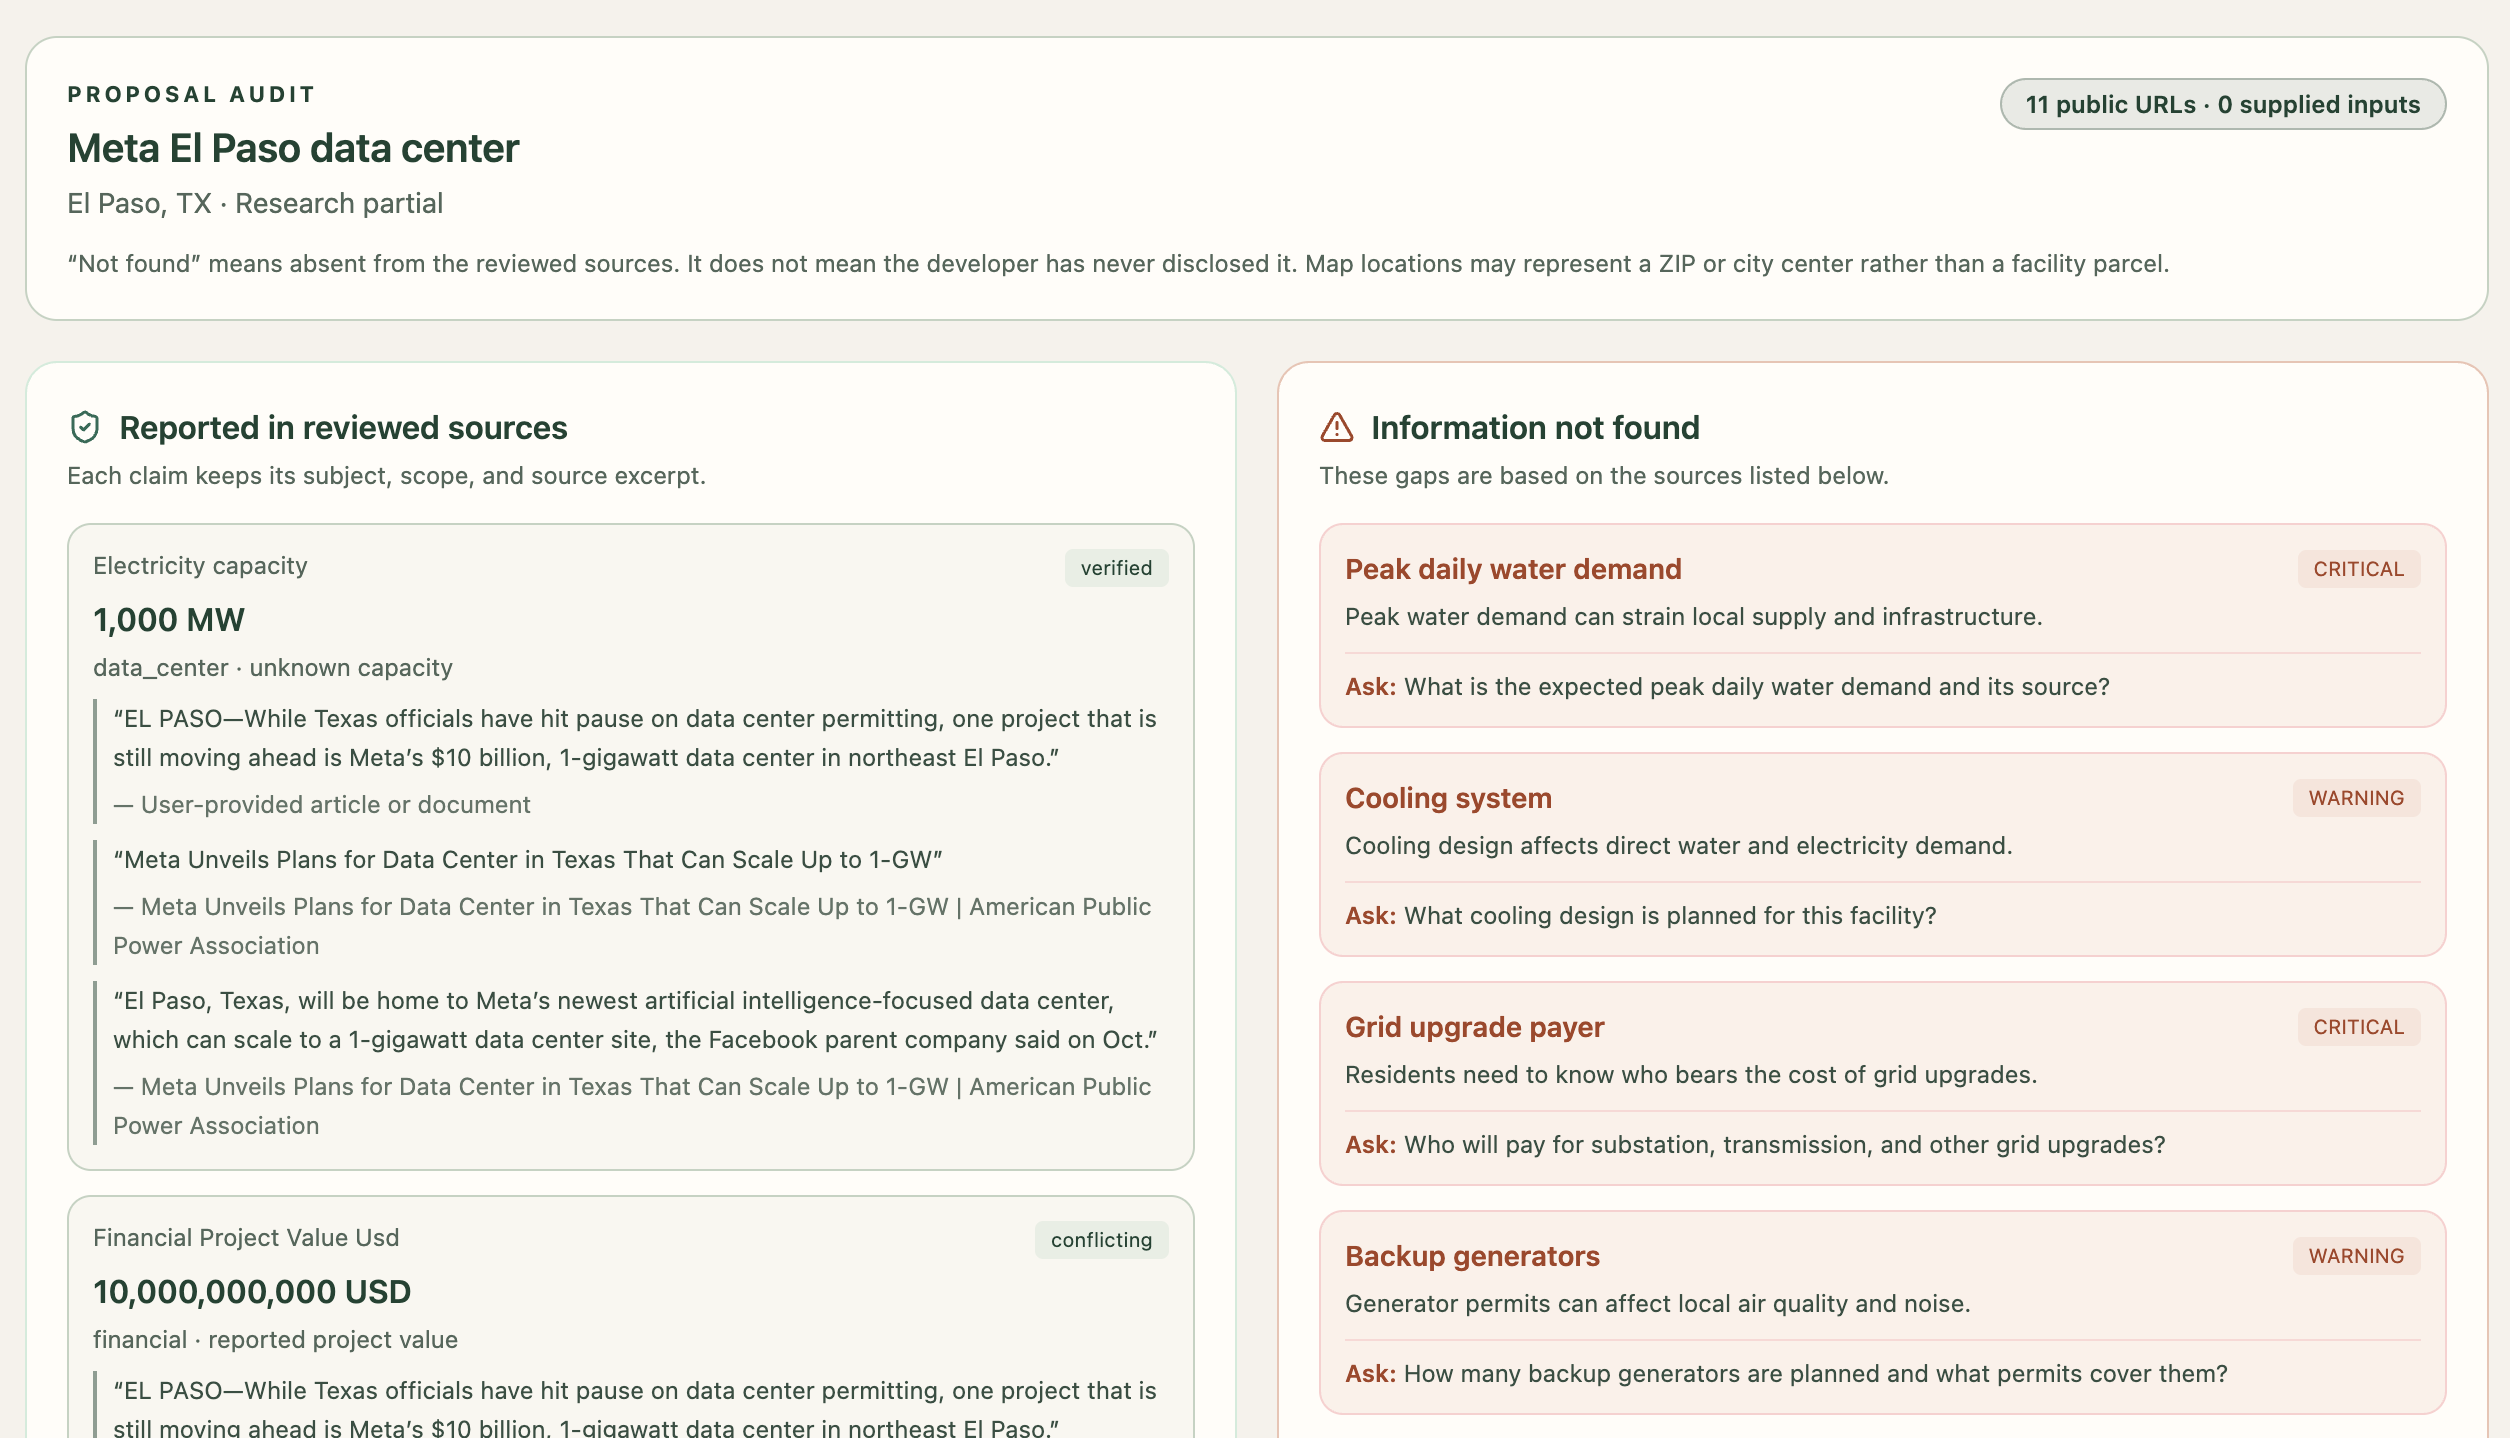
Details extracted about Data center in El Paso, Texas
-
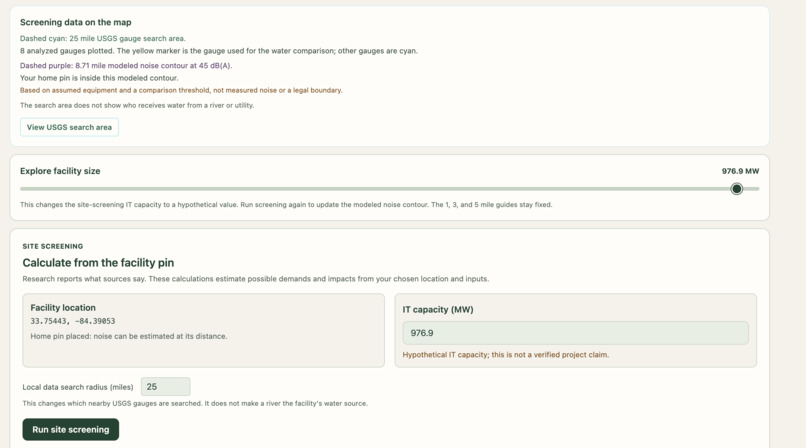
Option to change the facilty area and see effect on it
-
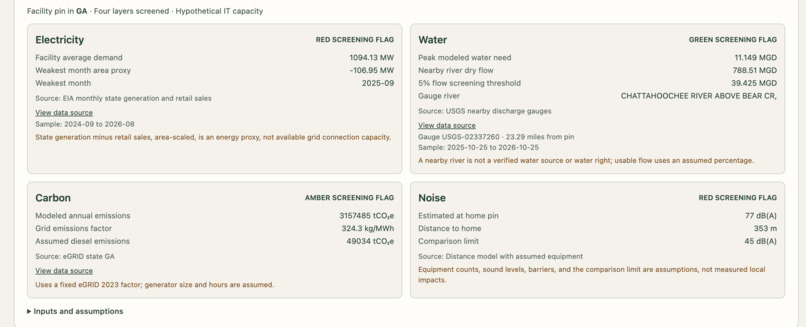
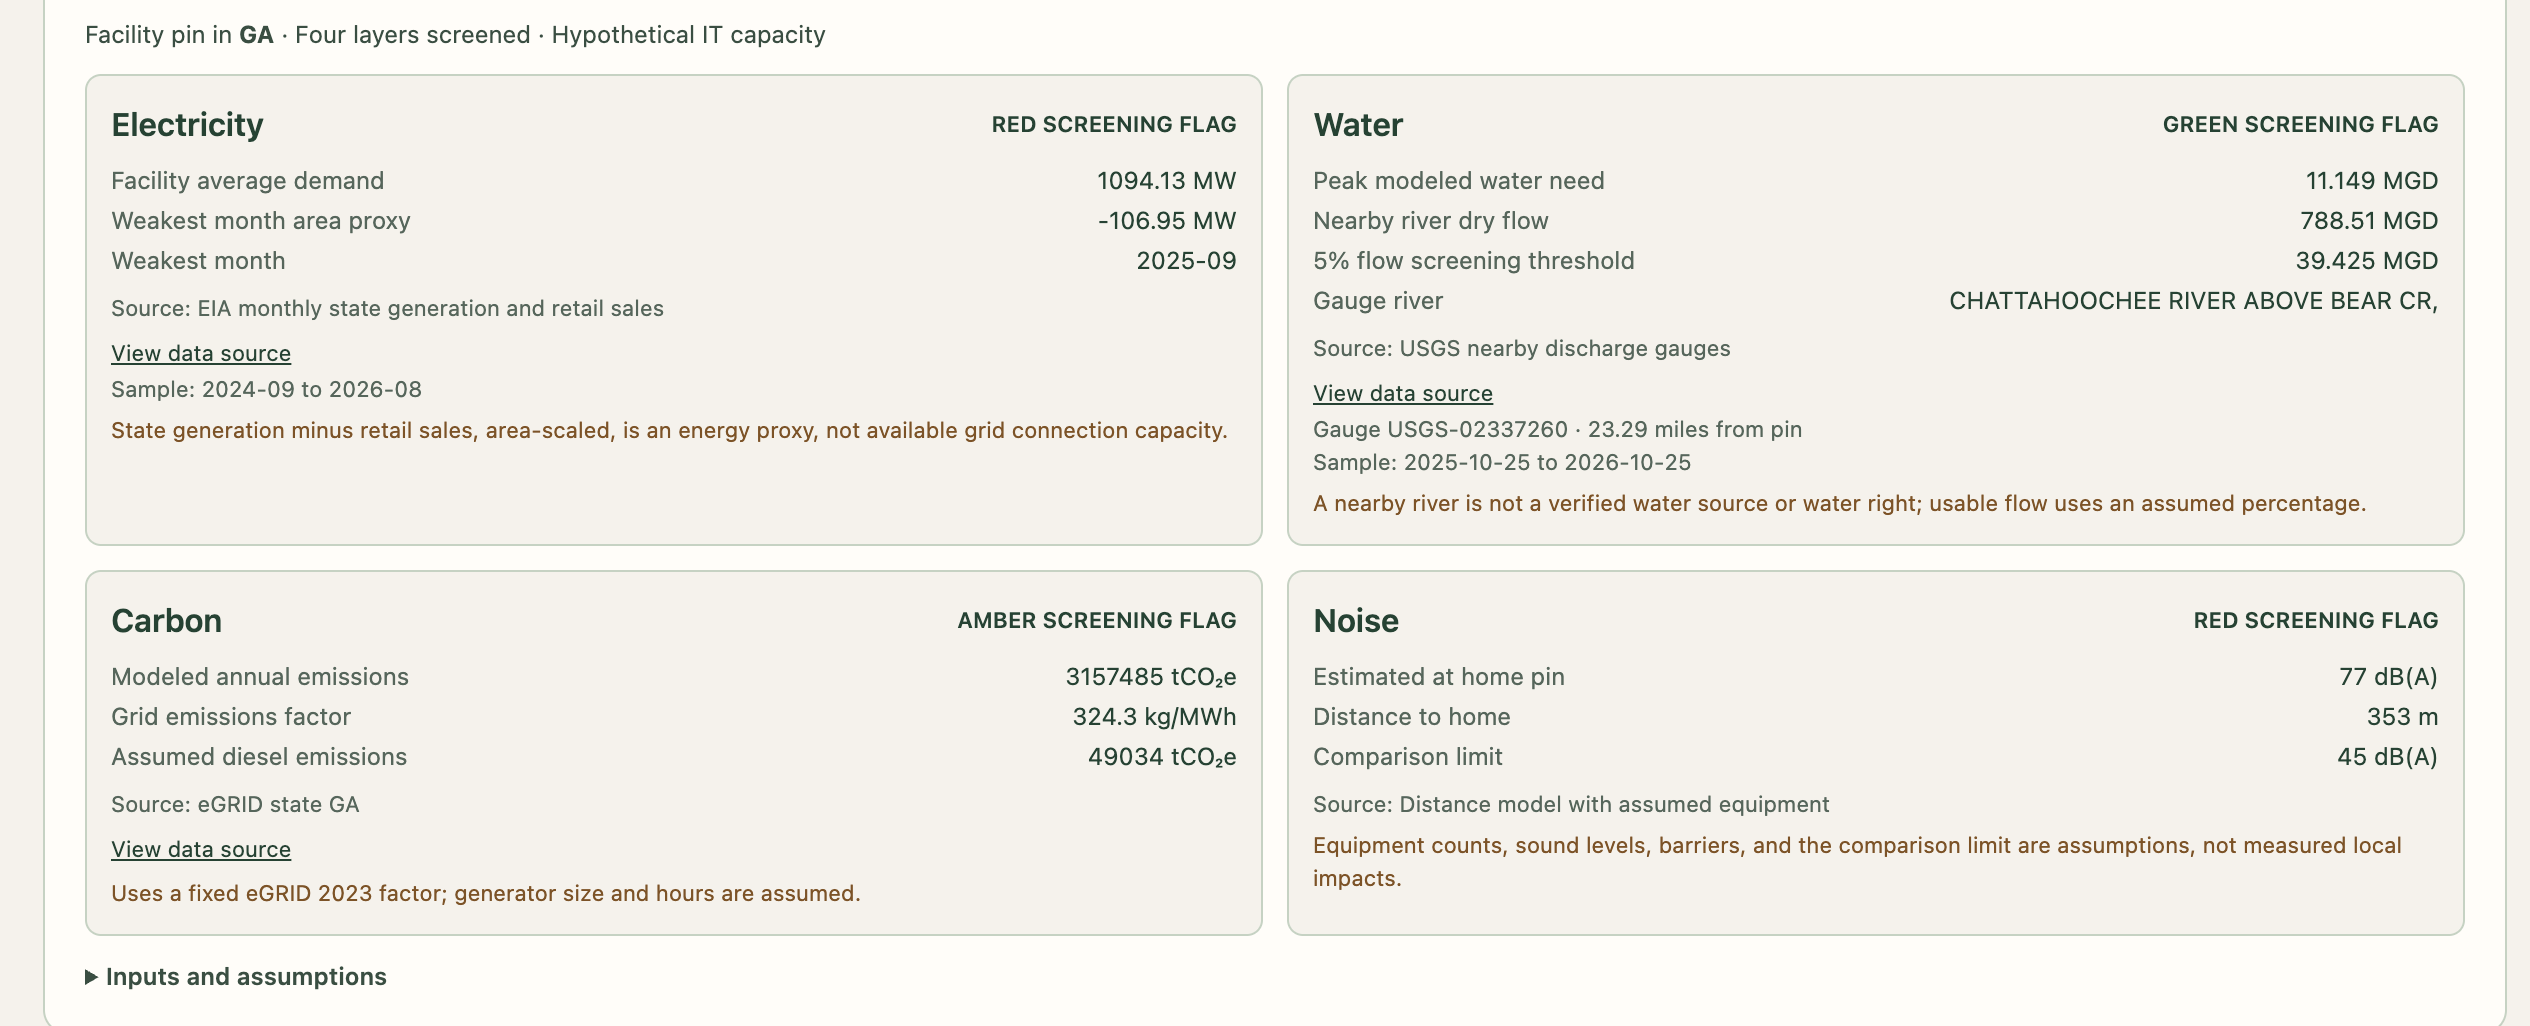
Details about Electrcity and water supply, carbon emission and noise levels near listed facility.
-
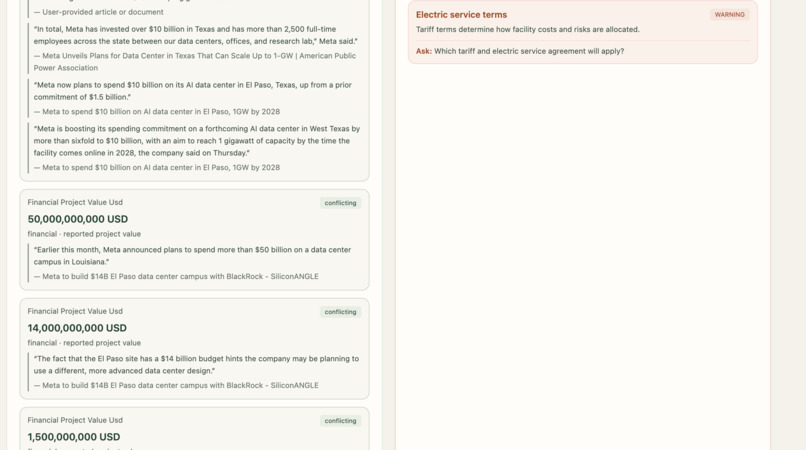
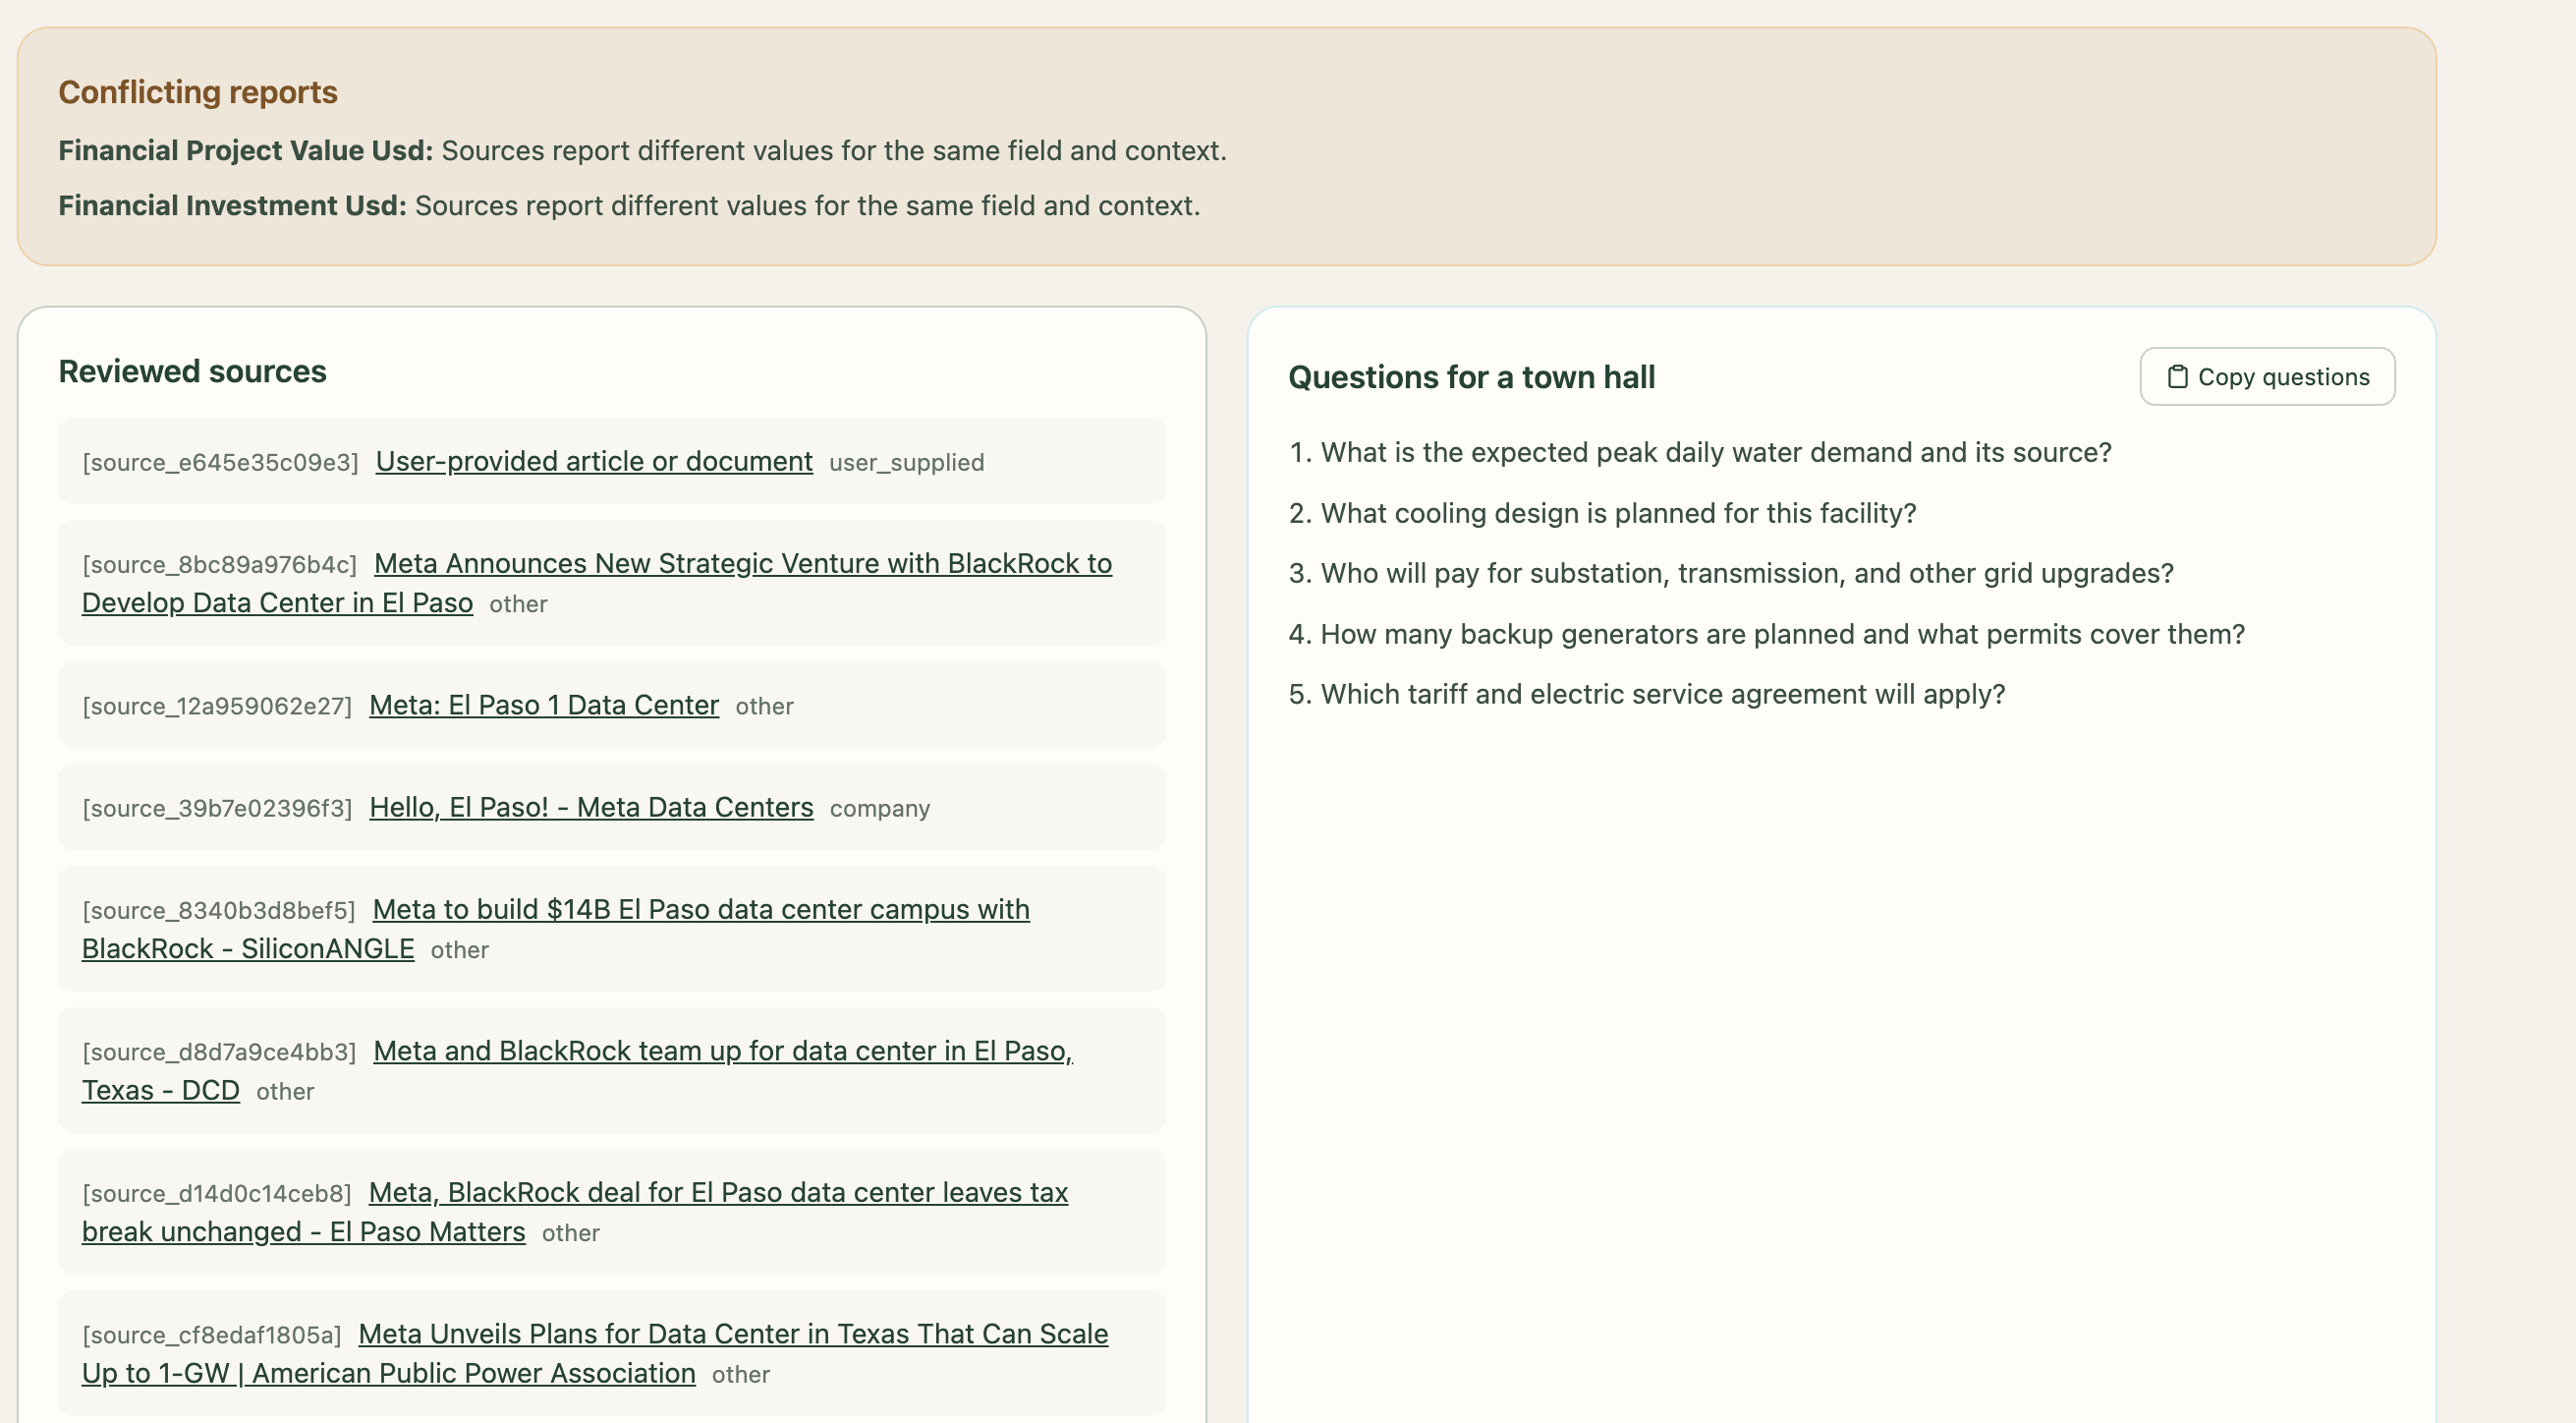
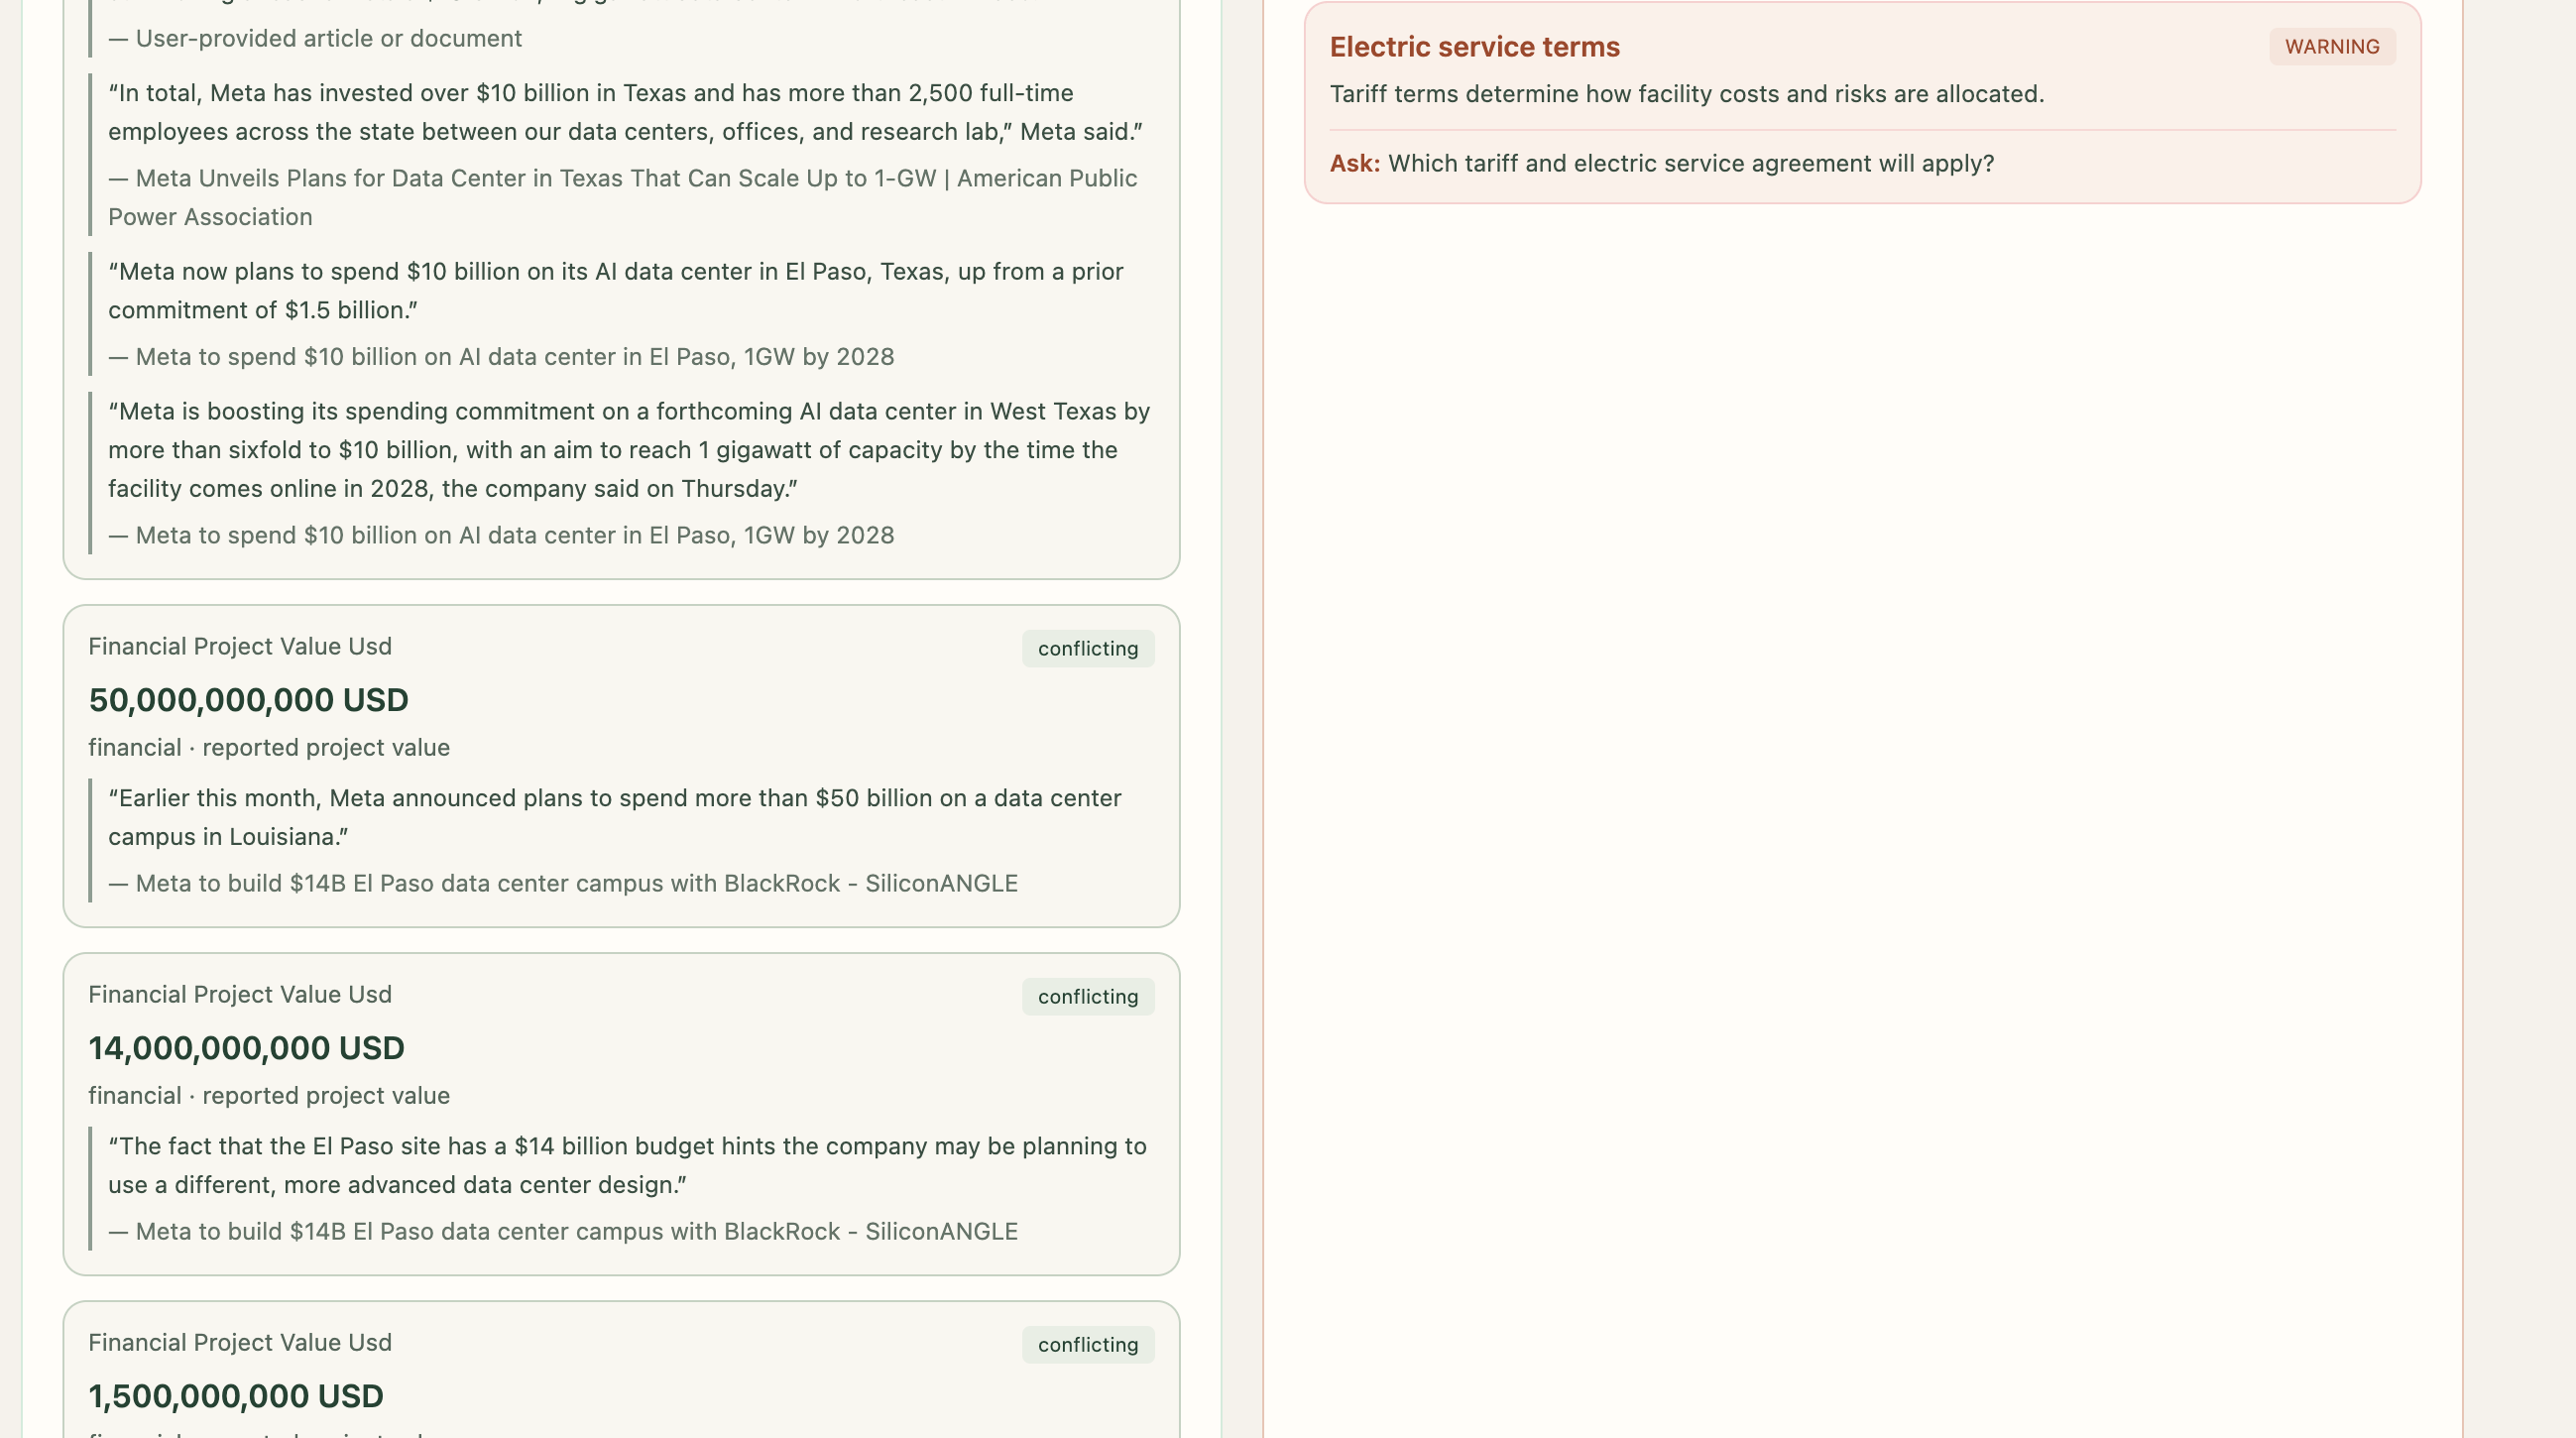
Financial other reports for public.
-

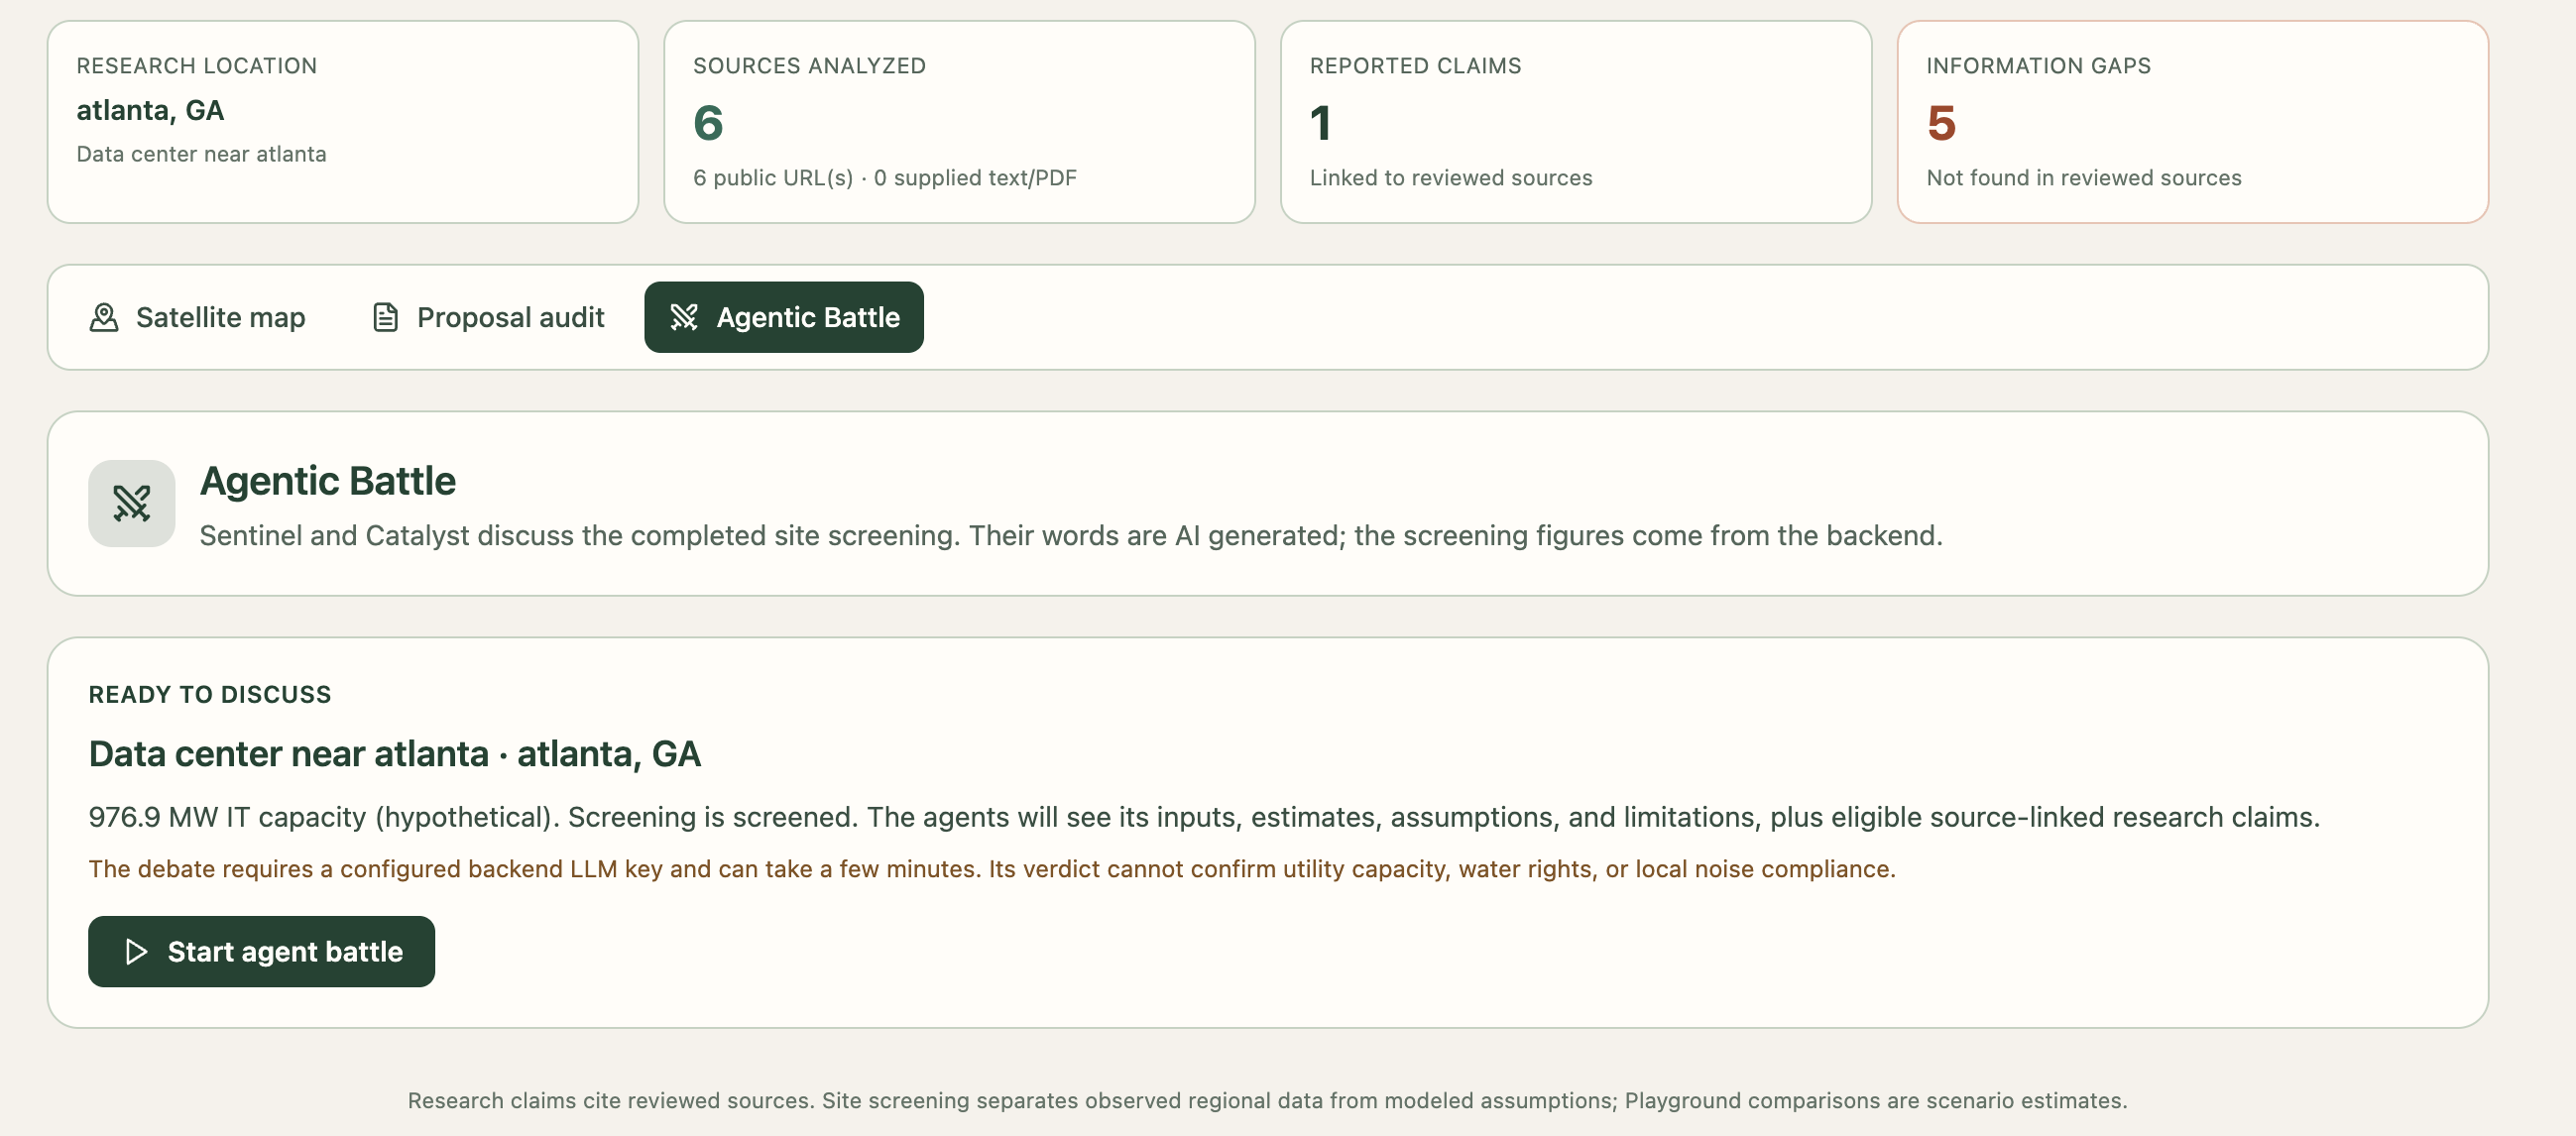
Agentic Battle
-
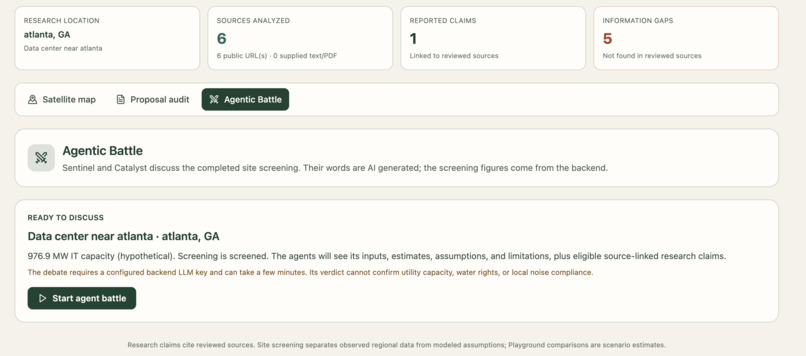
Reports of sources
-
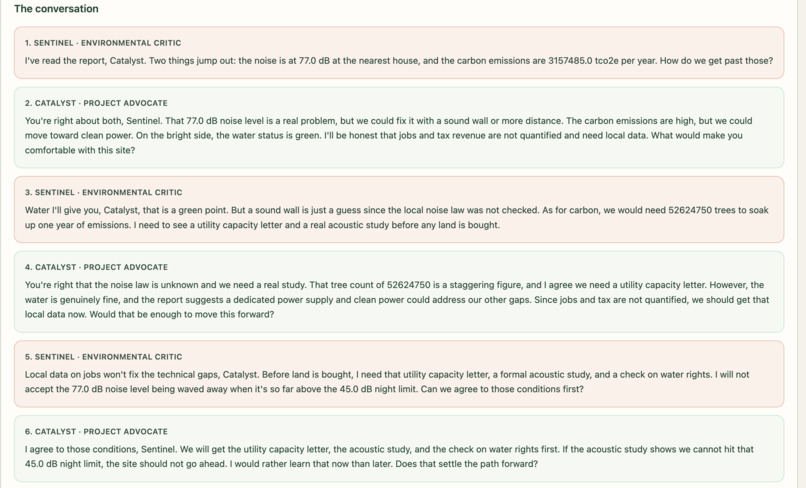
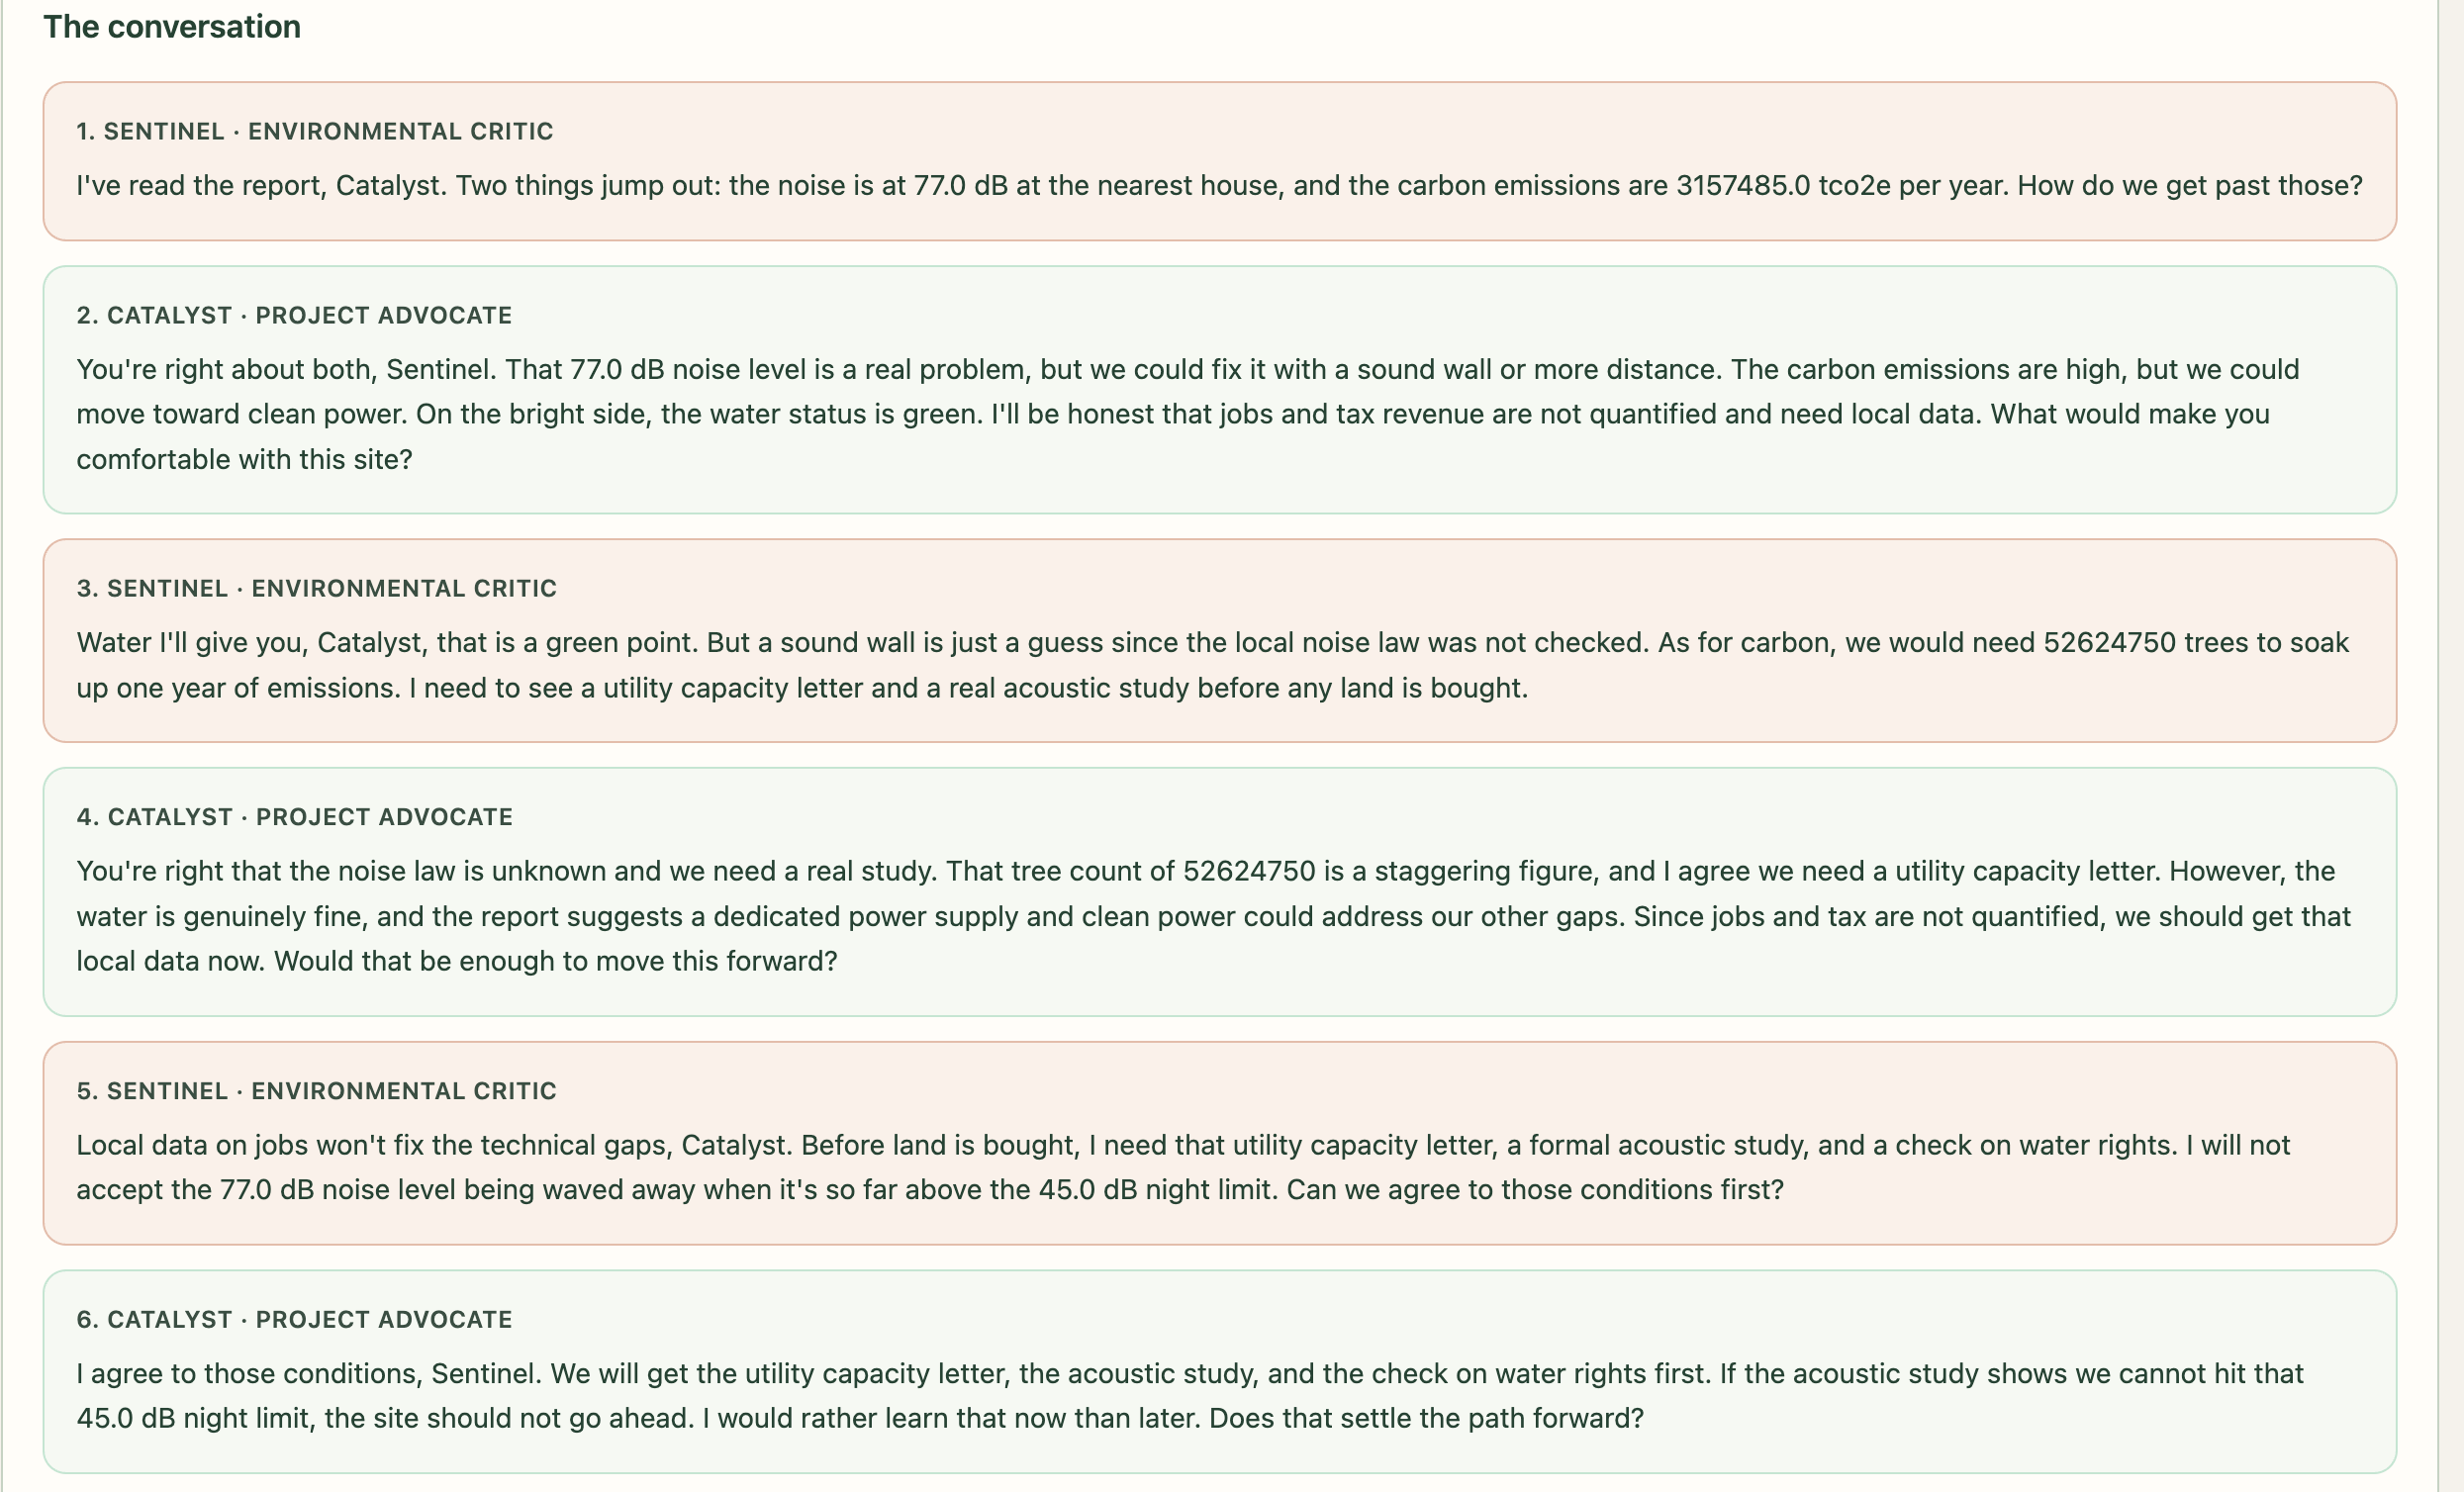
Conversation between Battles
-
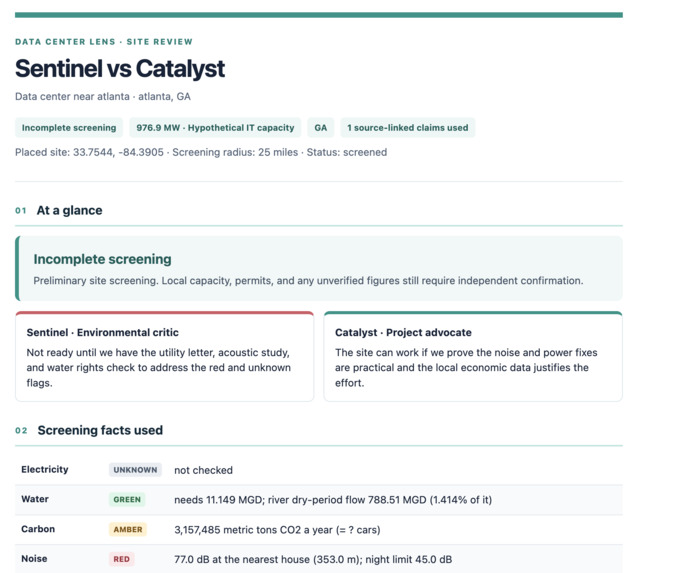
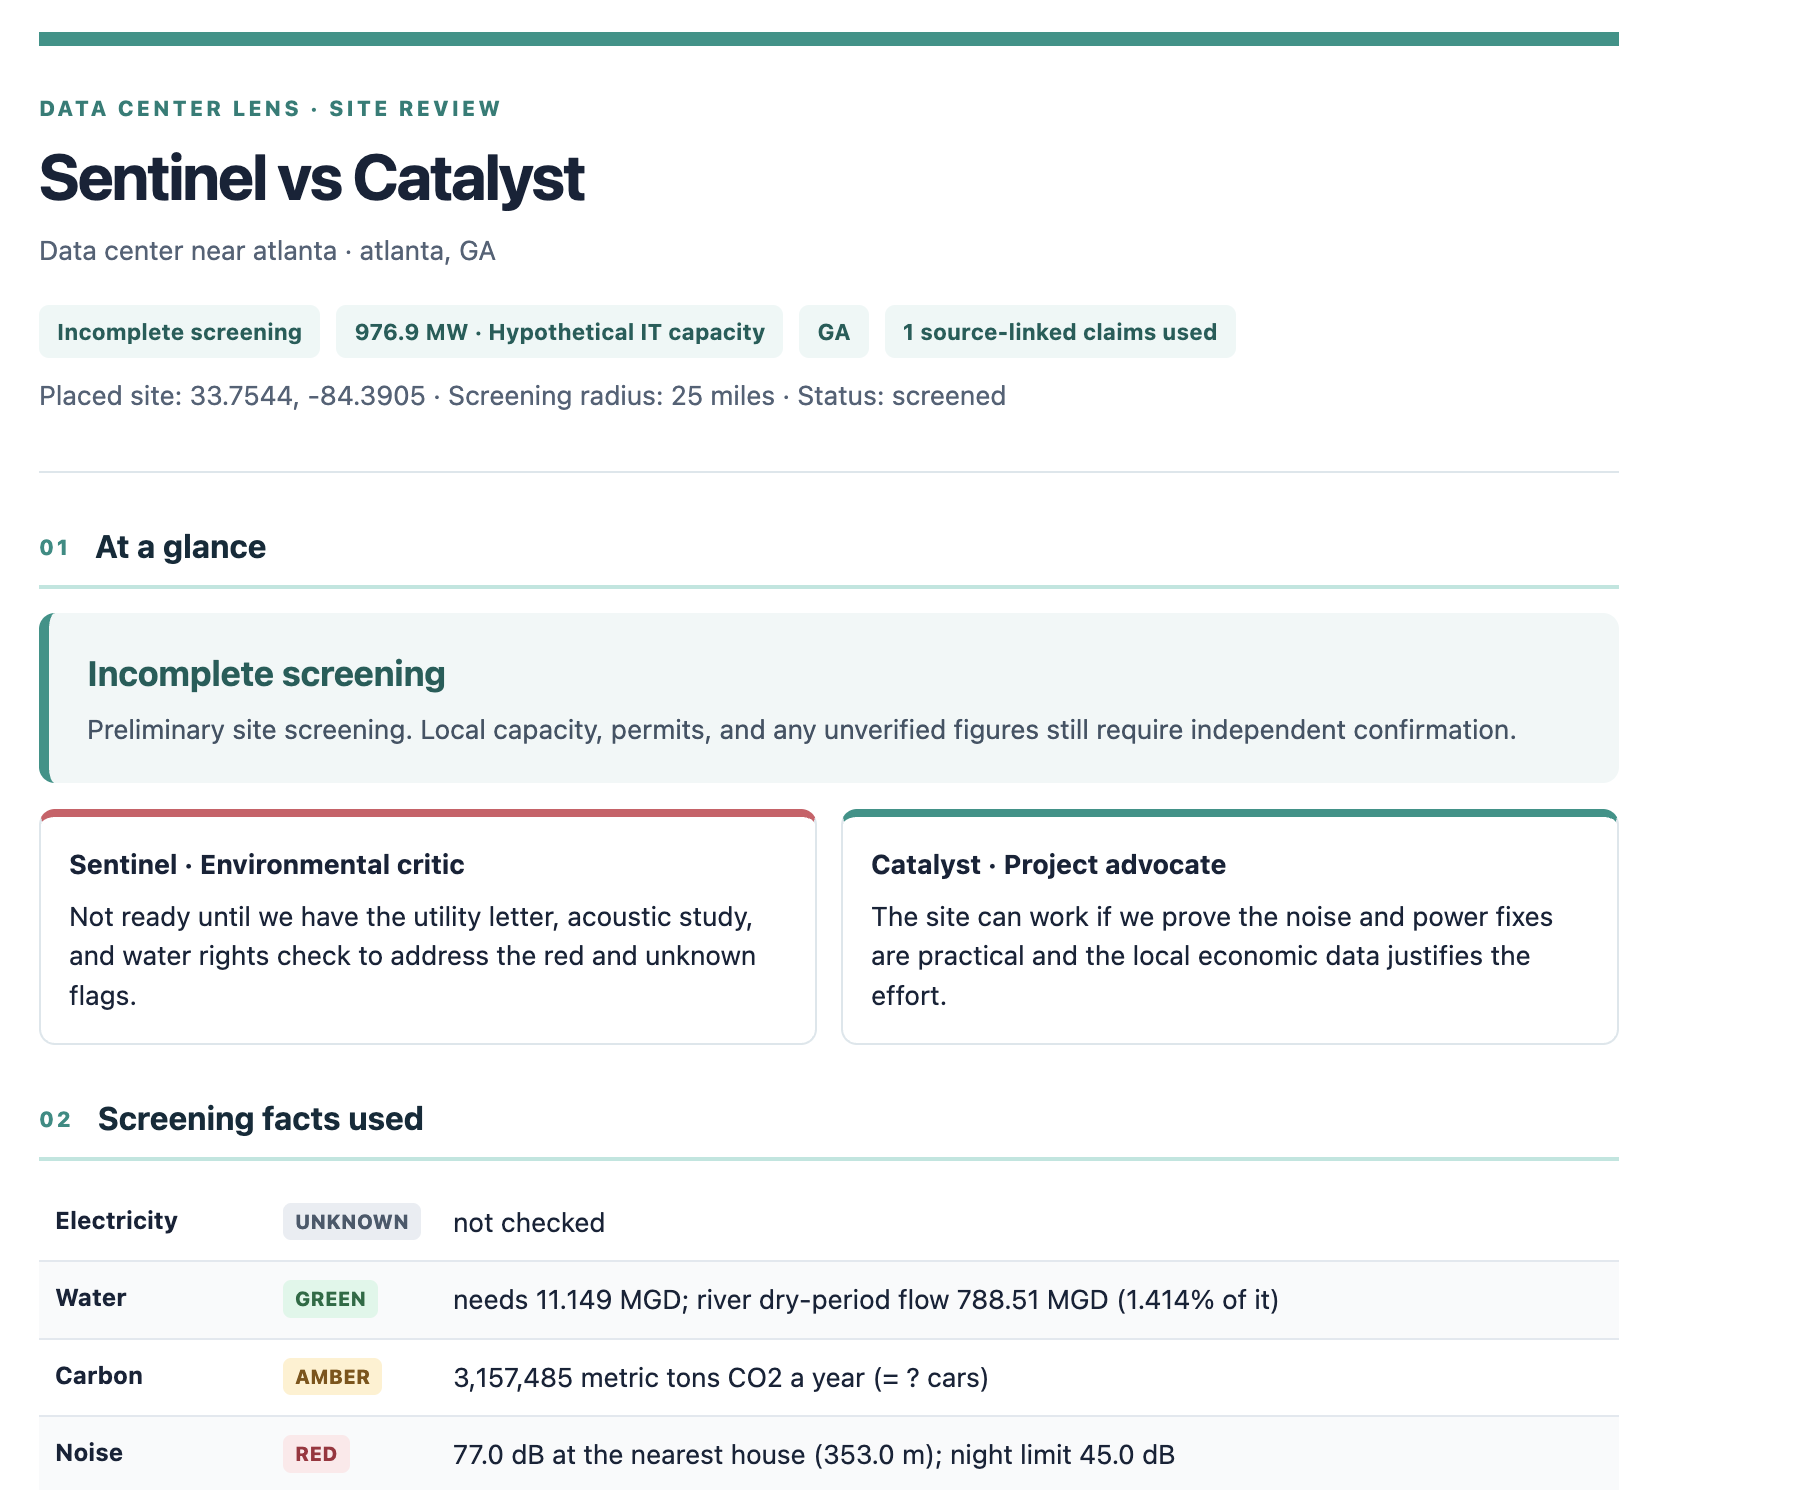
Detailed PDF generated as a result of agentic battle
-
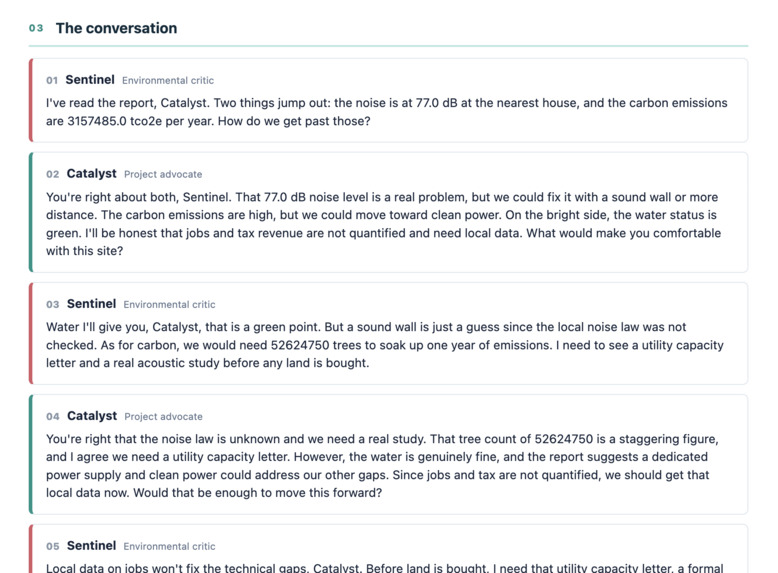
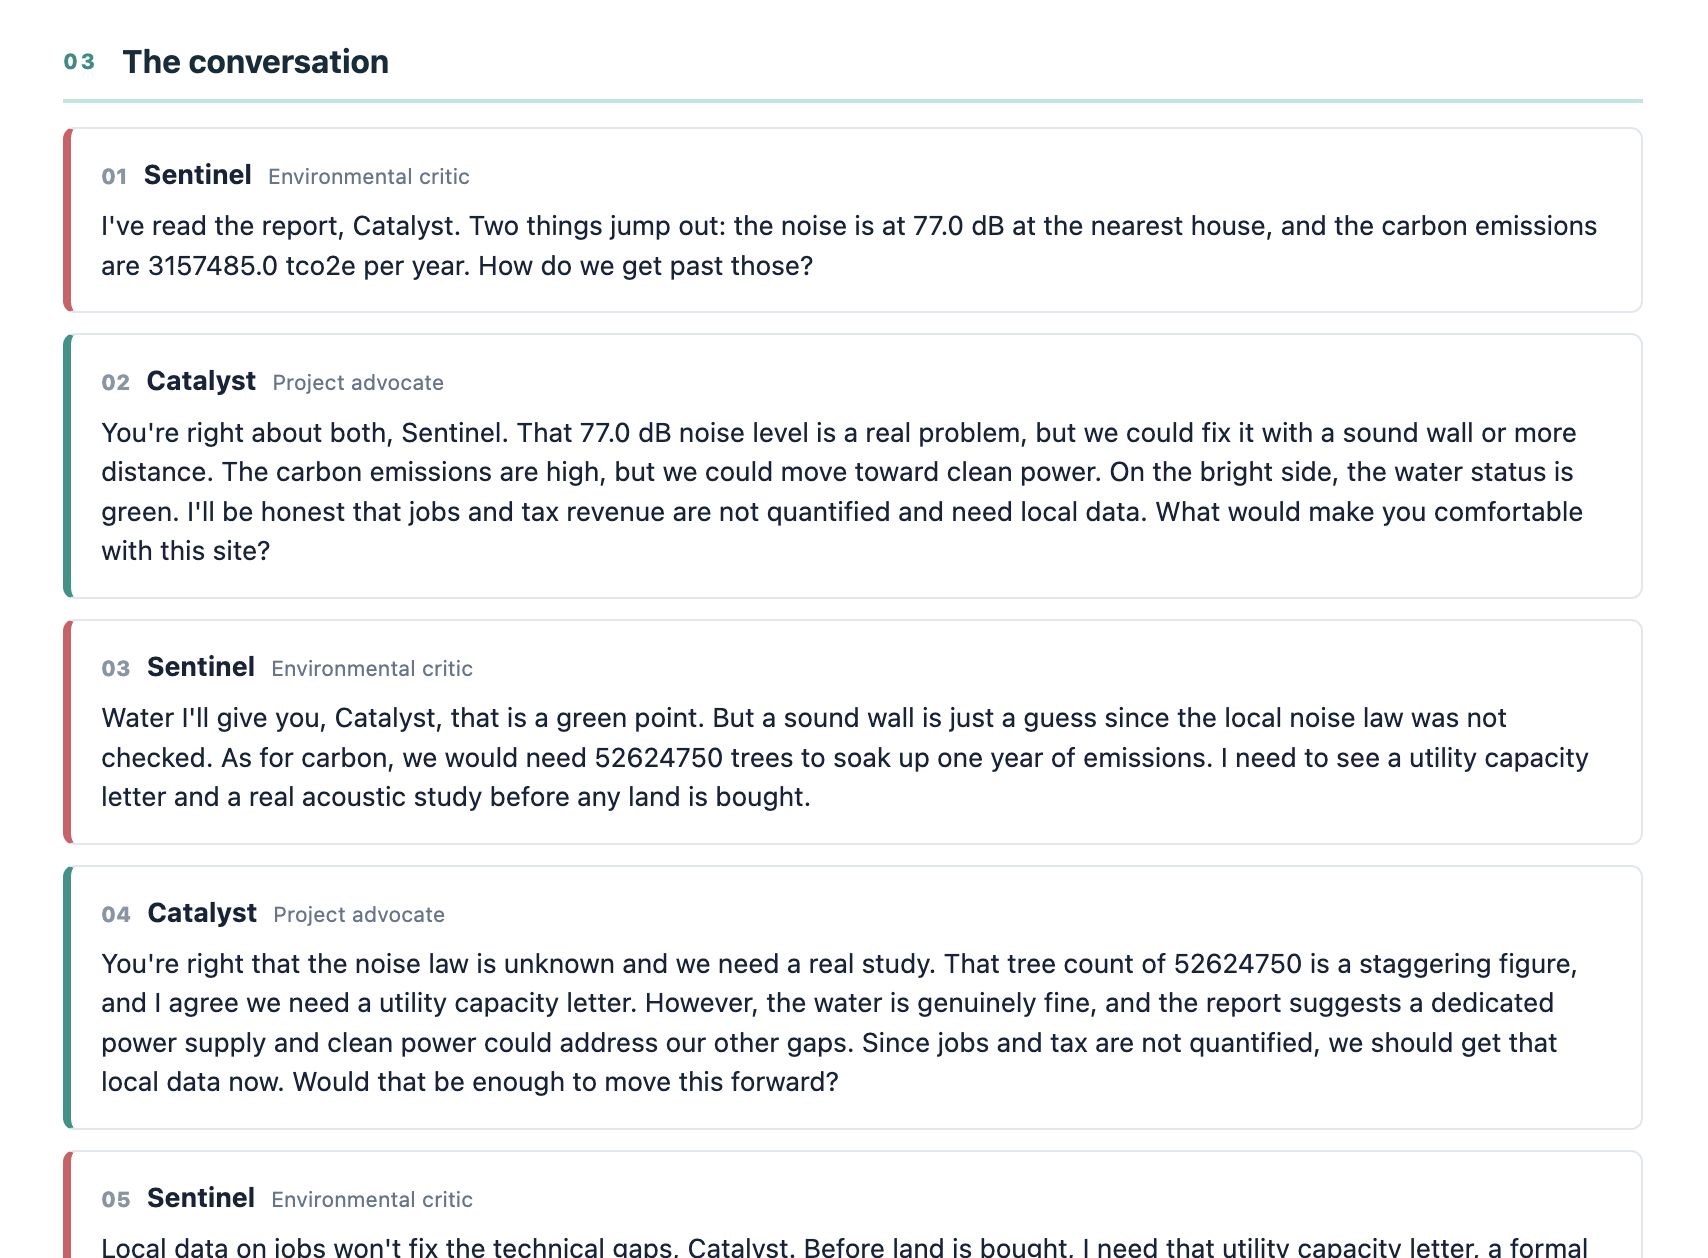
PDF Page 2

Inspiration
Data centers are expanding rapidly into local communities, often hidden in plain sight behind windowless industrial facades. While tech companies publish glossy sustainability reports and net-zero commitments, local residents are left wondering about the real-world consequences on their municipal water supplies and electrical grids. We were inspired to build Data Center Lens to strip away the corporate PR layer and give everyday citizens a straightforward, citizen-detective utility tool to investigate the physical and environmental reality in their own backyards.
What it does
Data Center Lens is a web-based transparency tool designed to expose the true resource footprint of local data centers. Users can:
- Pinpoint Facilities: Explore an interactive geospatial map to locate data centers in their area.
- Extract Resource Data: Pull comprehensive real-world metrics on water consumption, electric consumption utilization, remaining capacity, noise levels, carbon emissions, and overall environmental impact.
- Agentic Battle: Consult an interactive AI agent that weighs corporate claims against real-world resource costs in a balanced, data-driven breakdown.
- Export Instant Reports: Synthesize findings on the fly and generate a clean, citizen-ready PDF report for community advocacy and review.
How we built it
We built Data Center Lens focusing on simplicity, clarity, and actionable utility:
- Mapping & Data Pipeline: Integrated geospatial mapping to overlay local facility locations with resource data, utilizing the US EIA (Energy Information Administration) API to fetch regional electric consumption metrics and the USGS (U.S. Geological Survey) to analyze local water consumption and available rivers.
- Balanced Analysis Engine & LLM: Powered by Gemma, we programmed the Live Agent to evaluate multi-faceted arguments, contrasting corporate sustainability messaging with ground-truth resource impacts.
- Automated PDF Export: Implemented quick-generation tools to package investigation findings into portable, professional reports.
Challenges we ran into
- Avoiding Corporate Spin & Over-Committing: Crafting messaging that was neither too complex nor overly ambitious required rigorous iteration down to a sharp, punchy tone.
- Balancing Technical Density: Presenting dense environmental datasets alongside a live debating agent without cluttering the interface required careful design choices focused on readability.
Accomplishments that we're proud of
- Measuring impact of data centers without having any bias for or against it.
- Enabling people with a tool to react on any new development with correct information.
- Successfully implementing a balanced AI agent that cuts through PR talking points to provide an objective look at both sides of data center expansion.
What we learned
- Clarity Beats Complexity: Users don't want abstract compute metrics; they want concrete, local numbers: Where is the water going? What is the grid strain?
- Utility Trumps Flash: Keeping the focus strictly on investigation and documentation creates a far more powerful and trustworthy tool for community engagement.
What's next for DataCenter Lens
- Expanding regional data coverage to map more municipal hubs across the country.
- Enhancing community collaboration features to make sharing and exporting reports even more seamless for local watchdogs.
Built With
- api
- css
- fastapi
- gemini
- gemma
- llm
- maplibreusgs
- numpy
- openstreetmap
- pandas
- pypdf
- python
- react
- satellite-imagery
- tailwind
- typescript
- usgs
- uvicorn
- vite


Log in or sign up for Devpost to join the conversation.