-
-
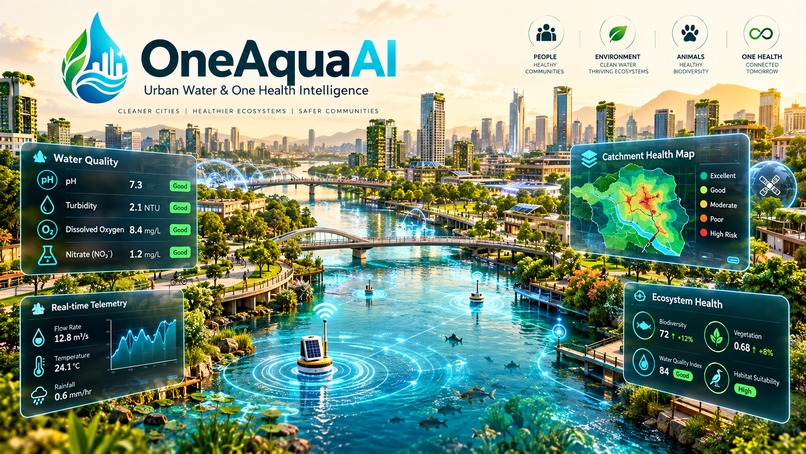
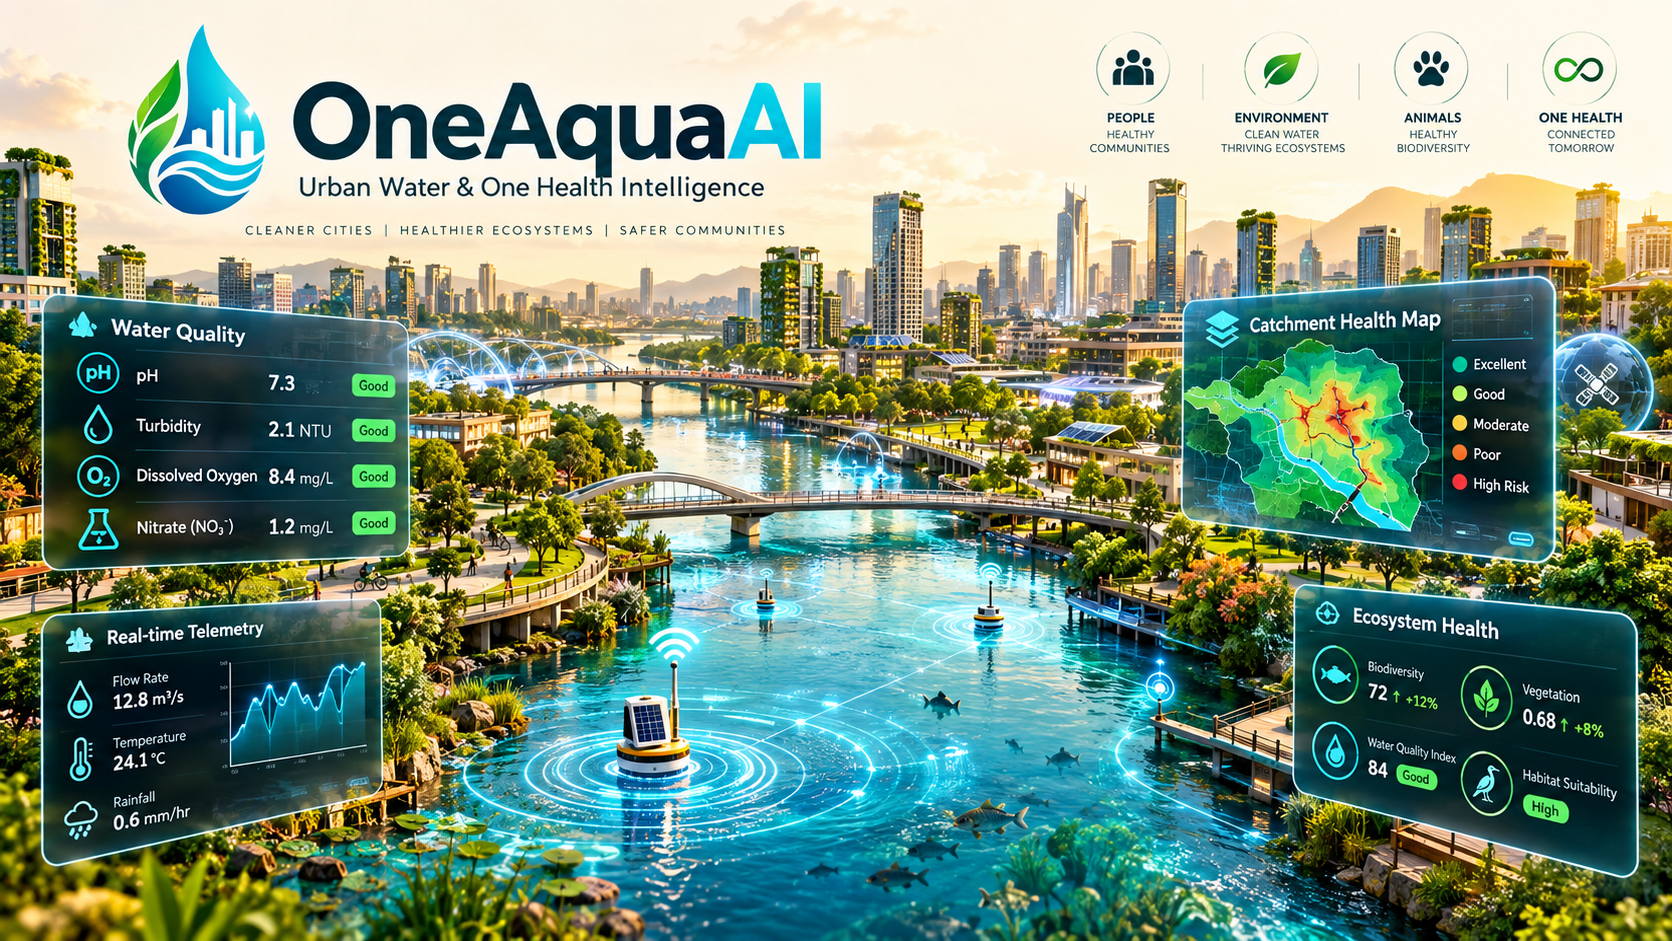
OneAquaAI: Building Smarter, Healthier, Sustainable Cities
Inspiration
Urban waterbodies—canals, lakes, retention ponds, and urban wetlands—serve as the vital circulatory system of modern metropolises. Yet in rapidly densifying cities, these water ecosystems suffer from severe untreated runoff, industrial effluents, and climate-induced stagnation. The consequences cascade into human communities: stagnant, eutrophic water bodies breed disease vectors like Aedes aegypti and Culex quinquefasciatus, producing outbreaks of dengue and lymphatic filariasis. This interconnected crisis exemplifies the One Health paradigm—the deep link between human health, animal populations, and shared aquatic ecosystems. Municipal authorities often rely on sparse monthly grab-sampling stations that miss acute micro-catchment degradation. We built OneAquaAI: Data-to-Insight to bridge ground-level citizen science with multimodal AI and epidemiological modeling, transforming everyday community observations into rapid, localized public health early warnings.
What it does
OneAquaAI: Data-to-Insight converts community field reports into quantitative hydrological and bio-risk intelligence: Multimodal Field Reporting: Citizens and volunteers record geotagged field reports capturing water appearance, odor profiles, estimated turbidity, and macroinvertebrate or larval bio-indicators. AI-Powered Diagnostics: Our pipeline evaluates visual observations to estimate water quality metrics, computing Carlson's Trophic State Index and assessing vector proliferation potential. Geospatial Catchment Risk Mapping: Aggregates reports into dynamic catchment heatmaps that track pollutant diffusion, stagnation gradients, and high-risk breeding zones. Early Warning Advisories: Automated risk advisories alert municipal sanitation workers and community health workers before an ecological crash or outbreak occurs. Offline-First Resilience: Field workers in low-connectivity areas can log observations offline using local IndexedDB caching, which automatically syncs with Firebase Firestore once online. Explore the live platform: OneAquaAI Live Deployment
How we built it
OneAquaAI was developed as an offline-first, full-stack reactive application: Frontend & Interface: Built with React 19, TypeScript, and Vite. Styled with Tailwind CSS in an ergonomic light beige aesthetic (#F6F3EC base canvas with warm stone and ivory surfaces) for prolonged field readability. Resilience Layer: Zero-crash architecture incorporating SafeMap, SafeChart, and SafeAI fallback layers with dual-mode accessible HTML tables. Cloud & Real-Time Sync: Firebase Firestore handles real-time distributed updates across catchment feeds. Multimodal AI Analysis: Gemini 2.5 Flash processes qualitative imagery and descriptions into quantitative environmental metrics. Quantitative & Bio-Risk Modeling We incorporated standard environmental engineering equations into the platform's analytical engine: '''1. Carlson's Trophic State Index ( ): Using Secchi disk depth equivalence in meters and Chlorophyll- concentration ((\text{Chl-}a)) in (\mu\text{g/L}): Classification benchmarks: : Oligotrophic (Clear, low biological productivity) : Mesotrophic (Moderate productivity, balanced ecosystem) : Eutrophic (High nutrient accumulation, algal bloom risk) : Hypereutrophic (Severe scum, dissolved oxygen crashes)
- Vector Transmission Potential Index ( ): We model vector proliferation risk as a logistic response to ambient surface temperature in , surface stagnation , organic debris index , and hydrological flow rate in (\text{m/s}):
- Observation Confidence Weighting ( ): To prevent crowd-sourced noise from skewing catchment scores, each report is weighted by device GPS precision (\Delta p) in meters, user history factor , and computer-vision consensus score (\Phi): Core Risk Scoring Implementation code TypeScript export function computeCatchmentRisk( tsi: number, stagnation: number, larvalDensity: number, flowRate: number ): { riskScore: number; riskLevel: 'Low' | 'Moderate' | 'High' | 'Critical' } { // Normalize Carlson's TSI to [0, 1] range const normalizedTsi = Math.min(Math.max((tsi - 30) / 70, 0), 1);
// Vector transmission logistic calculation const logit = -2.5 + (1.8 * stagnation) + (2.2 * larvalDensity) - (1.4 * flowRate); const vectorRisk = 1 / (1 + Math.exp(-logit));
// Composite One Health risk index const riskScore = (0.45 * normalizedTsi) + (0.55 * vectorRisk);
let riskLevel: 'Low' | 'Moderate' | 'High' | 'Critical' = 'Low'; if (riskScore >= 0.75) riskLevel = 'Critical'; else if (riskScore >= 0.50) riskLevel = 'High'; else if (riskScore >= 0.25) riskLevel = 'Moderate';
return { riskScore, riskLevel }; }''' Challenges we ran into
Subjective Field Data Variability:
Volunteer observations vary across lighting conditions and camera quality. We implemented confidence scoring with spatial-temporal neighborhood clustering to filter out anomalous readings.
Geospatial Performance on Low-End Devices:
Rendering dozens of catchment polygons and interactive heatmaps caused frame drops on budget mobile devices. We solved this with spatial canvas tiling and a quick-toggle accessible tabular view. True Offline Data Synchronization: Building an IndexedDB local-first queue that handles two-way reconciliation with Firebase Firestore without race conditions or duplicated writes during spotty network transitions.
Accessible Environmental Color Coding:
Standard ecological dashboards use dark or neon palettes. Re-engineering the visual language into an accessible light beige palette required careful tuning of WCAG AA contrast ratios ( ). Accomplishments that we're proud of Actionable One Health Synthesis: Bridging ecological degradation metrics ( , dissolved oxygen) directly with vector-borne disease early warning scores. Fault-Tolerant Architecture: Implementing SafeMap, SafeChart, and SafeAI wrappers so the application never crashes, even when network connectivity drops or map tile providers fail. Inclusive Accessibility: Creating a high-contrast, light beige UI with dynamic font and element scaling controls for field workers operating under direct sunlight. Instantaneous Sync: Real-time updates delivered to field coordinators via Firestore data feeds within milliseconds.
What we learned
Physical Anchors Enhance AI Accuracy: Multi-modal vision analysis yields much higher precision when users include simple visual anchors (such as water edge contrast or foam texture) rather than open-water photos alone. Closing the Feedback Loop Drives Engagement: Citizens consistently submit higher-quality reports when the app transparently demonstrates how their observation influenced localized risk levels. Offline-First Architecture is Non-Negotiable: For field monitoring applications, offline resilience must be treated as core functionality rather than an add-on.
What's next for Data-to-Insight
Satellite Remote Sensing Integration: Fusing European Space Agency Sentinel-2 satellite data (NDWI: Normalized Difference Water Index, and FAI: Floating Algae Index) with community ground-truth reports at 10-meter resolution:
Predictive Runoff Modeling:
Integrating hydrodynamic advection-diffusion transport equations: to forecast where storm runoff will pool and trigger vector breeding blooms 48–72 hours before rainfall events.
Municipal Open311 Webhooks:
Automating direct ticket generation for city municipal sanitation and vector-control larvicide response teams whenever critical risk thresholds are crossed.
Open-Hardware Sensor Nodes:
Connecting community observations with low-cost, solar-powered IoT water temperature and turbidity buoys for continuous 24/7 validation.
Built With
- citizen-science
- computer-vision
- environmental-science
- epidemiology
- express.js
- firebase
- firestore
- geojson
- gis
- google-gemini
- hydrology
- indexeddb
- leaflet.js
- lucide-react
- machine-learning
- node.js
- offline-first
- one-health
- pwa
- react
- recharts
- tailwindcss
- typescript
- vite

Log in or sign up for Devpost to join the conversation.