Inspiration
The inspiration for this project came from the need for a truly flexible, no-code data analysis tool that empowers anyone to extract insights from any CSV file
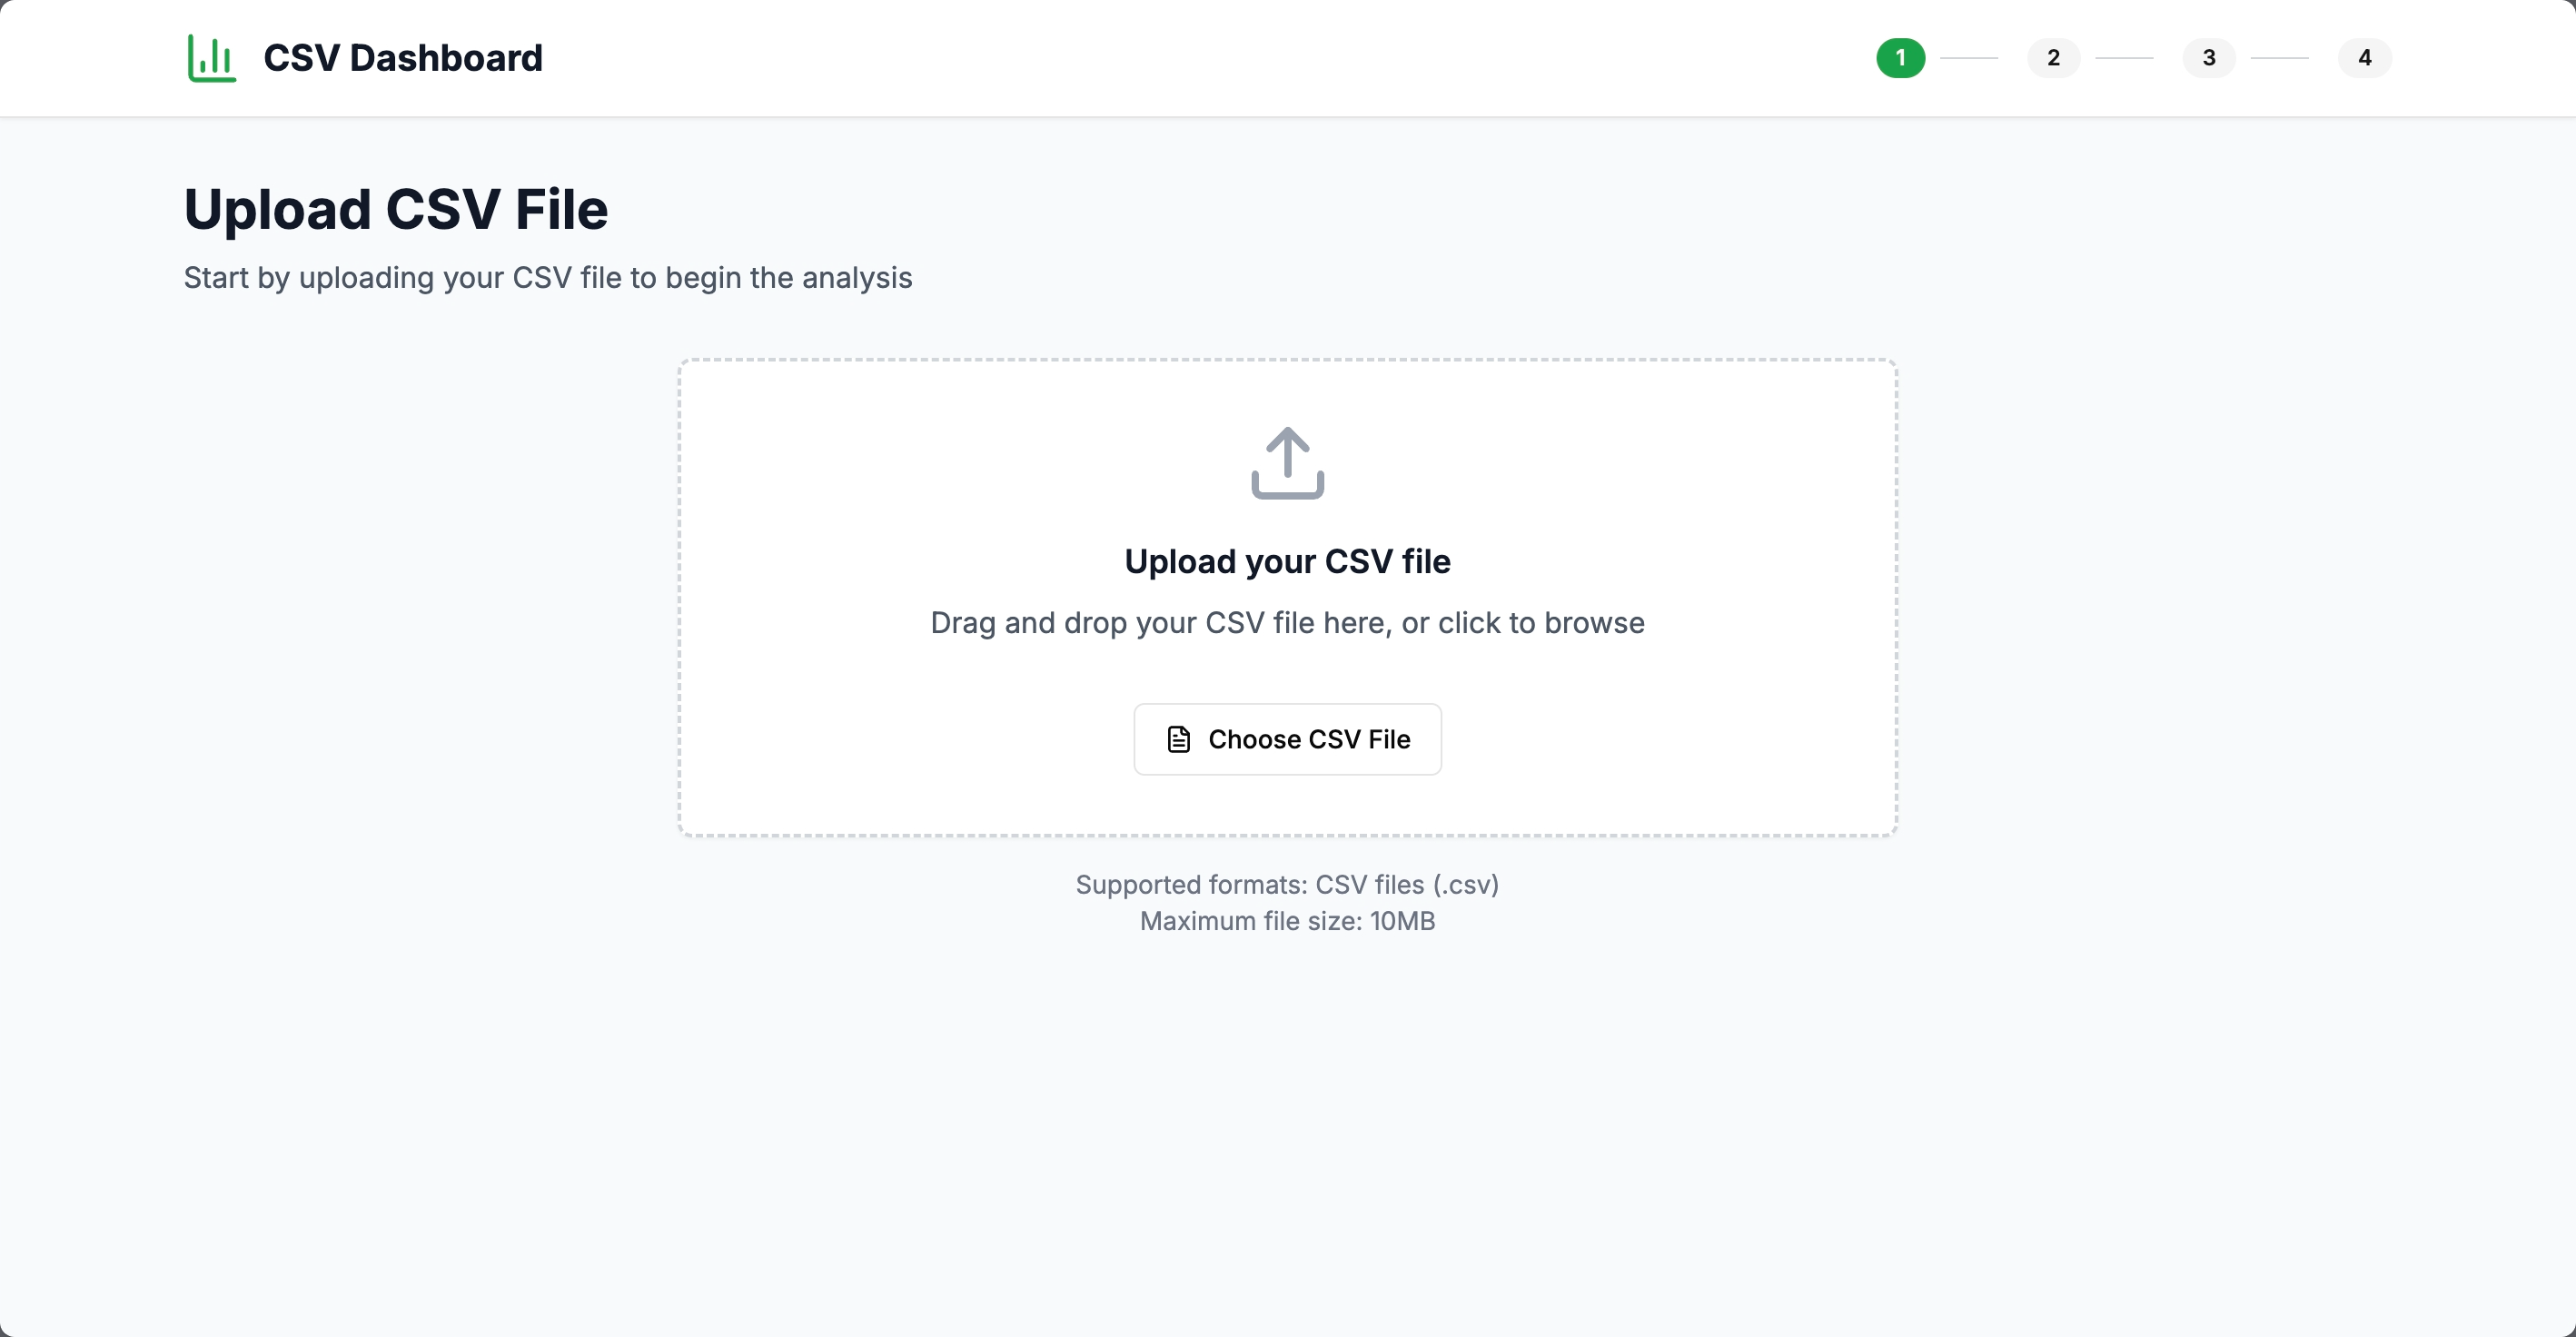
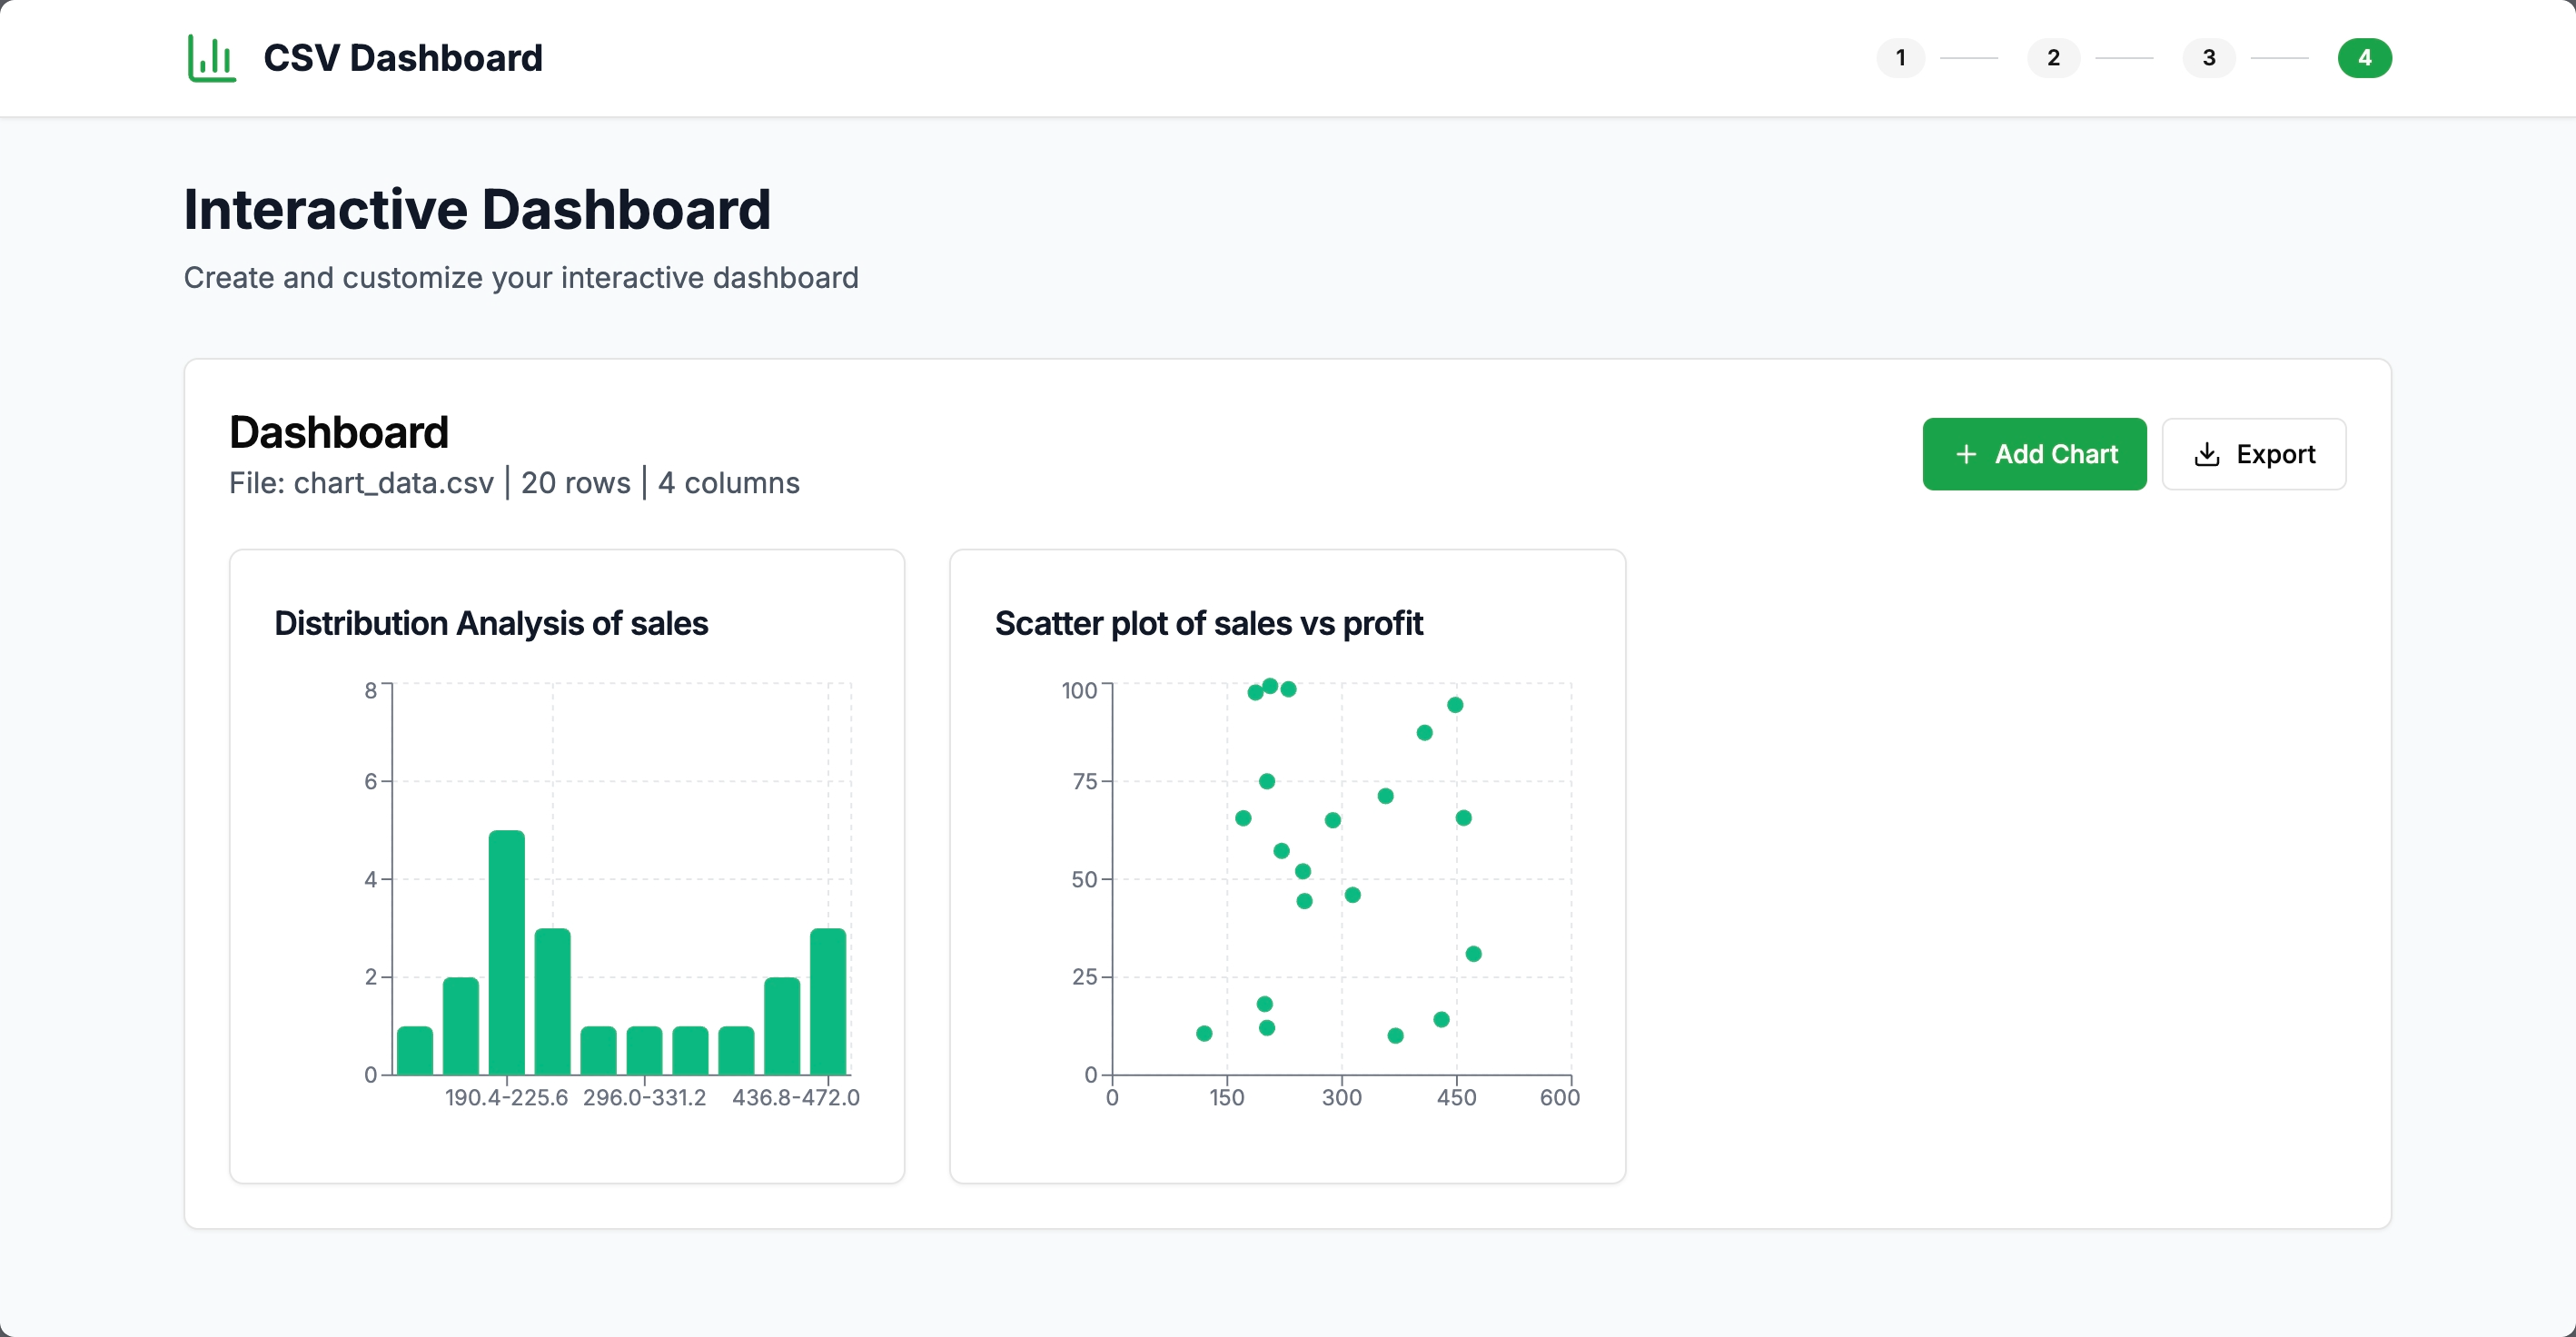
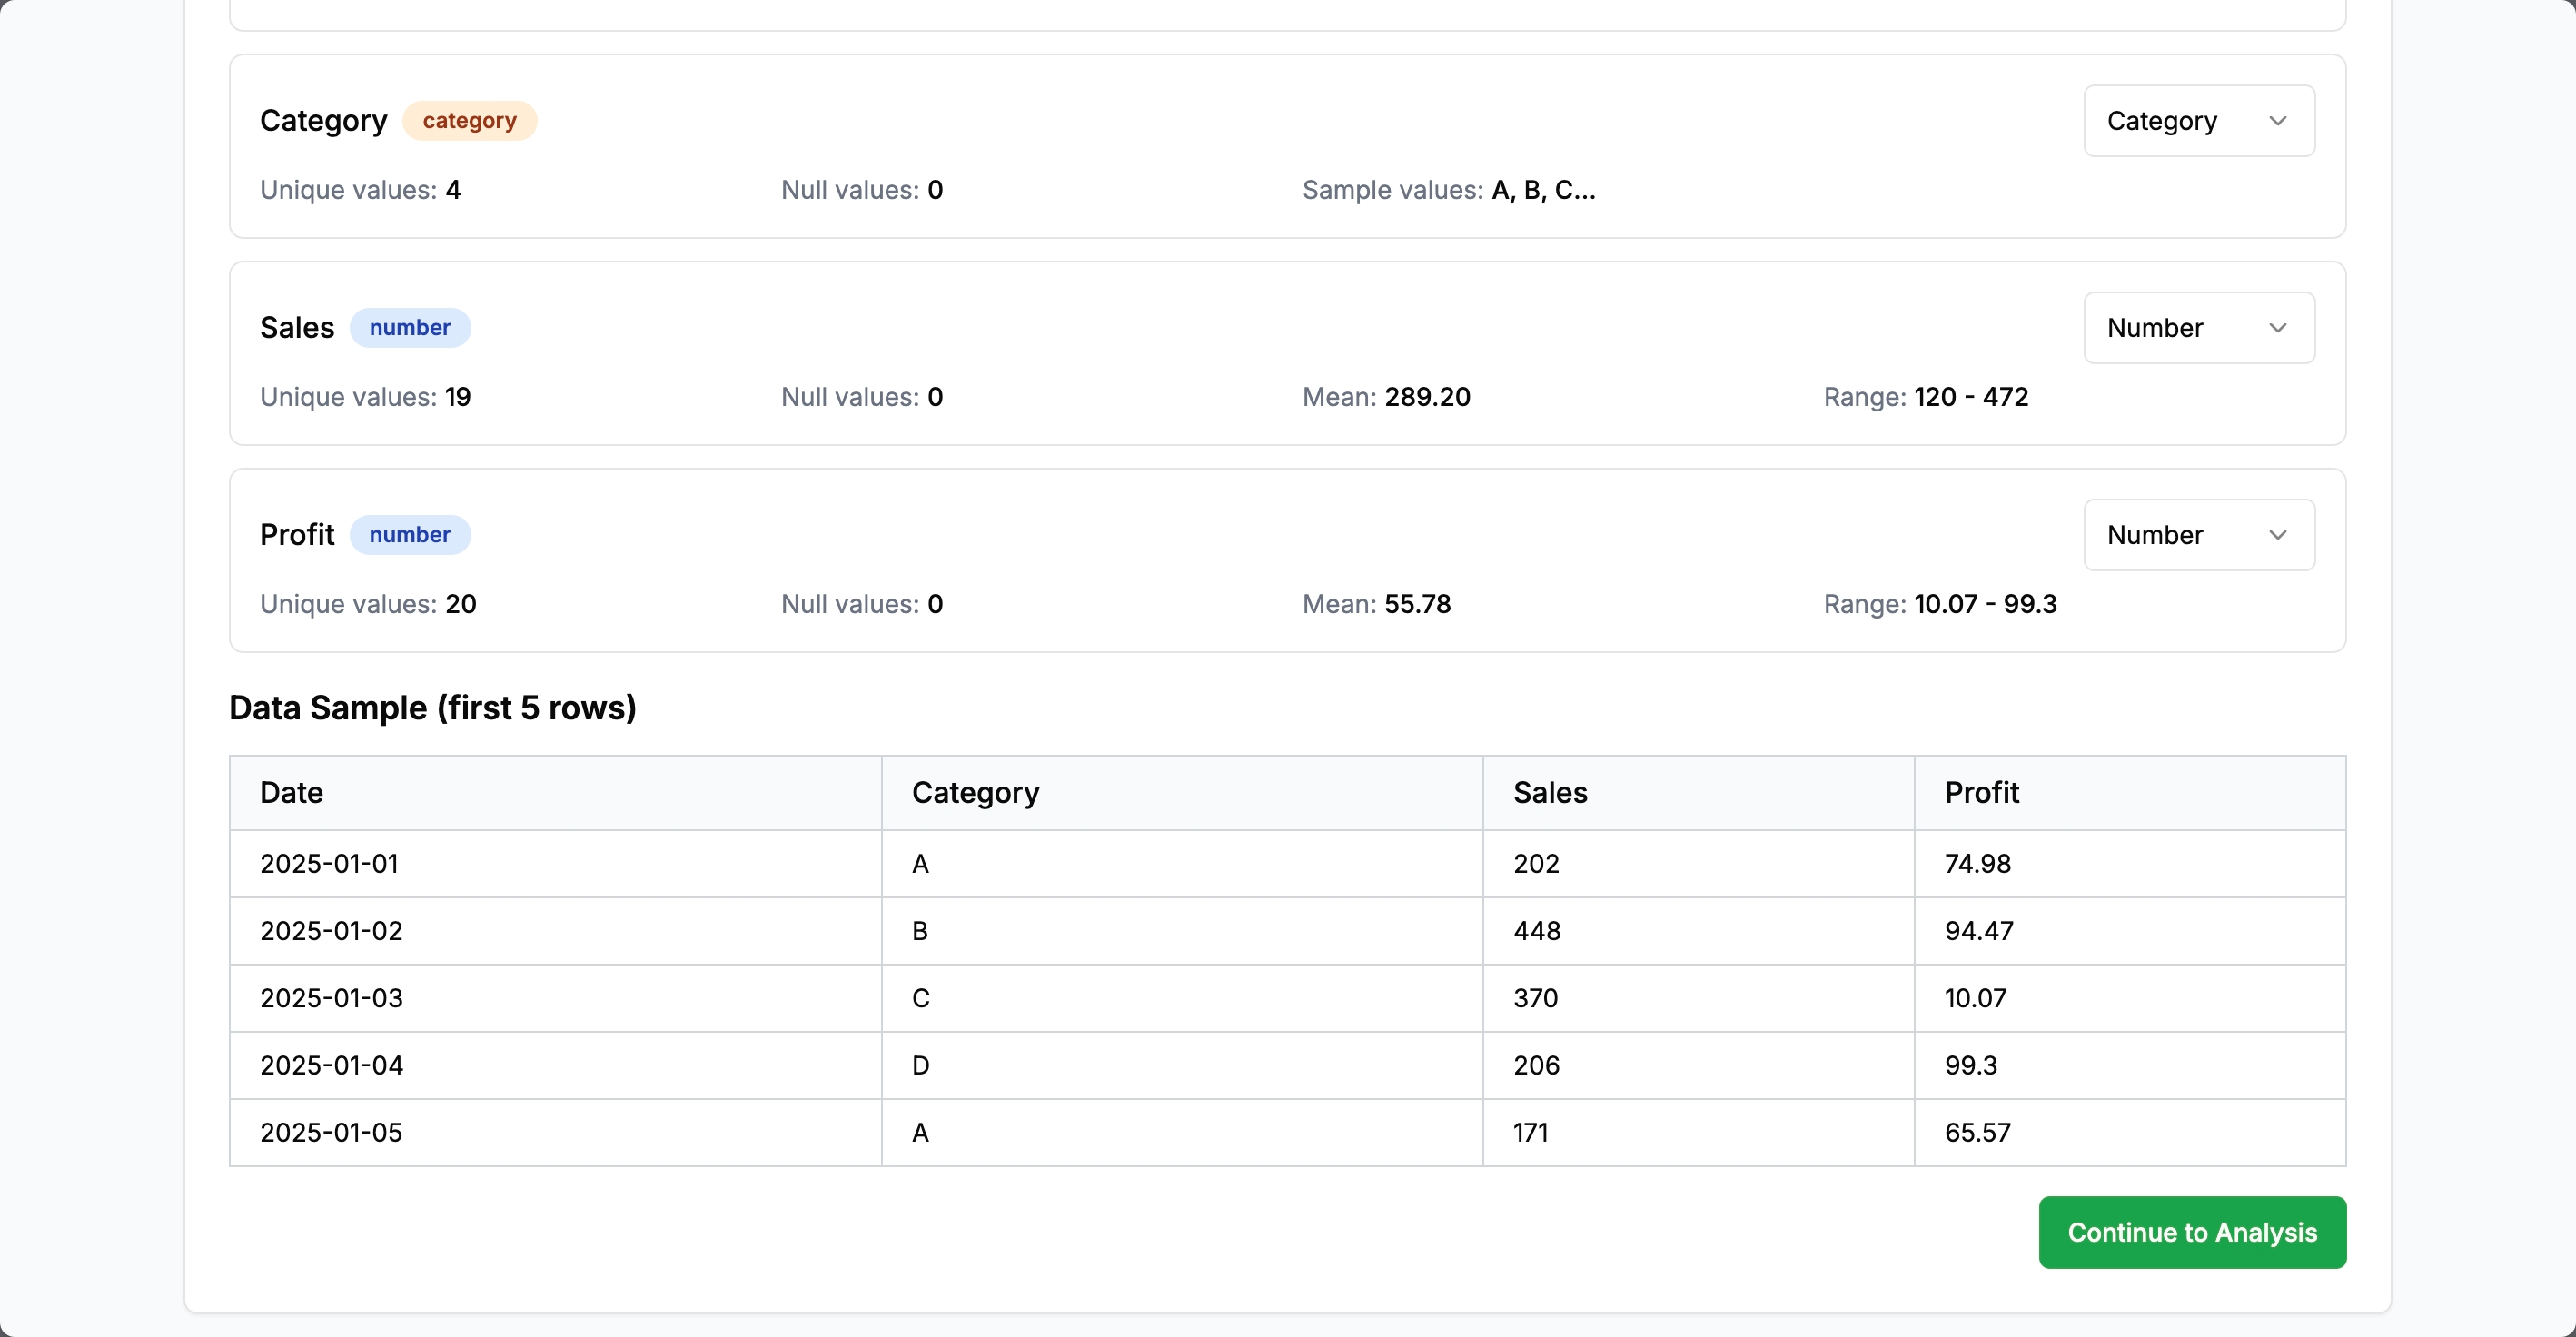
What it does
Csv Dashboard is a dynamic, client-side web application that lets users upload any CSV file and instantly generate interactive, multi-widget dashboards. It automatically detects column types, guides users through an analysis wizard, and suggests the best visualizations for their data. Users can add, remove, and rearrange chart widgets (line, bar, pie, scatter, heatmap, histogram, and more), configure each widget, and export the entire dashboard as an image or PDF. All processing happens in-memory, ensuring privacy and speed.
How we built it
We built Csv Dashboard using Next.js (App Router) and TypeScript for a modern, robust foundation. The UI leverages shadcn components and Tailwind CSS for a clean, responsive look with a green, black, and white theme. CSV parsing is handled by Papa Parse, with type inference and error handling. Recharts powers the dynamic chart widgets, and a chart component factory instantiates the right visualization based on user configuration. State is managed with React hooks, and data manipulation uses Lodash utilities. The analysis wizard is built with React Hook Form for a smooth, multi-step experience. All data stays client-side, with no database required.
Challenges we ran into
- Crafting a prompt that can encompass the overall context of the project and can execute it successfully.
Accomplishments that we're proud of
- Achieved universal CSV support with automatic type detection and correction.
- Built a dynamic, production-ready dashboard that supports any number of interactive widgets.
- Created a flexible analysis wizard that adapts to the uploaded data and user goals.
- Delivered a beautiful, modern UI that’s both powerful and easy to use.
- Ensured all data stays private and in-memory, with no server or database required.
- Enabled one-click export of the entire dashboard as an image or PDF.
What we learned
- The importance of robust data type inference and error handling in real-world CSV files.
- How to architect a truly dynamic dashboard system that adapts to arbitrary data.
- Advanced React patterns for managing complex, interactive UIs with real-time updates.
- Techniques for exporting complex React layouts as images/PDFs.
- The value of user-driven configuration and iterative refinement in analytics tools.
What's next for Csv dashboard
- Add support for more advanced statistical analyses and chart types.
- Enable saving and loading dashboard configurations locally or to the cloud.
- Integrate AI-powered insights and chart recommendations.
- Improve performance for very large datasets.
- Add collaborative features for sharing dashboards with others.
- Enhance accessibility and mobile responsiveness.
Built With
- bolt.new
- nextjs

Log in or sign up for Devpost to join the conversation.