Inspiration
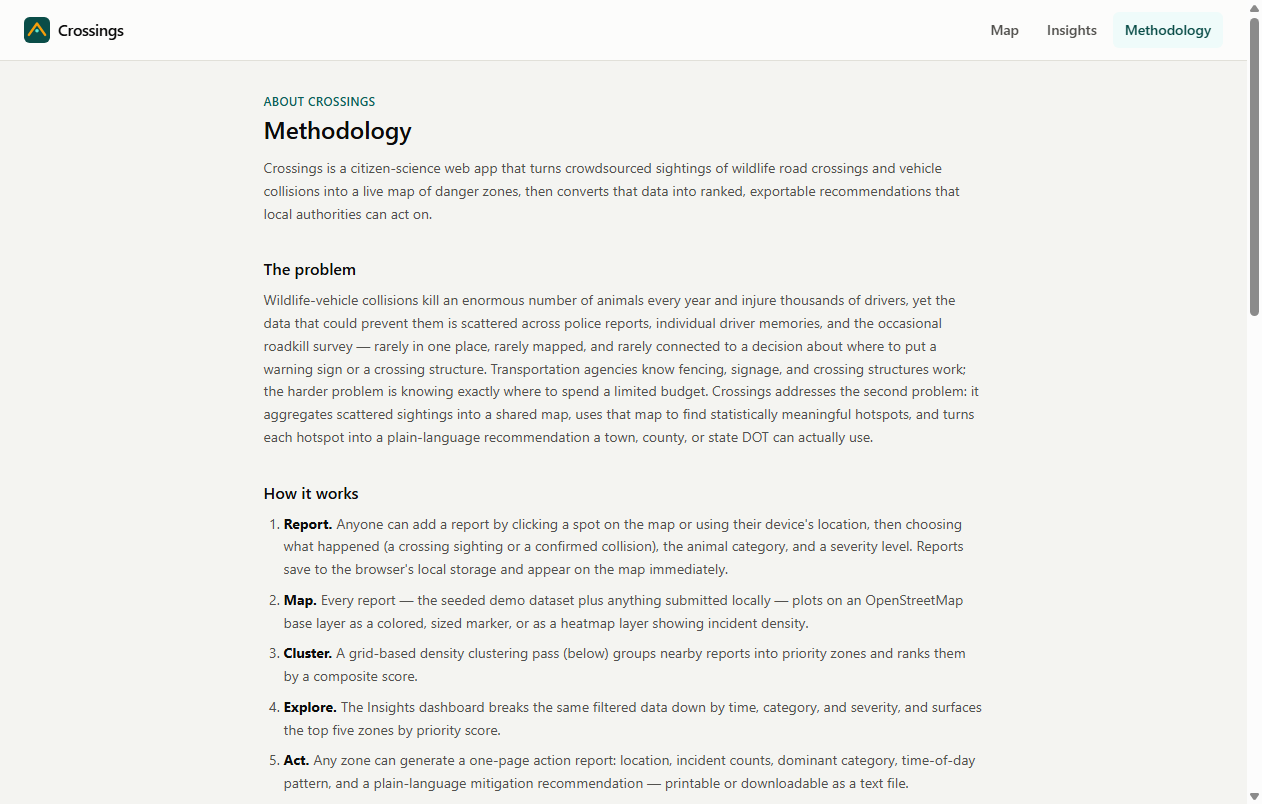
Wildlife-vehicle collisions kill an enormous number of animals every year and injure thousands of drivers, yet the data that could prevent them — police reports, individual driver memories, the occasional roadkill survey — is scattered, rarely mapped, and rarely connected to a decision about where to spend a limited road-safety budget. Transportation agencies know fencing, signage, and crossing structures work; the hard part is knowing exactly where to put them. We wanted to build the tool that closes that gap: a shared map that turns individual sightings and collisions into a ranked, evidence-based case for action.
What it does
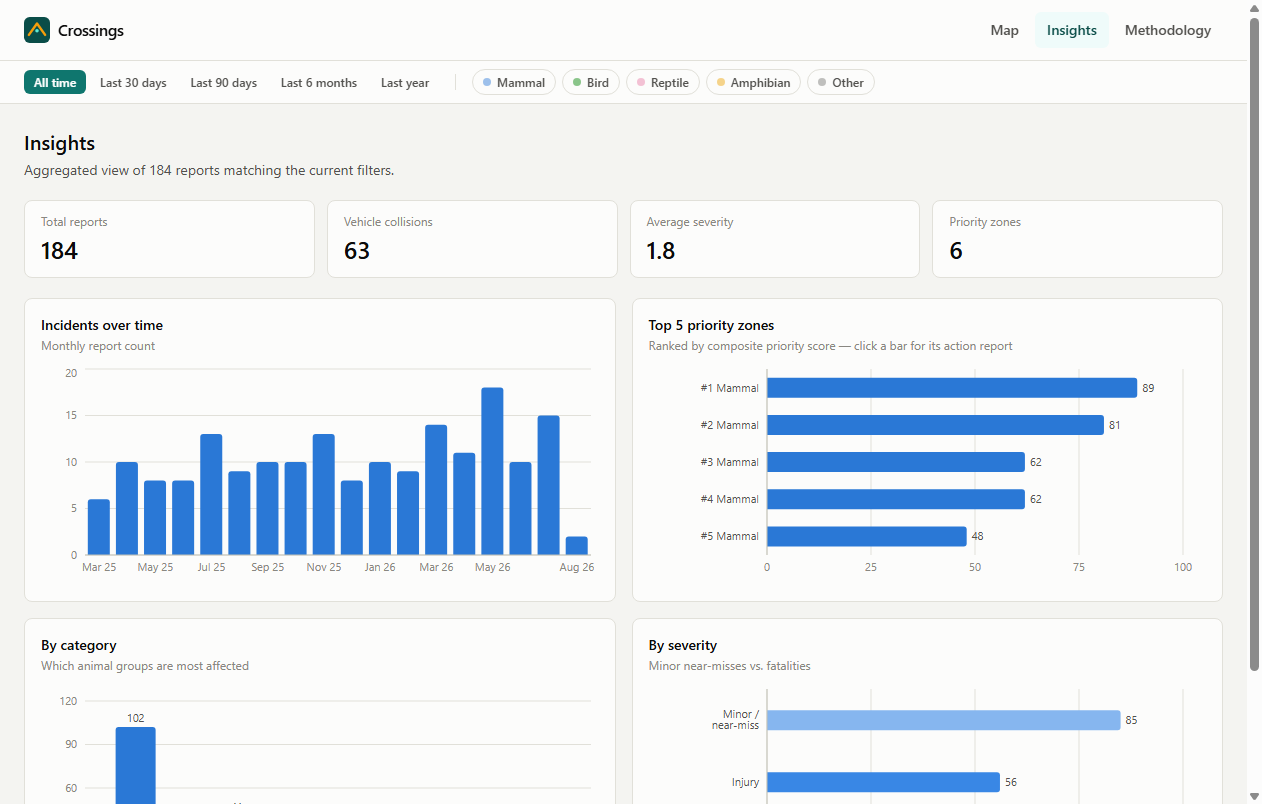
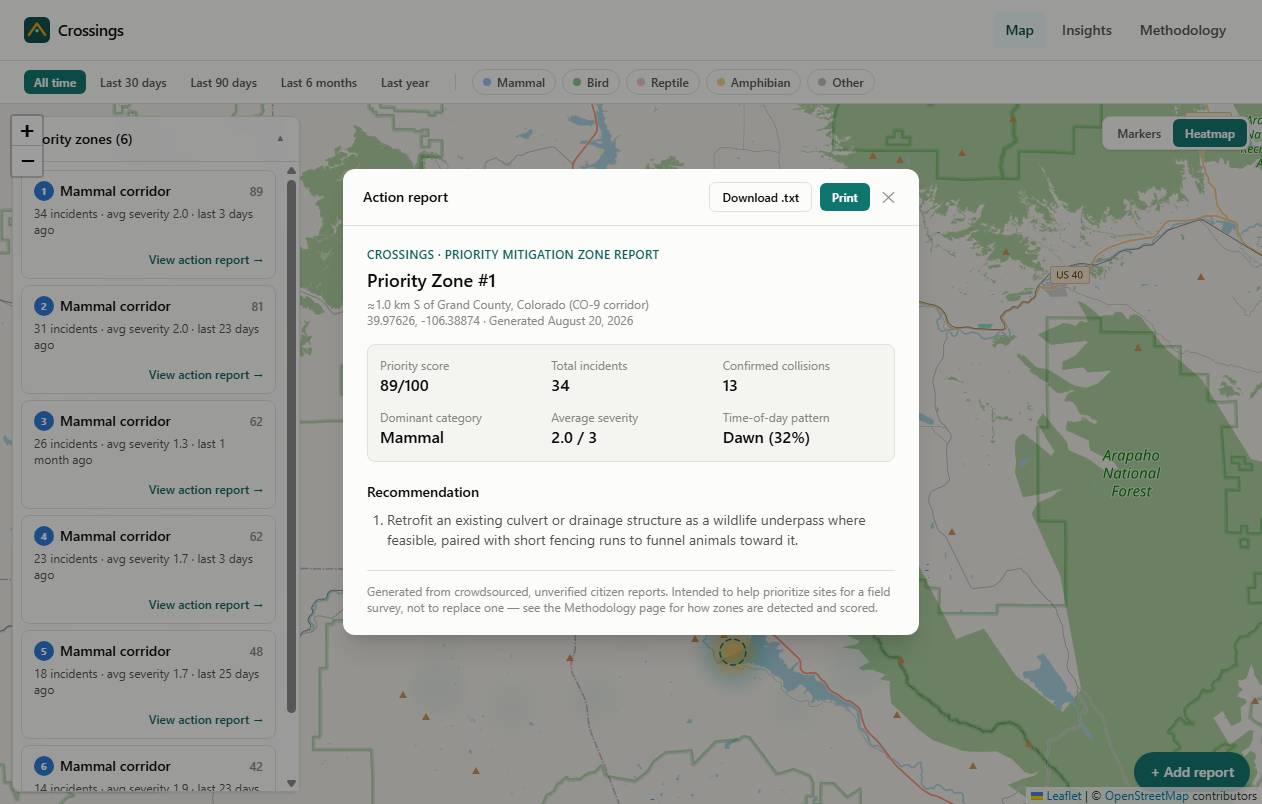
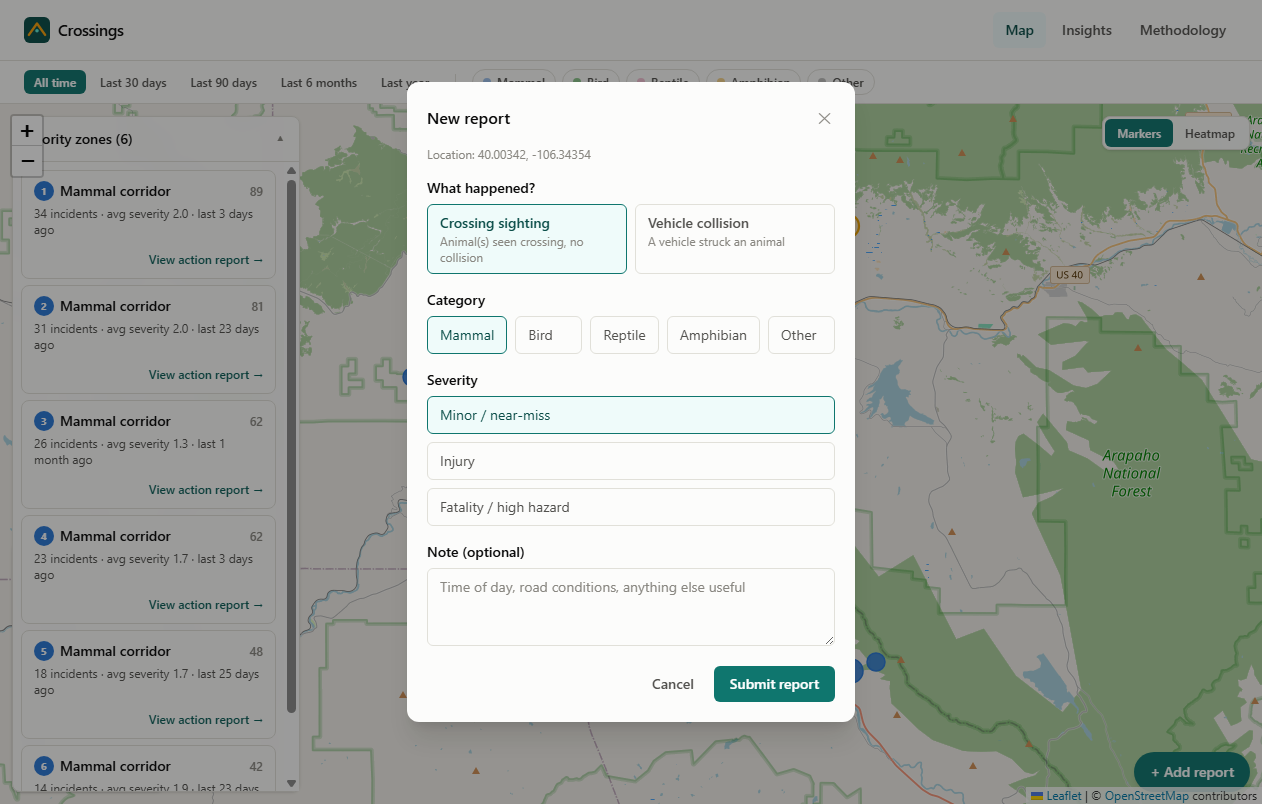
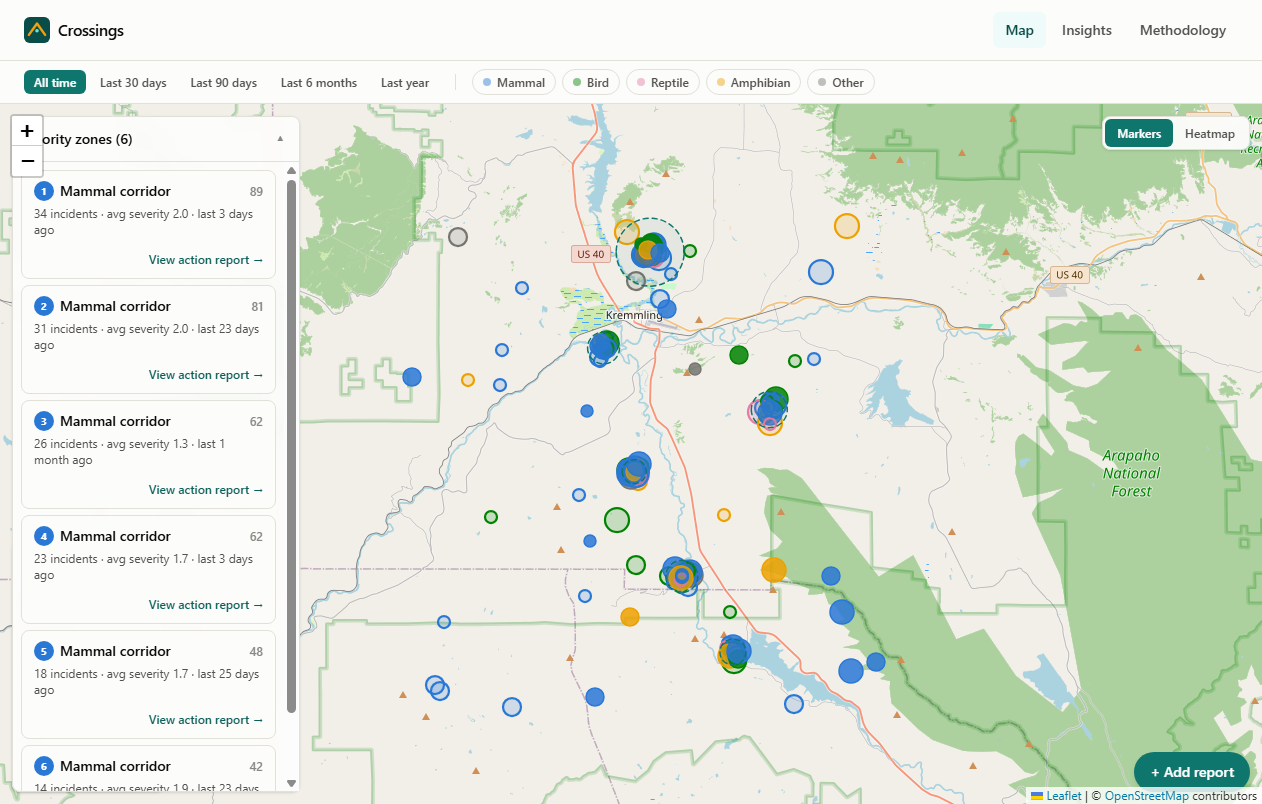
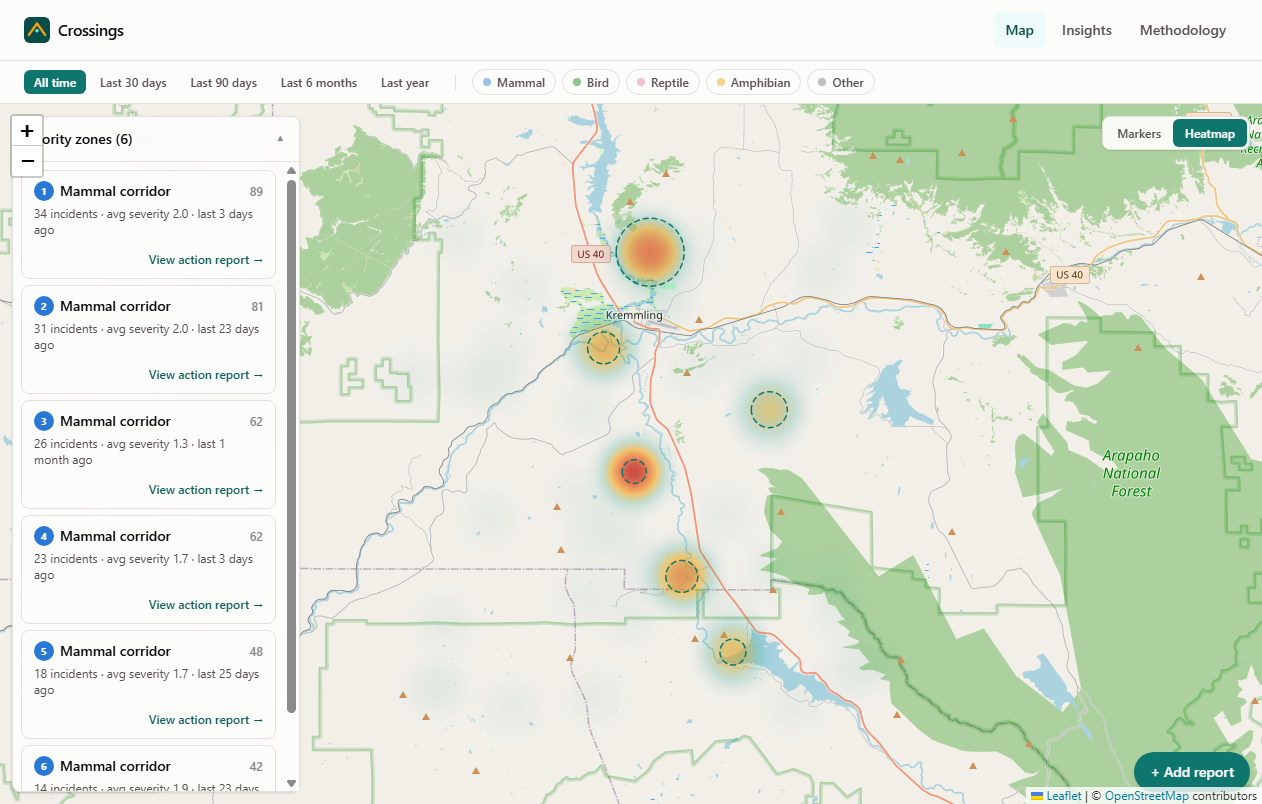
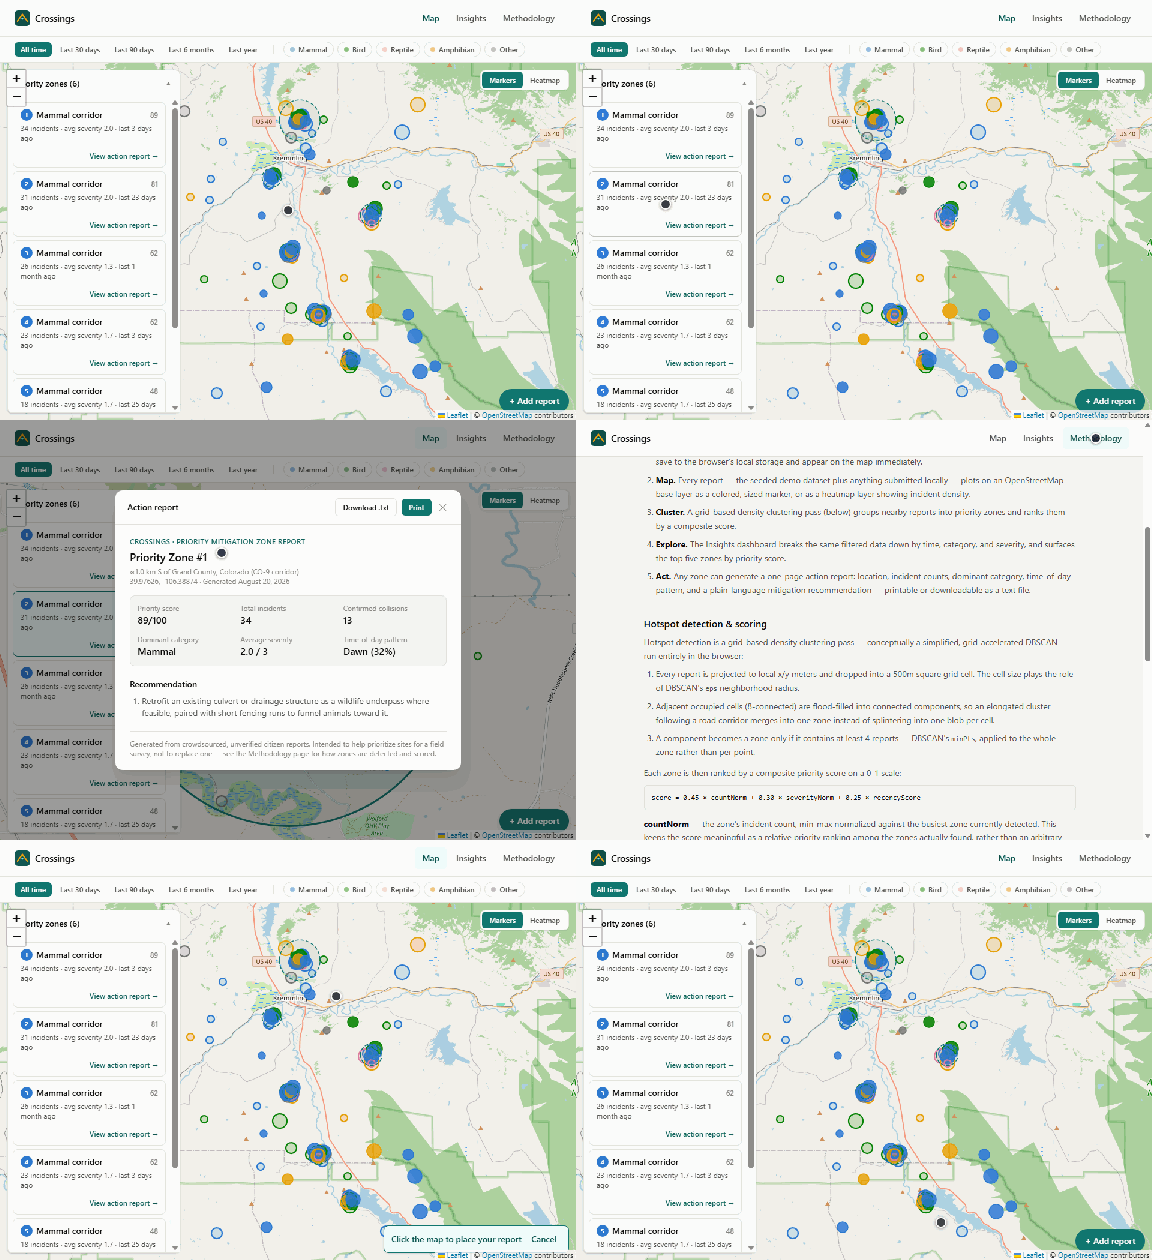
Crossings is a citizen-science web app for wildlife road-crossing and collision reporting. Anyone can drop a report by clicking the map or using their device's location, choosing what happened (a sighting or a confirmed collision), the animal category, and a severity level. Every report — seed data plus anything submitted locally — plots on a live map as markers or a density heatmap. A grid-based clustering pass groups nearby reports into priority zones and ranks them with a transparent composite score (incident count, average severity, and recency). An Insights dashboard breaks the same filtered data down by time, category, and severity, and any priority zone can generate a one-page, printable action report with a plain-language mitigation recommendation that a town, county, or state DOT could actually use.
How we built it
Vite + React + TypeScript for the app shell, Tailwind CSS for a civic-tech/data-dashboard visual language, Leaflet + react-leaflet with OpenStreetMap tiles and leaflet.heat for the map and heatmap layer, Recharts for the dashboard, Framer Motion for modal transitions, and React Router for client-side navigation between the Map, Insights, and Methodology pages. There's no custom backend — everything (clustering, scoring, filtering, chart aggregation) runs client-side, and user-submitted reports persist in localStorage. The app ships with a deterministic, seeded synthetic dataset (~184 reports) centered on a real wildlife-vehicle collision corridor in Grand County, Colorado, so the map and hotspot detection have something realistic to find on first load.
Challenges we ran into
Getting hotspot detection to feel like a real analysis rather than an arbitrary visual grouping took the most iteration — we landed on a grid-accelerated, DBSCAN-inspired flood-fill so an elongated cluster following a road corridor merges into one zone instead of splintering into one blob per grid cell, and documented the exact scoring formula so it's auditable rather than a black box. We also made a deliberate visual-design constraint for ourselves: no animal imagery anywhere in the app, so every risk signal had to be communicated through color, size, and density alone.
What we learned
A few charts and a map aren't enough to be useful to a decision-maker — the thing that makes hotspot data actionable is a concrete, exportable recommendation attached to it. Designing the scoring formula also taught us how much a single weighting choice (how much recency should matter vs. raw incident count) changes which zones get flagged first, which is why we exposed the formula and its reasoning on the app's own Methodology page instead of hiding it.
What's next for Crossings
Move from crowdsourced-and-unverified reports to a shared backend so submissions aggregate across users and devices instead of staying local to one browser, add photo attachments to reports for verification, and pilot the action-report export with an actual local wildlife or transportation agency to see whether the recommendation format is genuinely useful in the field.
Built With
- framer-motion
- leaflet.js
- openstreetmap
- react
- react-leaflet
- react-router
- recharts
- tailwind-css
- typescript
- vercel
- vite

Log in or sign up for Devpost to join the conversation.