Inspiration
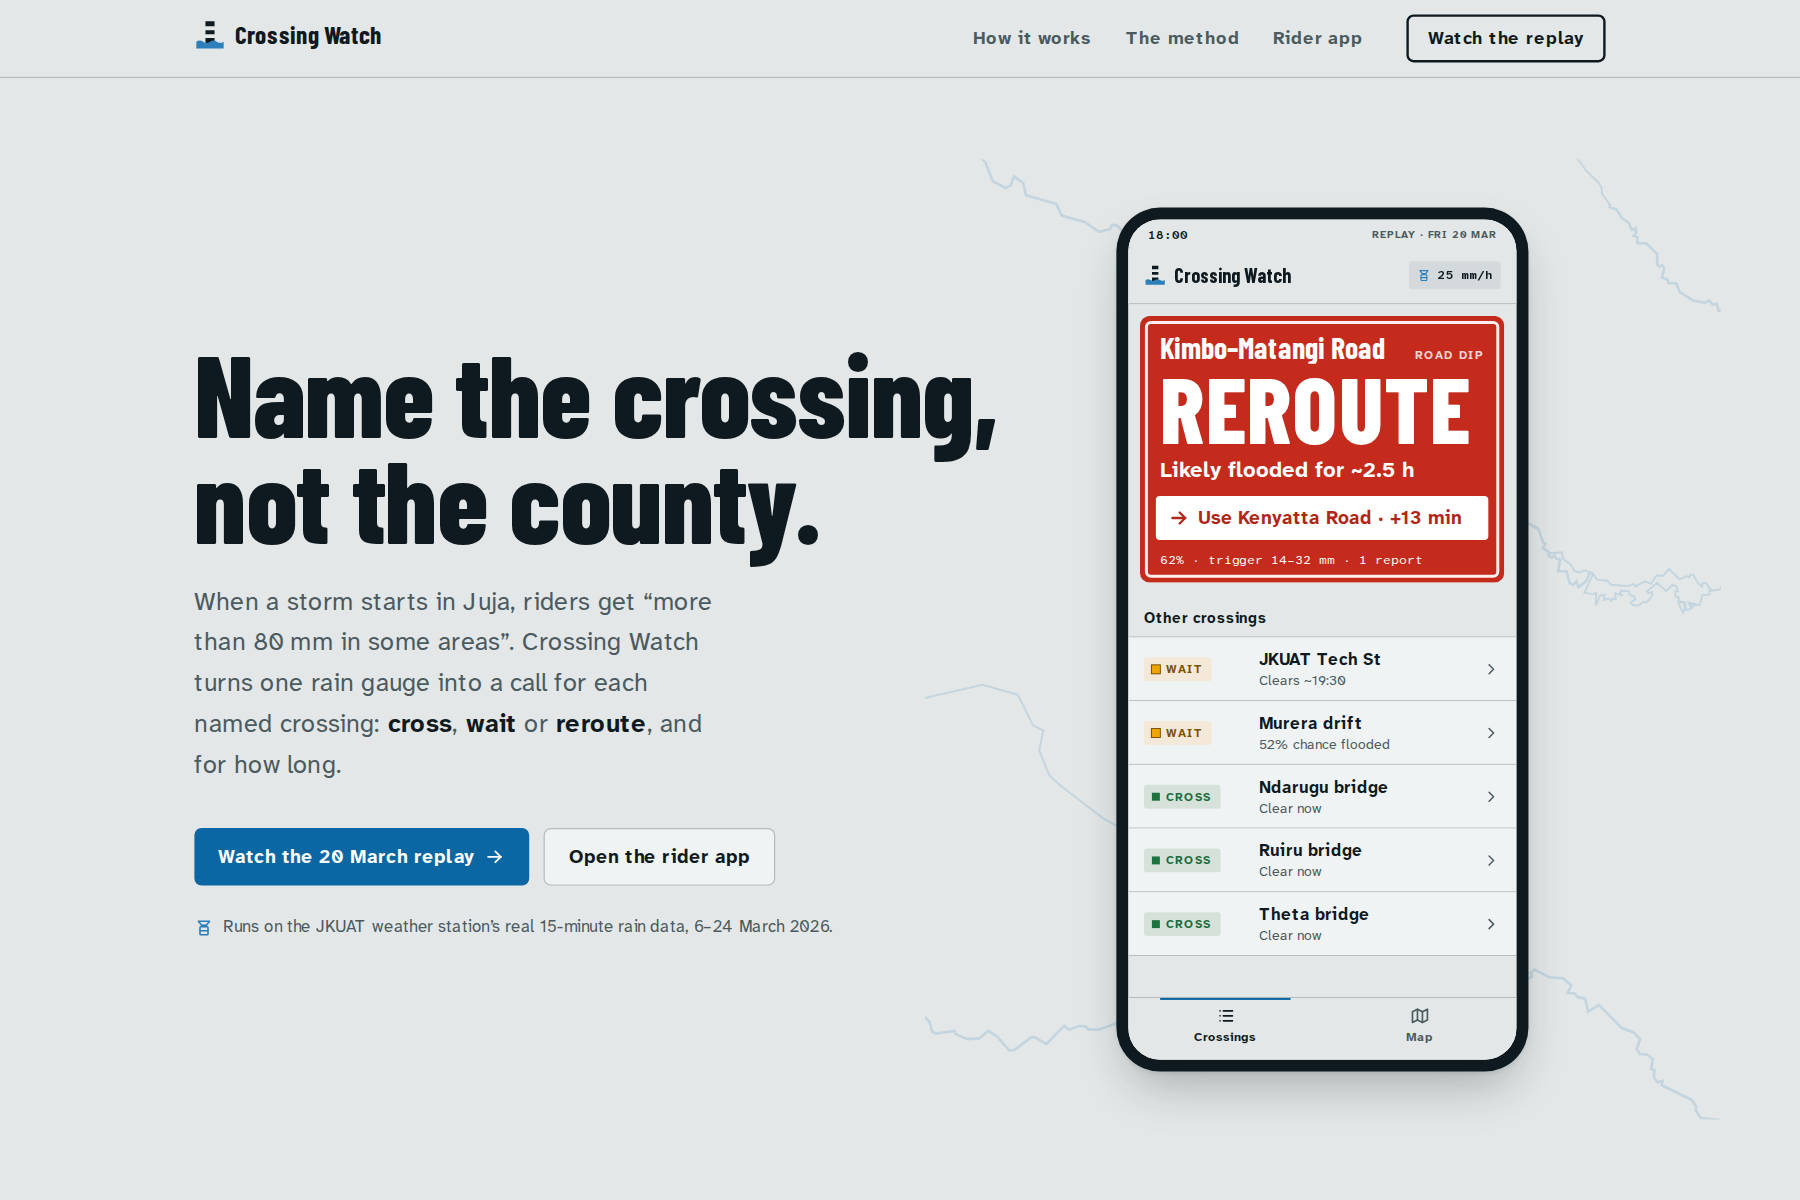
On 7 March 2026, Kenya Met warned of rain "more than 80 mm in some areas, including Thika, Juja, Ruiru". It named no road, no crossing and no hour. Two days later, The Star photographed people wading through Kimbo–Matangi Road in Juja. On 28 April the same road flooded again, and "boda boda riders also struggled to pass".
Boda riders, commuters and JKUAT students don't need a county-wide forecast. They need to know whether the dip or bridge in front of them is passable now, and for how long. The data to answer that already exists: the Conduit@Empathy weather station on the JKUAT campus reports every 15 minutes. Nobody was turning it into a call for a named crossing.
What it does
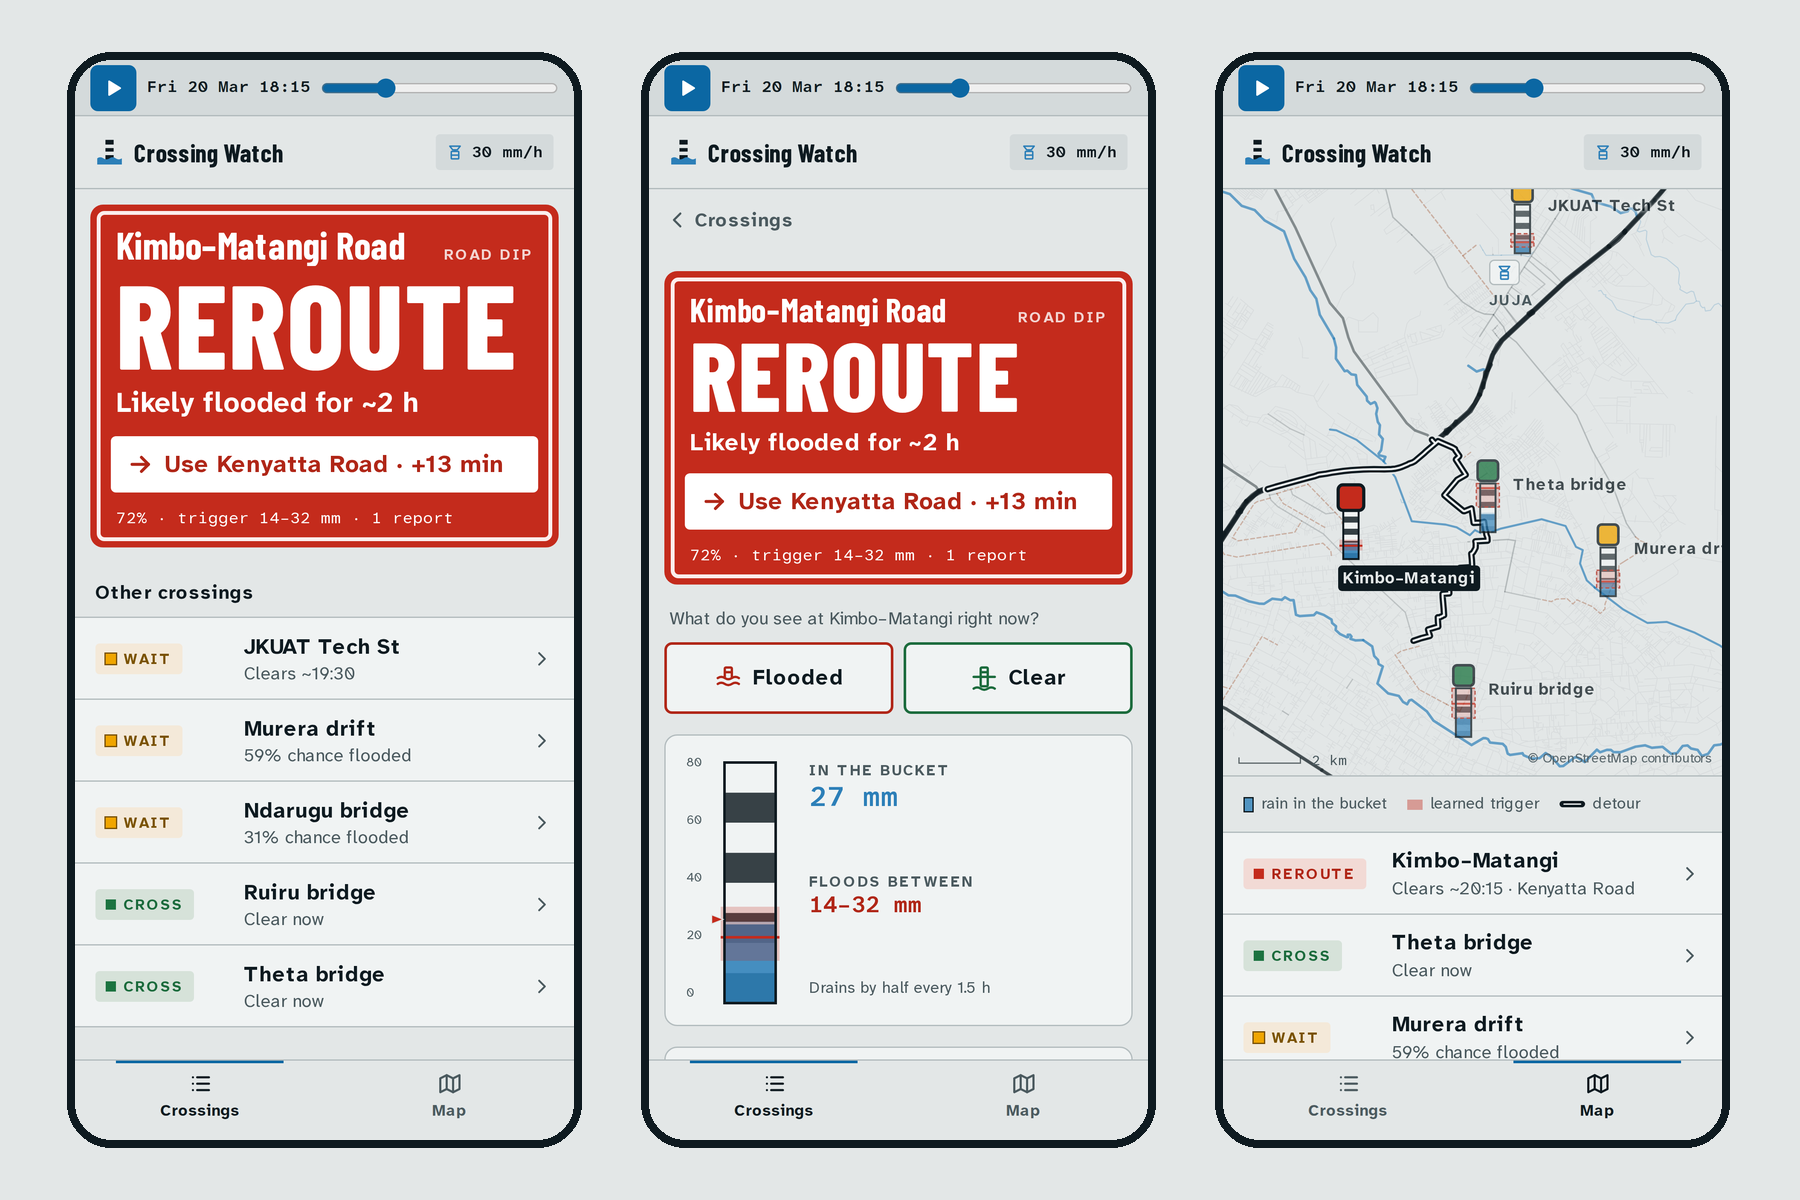
Crossing Watch gives each named crossing around Juja one of four calls:
- CROSS
- WAIT
- REROUTE, with a detour and its extra minutes
- NO CALL, when the gauge is silent
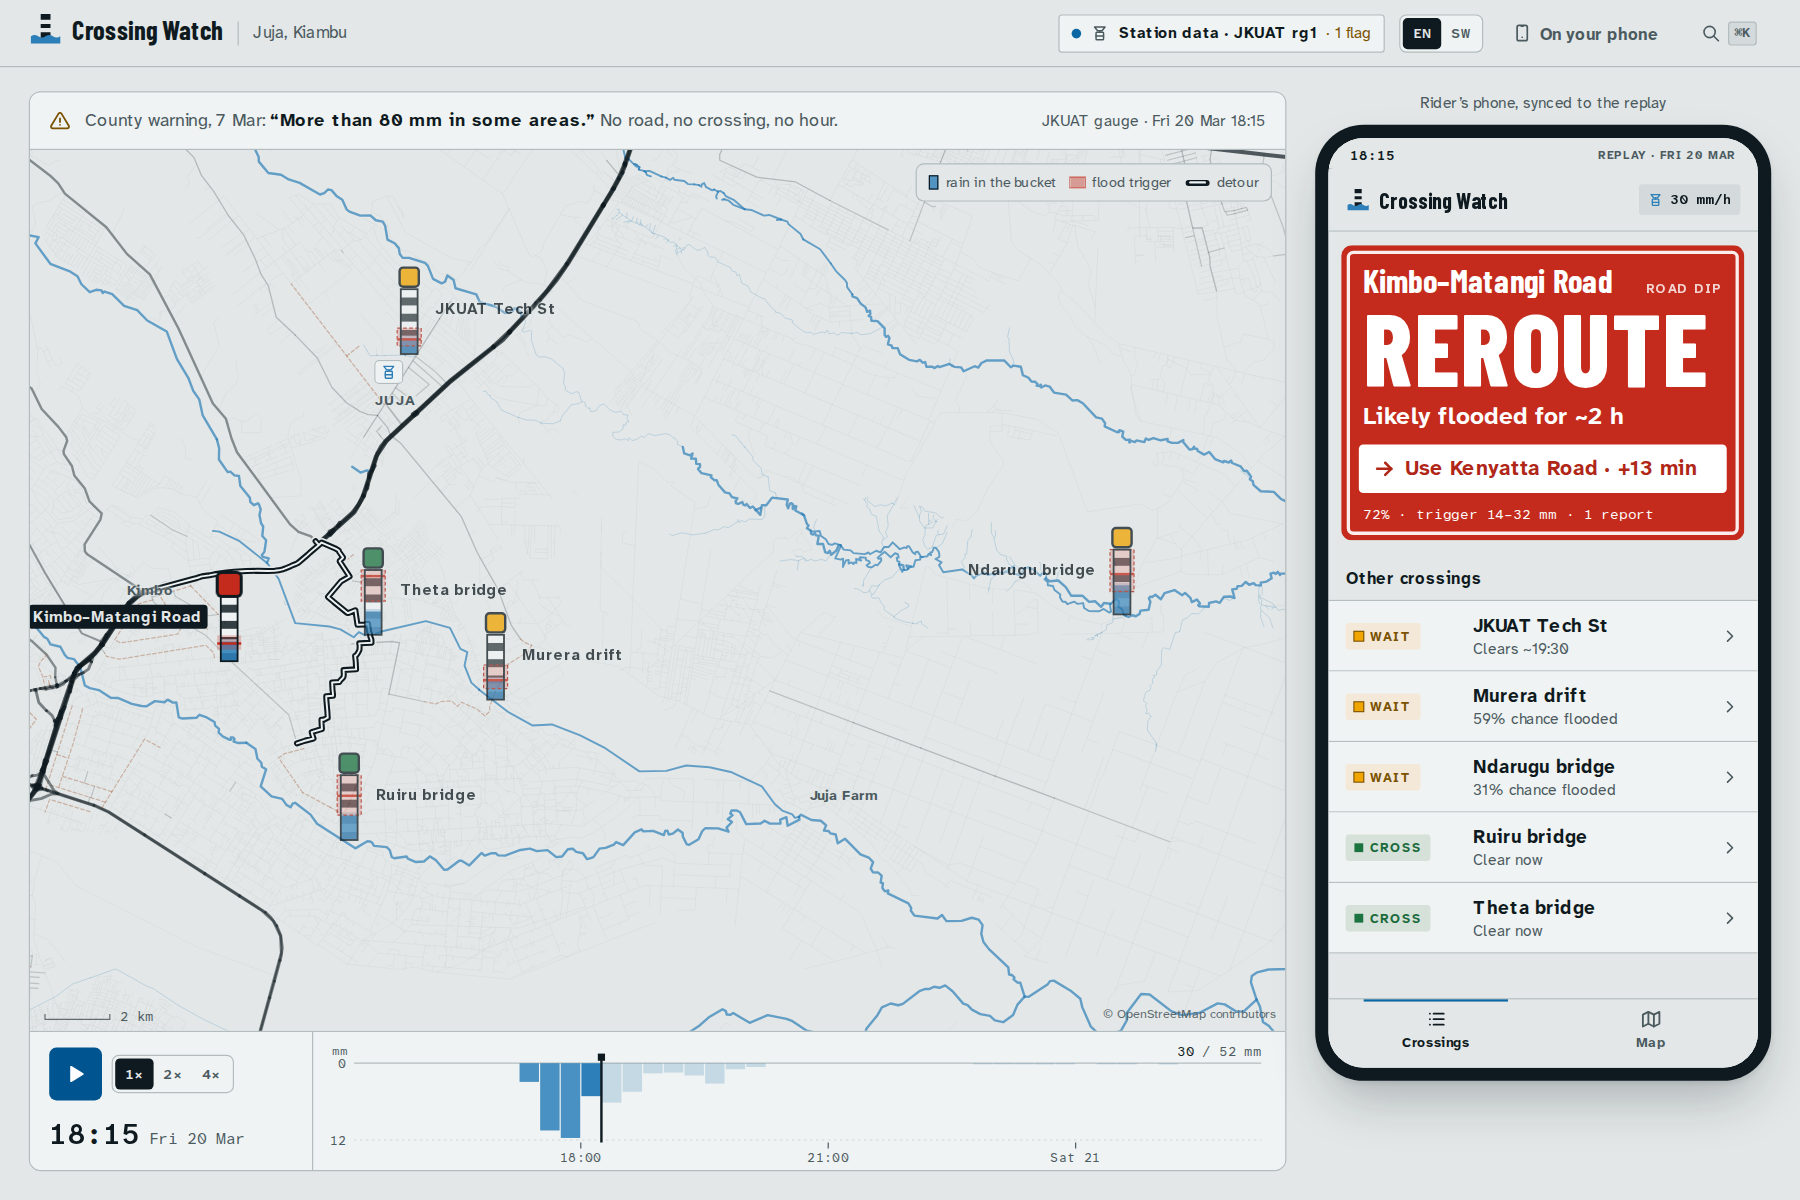
It says for how long: "Kimbo–Matangi Road: likely flooded until about 20:15. Use Kenyatta Road · +13 min."
- A rider app in English and Kiswahili shows the call and why, with a one-tap Flooded / Clear report.
- One button sends the call to a boda stage's WhatsApp group.
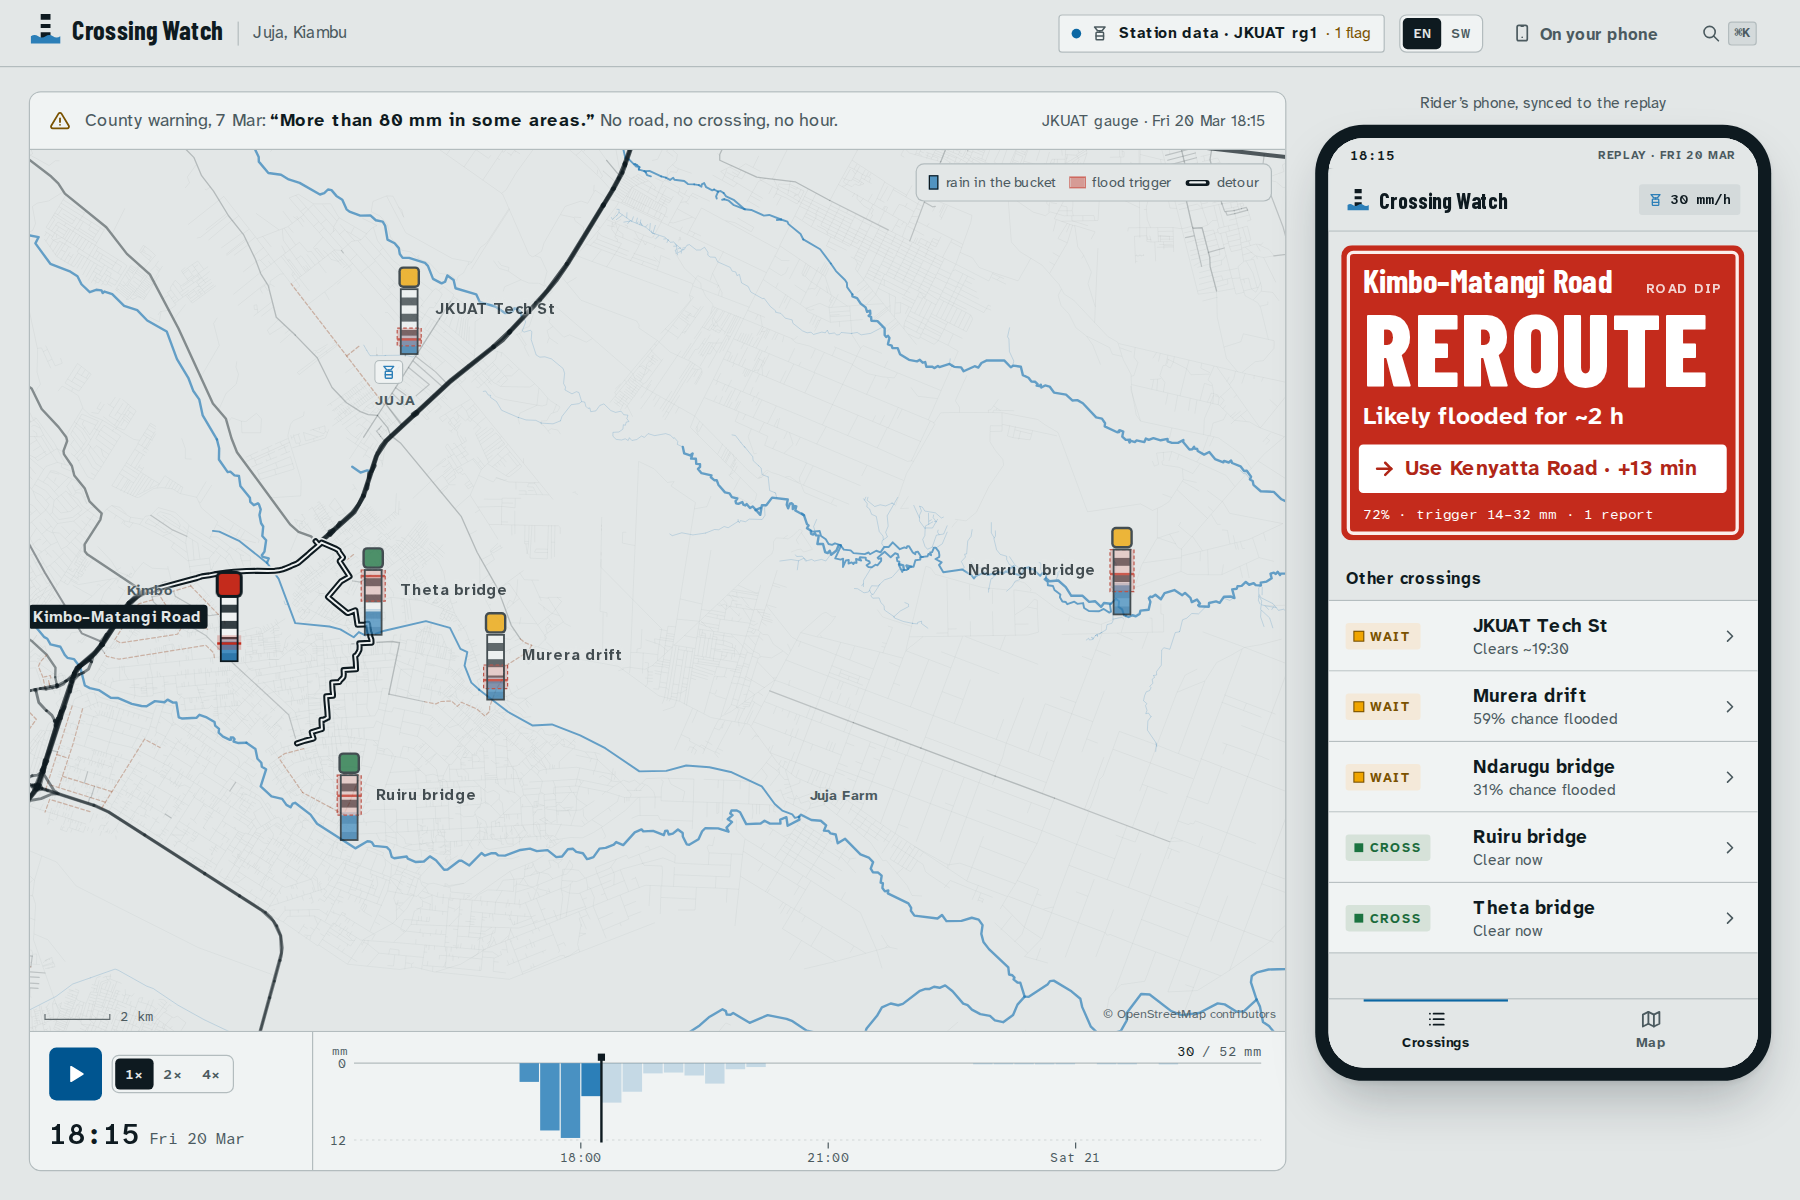
- A replay runs the real 20 March 2026 storm from the JKUAT gauge, 15 minutes at a time.
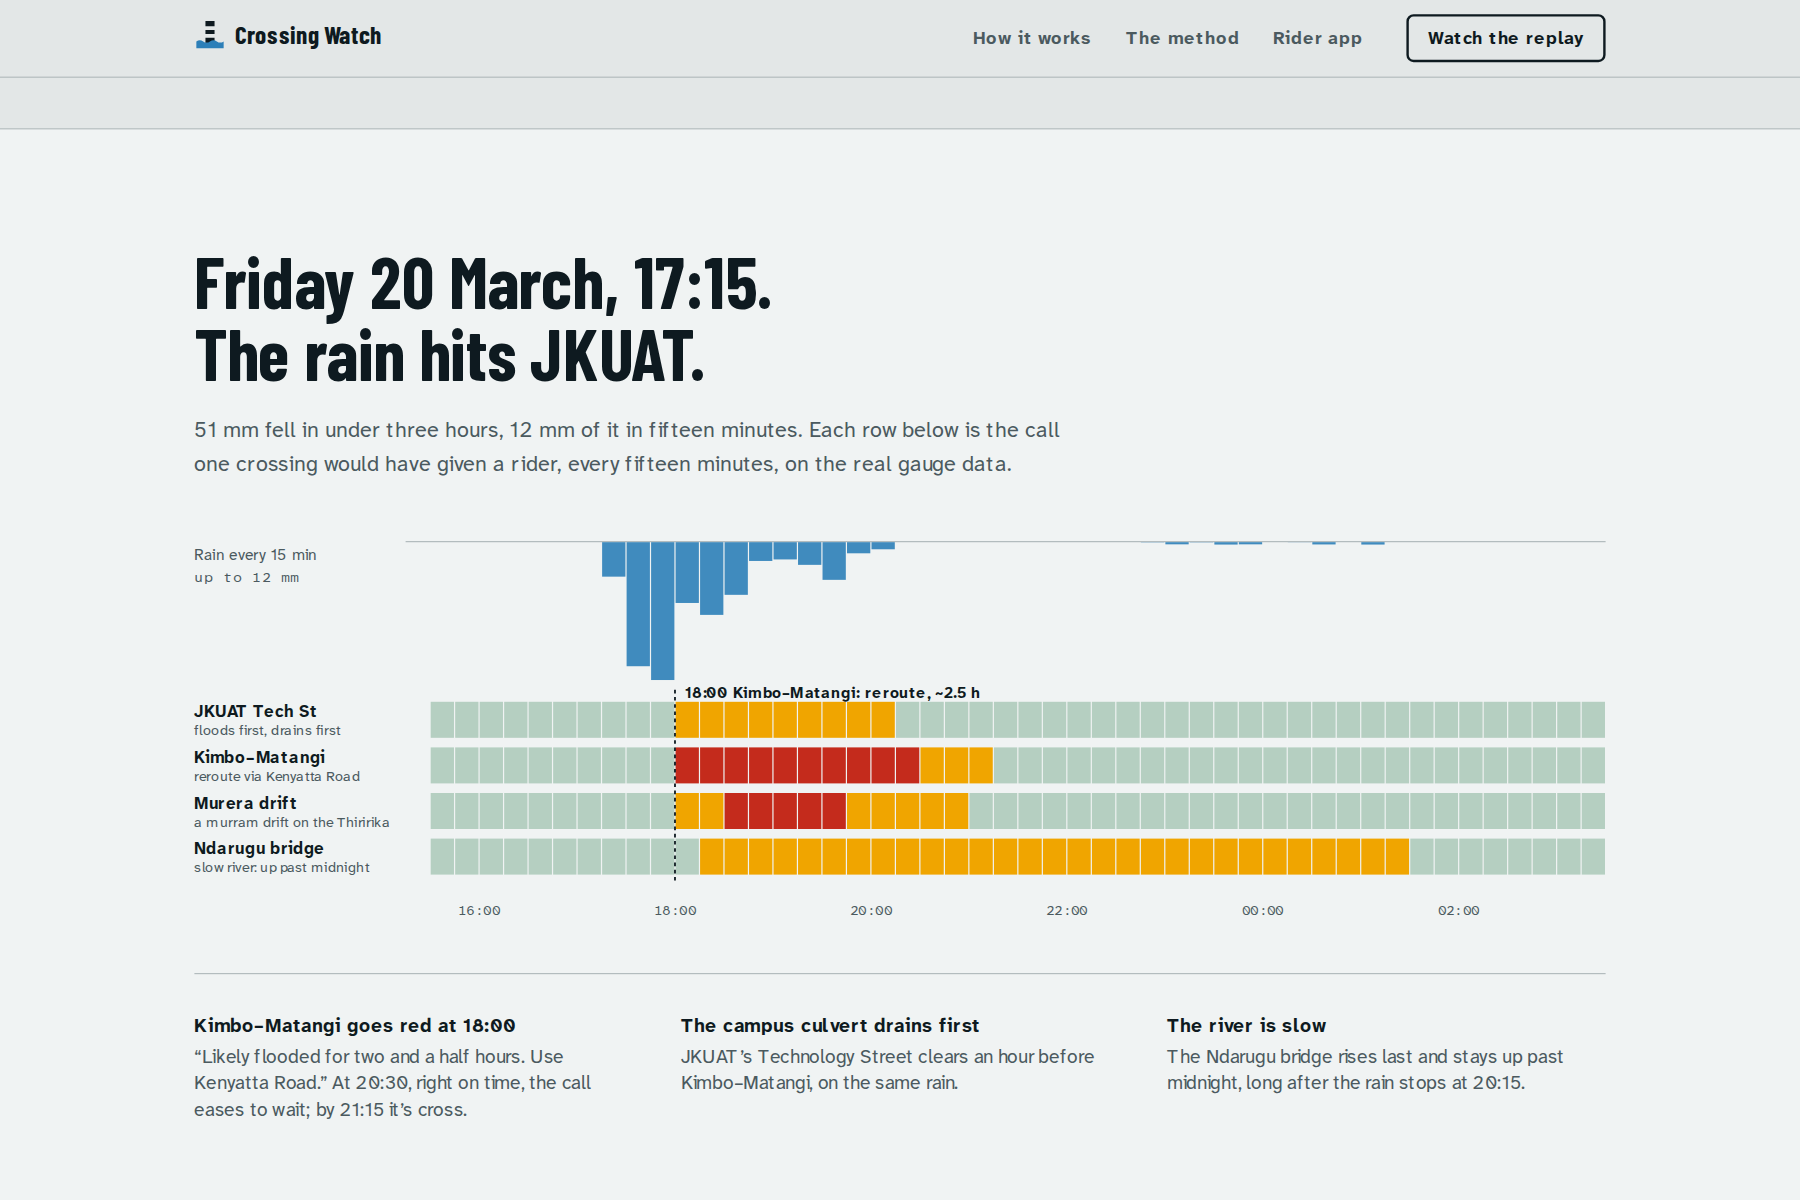
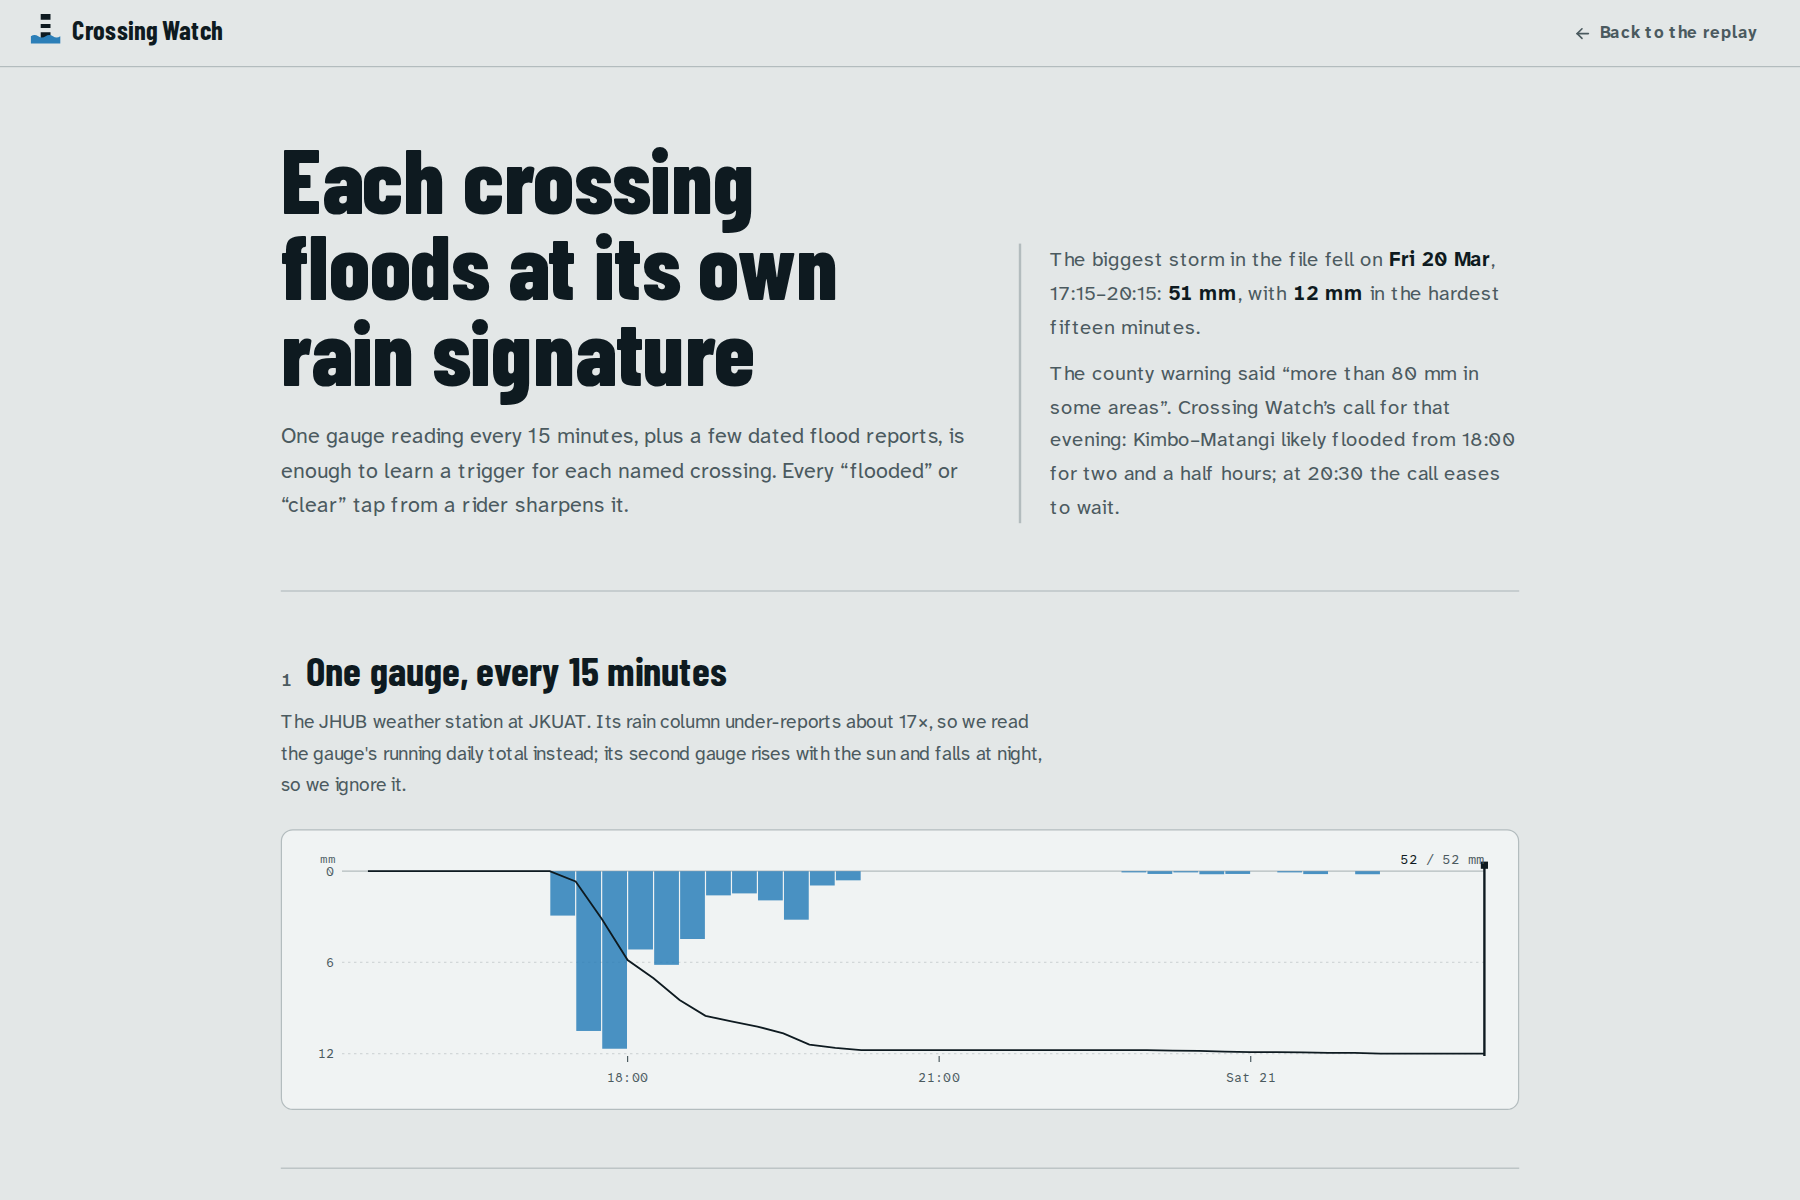
That storm dropped 50.6 mm between 17:15 and 20:00. Kimbo–Matangi turns REROUTE at 18:00 for about 2½ hours, eases to WAIT at 20:30 and CROSS at 21:15. The campus culvert on Technology Street clears at 20:15, while the Ndarugu river bridge stays flooded until 01:30.
How we built it
The model is small and explainable, with no machine learning and no LLM. It's plain TypeScript and runs in the browser.
Each crossing has a "bucket" that rain fills and that drains at the crossing's own half-life \( h \): 45 minutes for a campus culvert, 10 hours for a river bridge. With \( r_t \) the rain in each 15-minute step:
$$S_t = k\,S_{t-1} + r_t, \qquad k = 0.5^{\,0.25/h}$$
A crossing floods when its bucket passes a trigger \( \theta \) that we don't know. We keep a full distribution over \( \theta \) from 2 to 150 mm, starting from a log-normal guess for the crossing type. Every dated report updates it, whether it's a news story or a rider's tap:
$$P(\text{flooded} \mid S, \theta) = \varepsilon + (1 - 2\varepsilon)\,\sigma!\left(\frac{S - \theta}{\tau(\theta)}\right)$$
$$p(\theta \mid \text{reports}) \propto p(\theta) \prod_i P\big(y_i \mid S_{t_i}, \theta\big)^{w_i}$$
Here \( \varepsilon = 0.03 \) allows for wrong reports, and a rider's tap has weight \( w = 0.8 \).
The call comes from the flood probability averaged over \( \theta \):
- 60% or more: flooded. It's REROUTE if the detour is clear and the flood will outlast the detour's extra minutes; otherwise it's WAIT.
- 30–60%: WAIT.
- Below 30%: CROSS.
A simple nowcast projects when a crossing will clear: the last 30 minutes of rain, fading with a 30-minute half-life. Safety rules sit on top:
- a silent gauge gives NO CALL, never CROSS;
- a flood report in the last 30 minutes means at least WAIT;
- an improving call must hold for two steps before the sign changes.
The data has three sources:
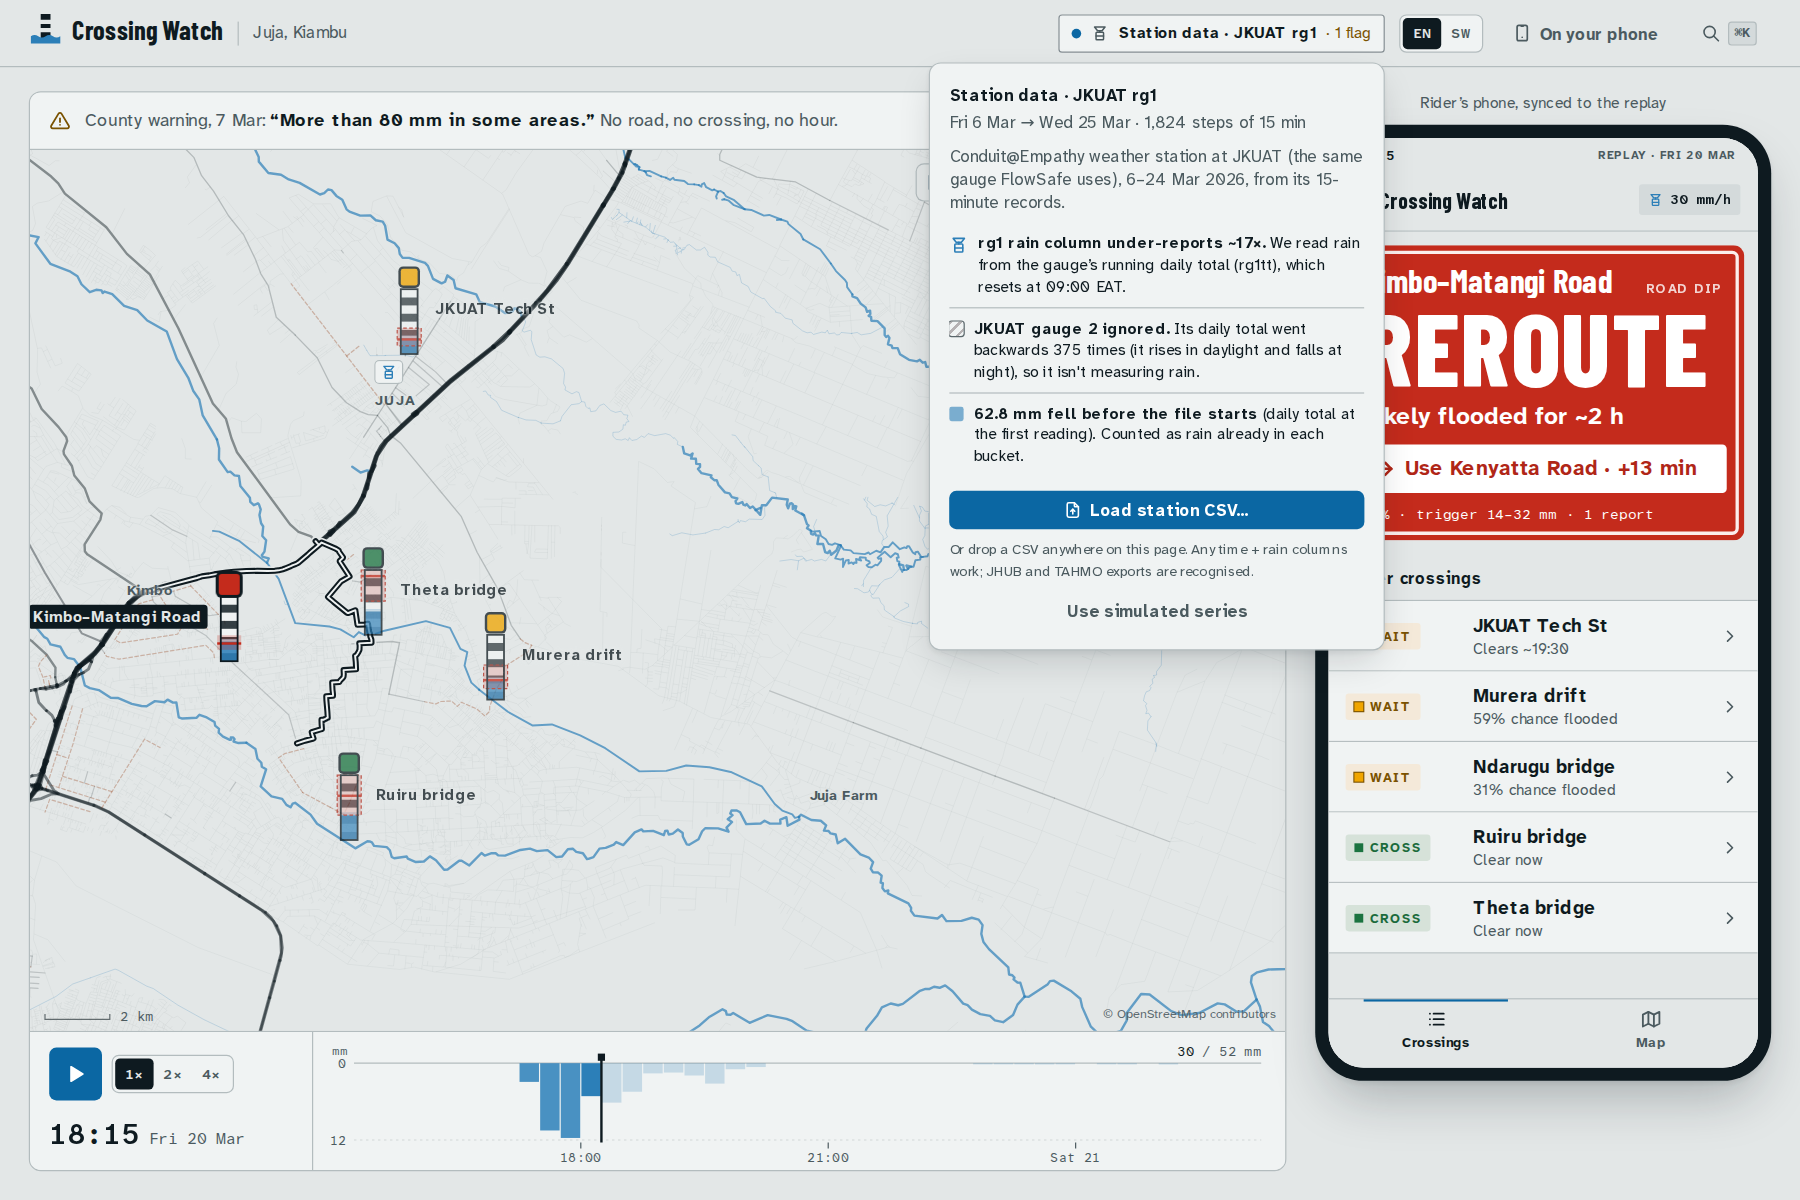
- Rain comes from the Conduit@Empathy station at JKUAT, pulled from the Conduit API: 6–24 March and 18–30 April 2026.
- Flood reports come from dated news (The Star, 9 March) and rider taps.
- The map comes from OpenStreetMap via Overpass, drawn as an SVG basemap. Detours are Dijkstra shortest paths at boda speed (about 25 km/h) that avoid the flooded spot.
The app is built with Next.js 16, React 19, Tailwind 4 and Motion, and deployed on Vercel. 14 unit tests and 21 end-to-end checks (npm run verify) run on every push in GitHub Actions.
Challenges we ran into
- The rain column under-reports. The station's
rg1column adds up to 10.6 mm over our March file, but its running daily total says 179.4 mm.rg1only holds the one minute sampled in each 15-minute record. We read rain from the increments of the daily total (rg1tt) instead, which resets at 06:00 UTC. - Gauge 2 isn't a rain gauge. Its "daily total" went backwards 375 times, rising in daylight and falling at night. It matches the light sensor at \( r = 0.9999 \). The parser detects this from the backward moves alone and never uses it.
- Local geography. Our first detour was "Theta Road", but no road goes by that name: locals call Kimbo–Matangi itself the Theta road. Our route also ran through the very spot residents had reported impassable. The detour now leaves the road entirely, via Kenyatta Road and the Theta bridge, and is only offered while that bridge is clear.
- One gauge, very few reports. With a single station and a single dated flood report, a trained classifier would overfit. The Bayesian trigger starts from a sensible guess, shows its uncertainty as a band, and gets sharper with every tap. One "Flooded" tap at the Ndarugu bridge narrows its trigger from 28–88 mm to 25–57 mm.
Accomplishments that we're proud of
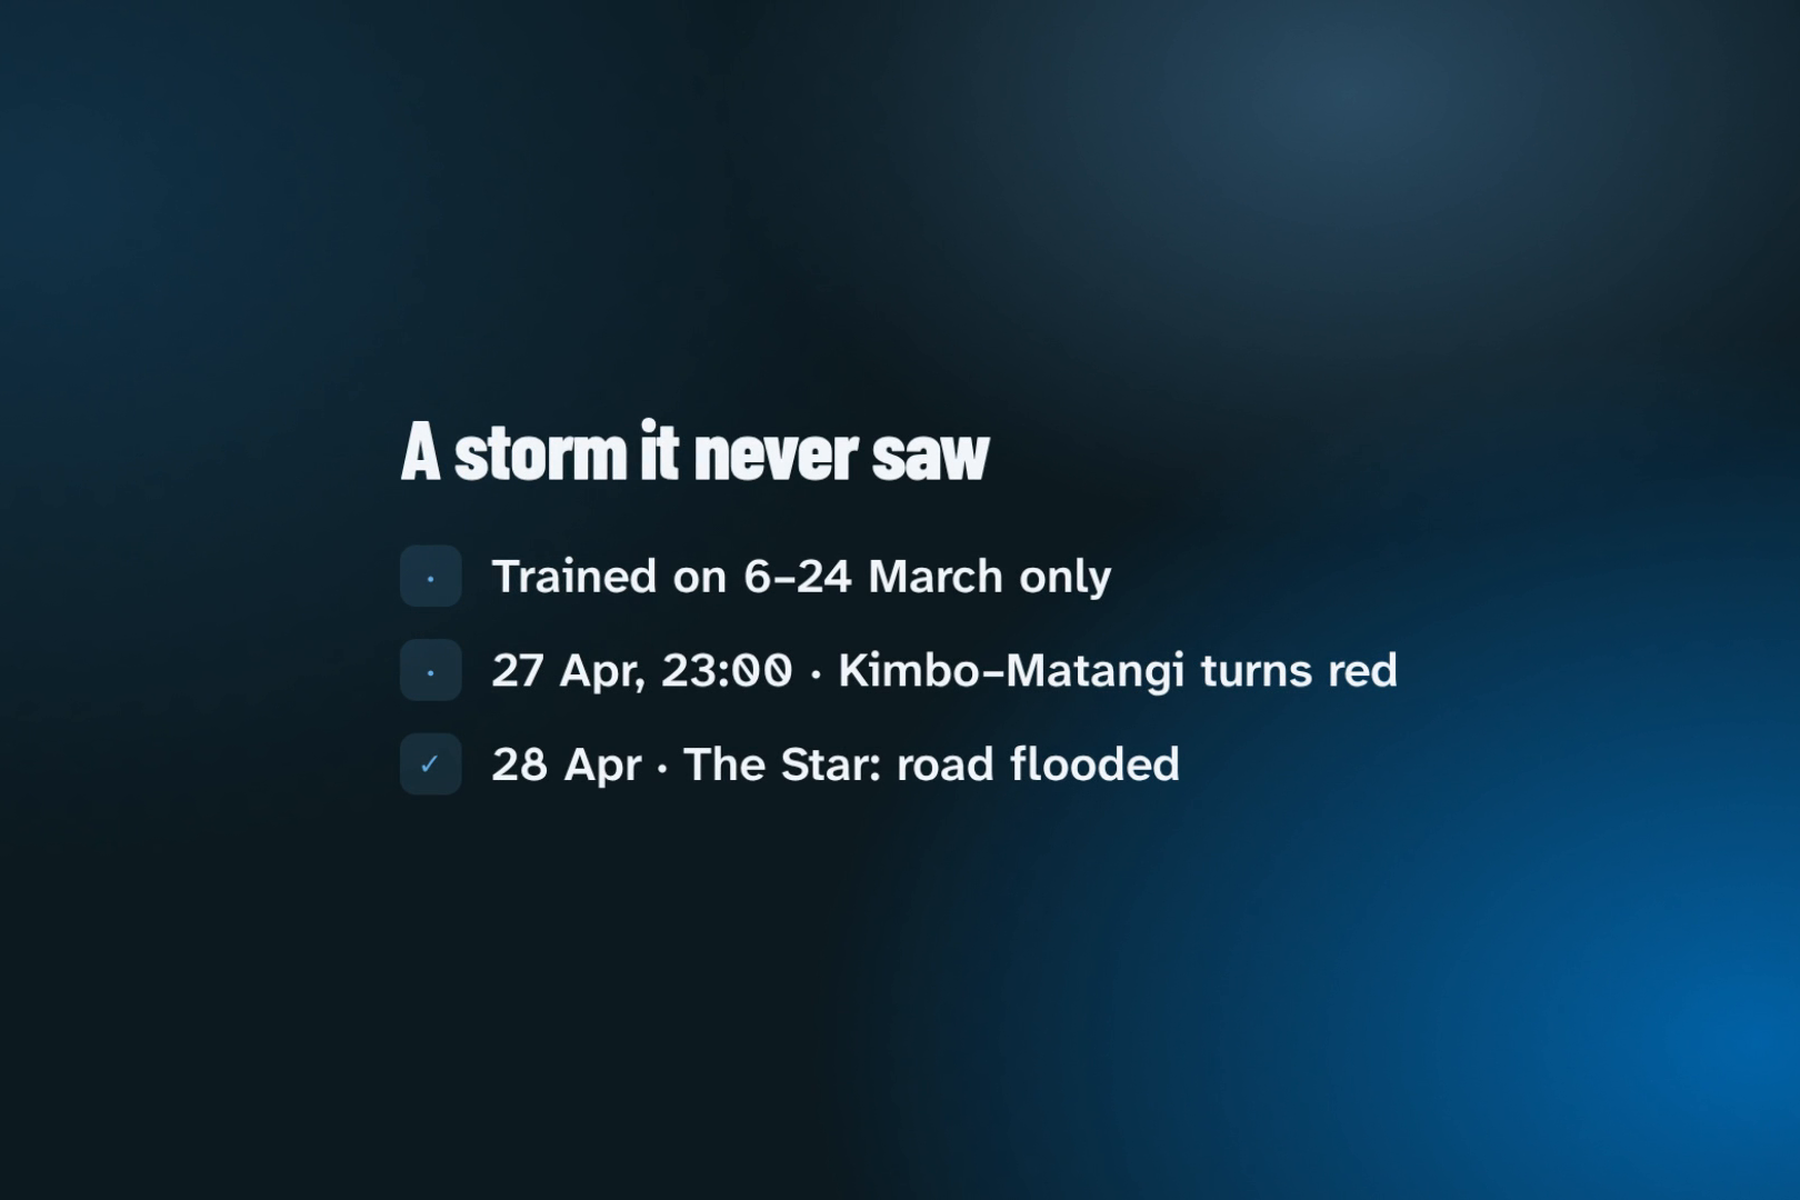
It called a storm it never saw. We learned the triggers from March only, then ran the model over 18–30 April with no reports. It turned Kimbo–Matangi red at 23:00 on 27 April, 1½ hours into a 95 mm night storm. The next day, The Star photographed the road flooded "after heavy rains pounded the area last night". It stayed on CROSS through the two small storms before that.
The same test showed us what's wrong. The model said CROSS again at 04:15, but the road stayed flooded through 28 April: that dip drains far slower than the 1.5-hour half-life we gave it. We didn't tune the model on the test storm. Fixing that drain time is the first job for the pilot.
What we learned
- Read the sensor before trusting the column name. The difference was 17×.
- Map names aren't local names. A detour only helps if riders recognise it.
- Saying "not sure" is a feature. Wide bands and NO CALL serve a rider better than a confident wrong answer.
- A held-out storm teaches more than a good-looking replay.
What's next
Kenya Met expects a wetter-than-normal October to December in Kiambu. We want to pilot with three boda stages and JKUAT before those rains:
- recruit stage chairs and students as the first reporters;
- fit each crossing's drain time from their taps;
- add more gauges (any station CSV already drops in, including TAHMO);
- send calls by SMS for riders without smartphones.
Built With
- ci
- conduit-api
- github
- next.js
- openstreetmap
- overpass
- typescript


Log in or sign up for Devpost to join the conversation.