-
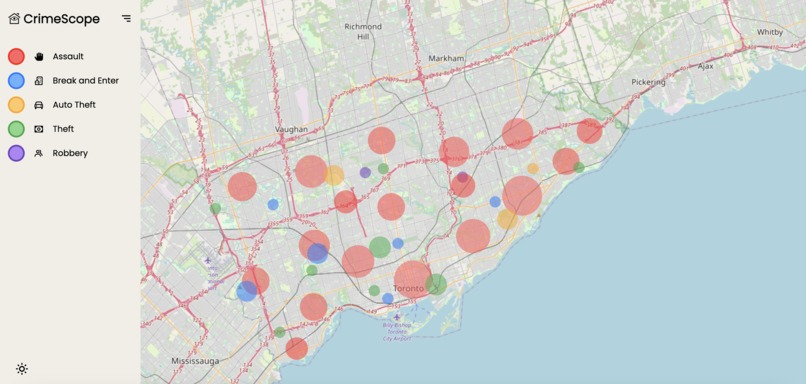
Screenshot of the website in Light Mode
-
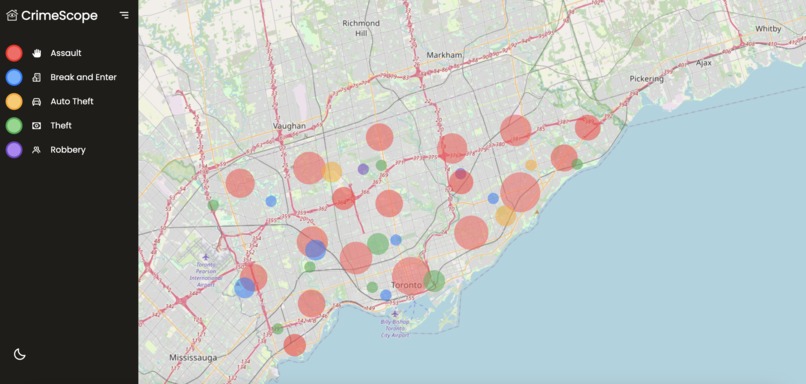
Screenshot of the website in Dark Mode
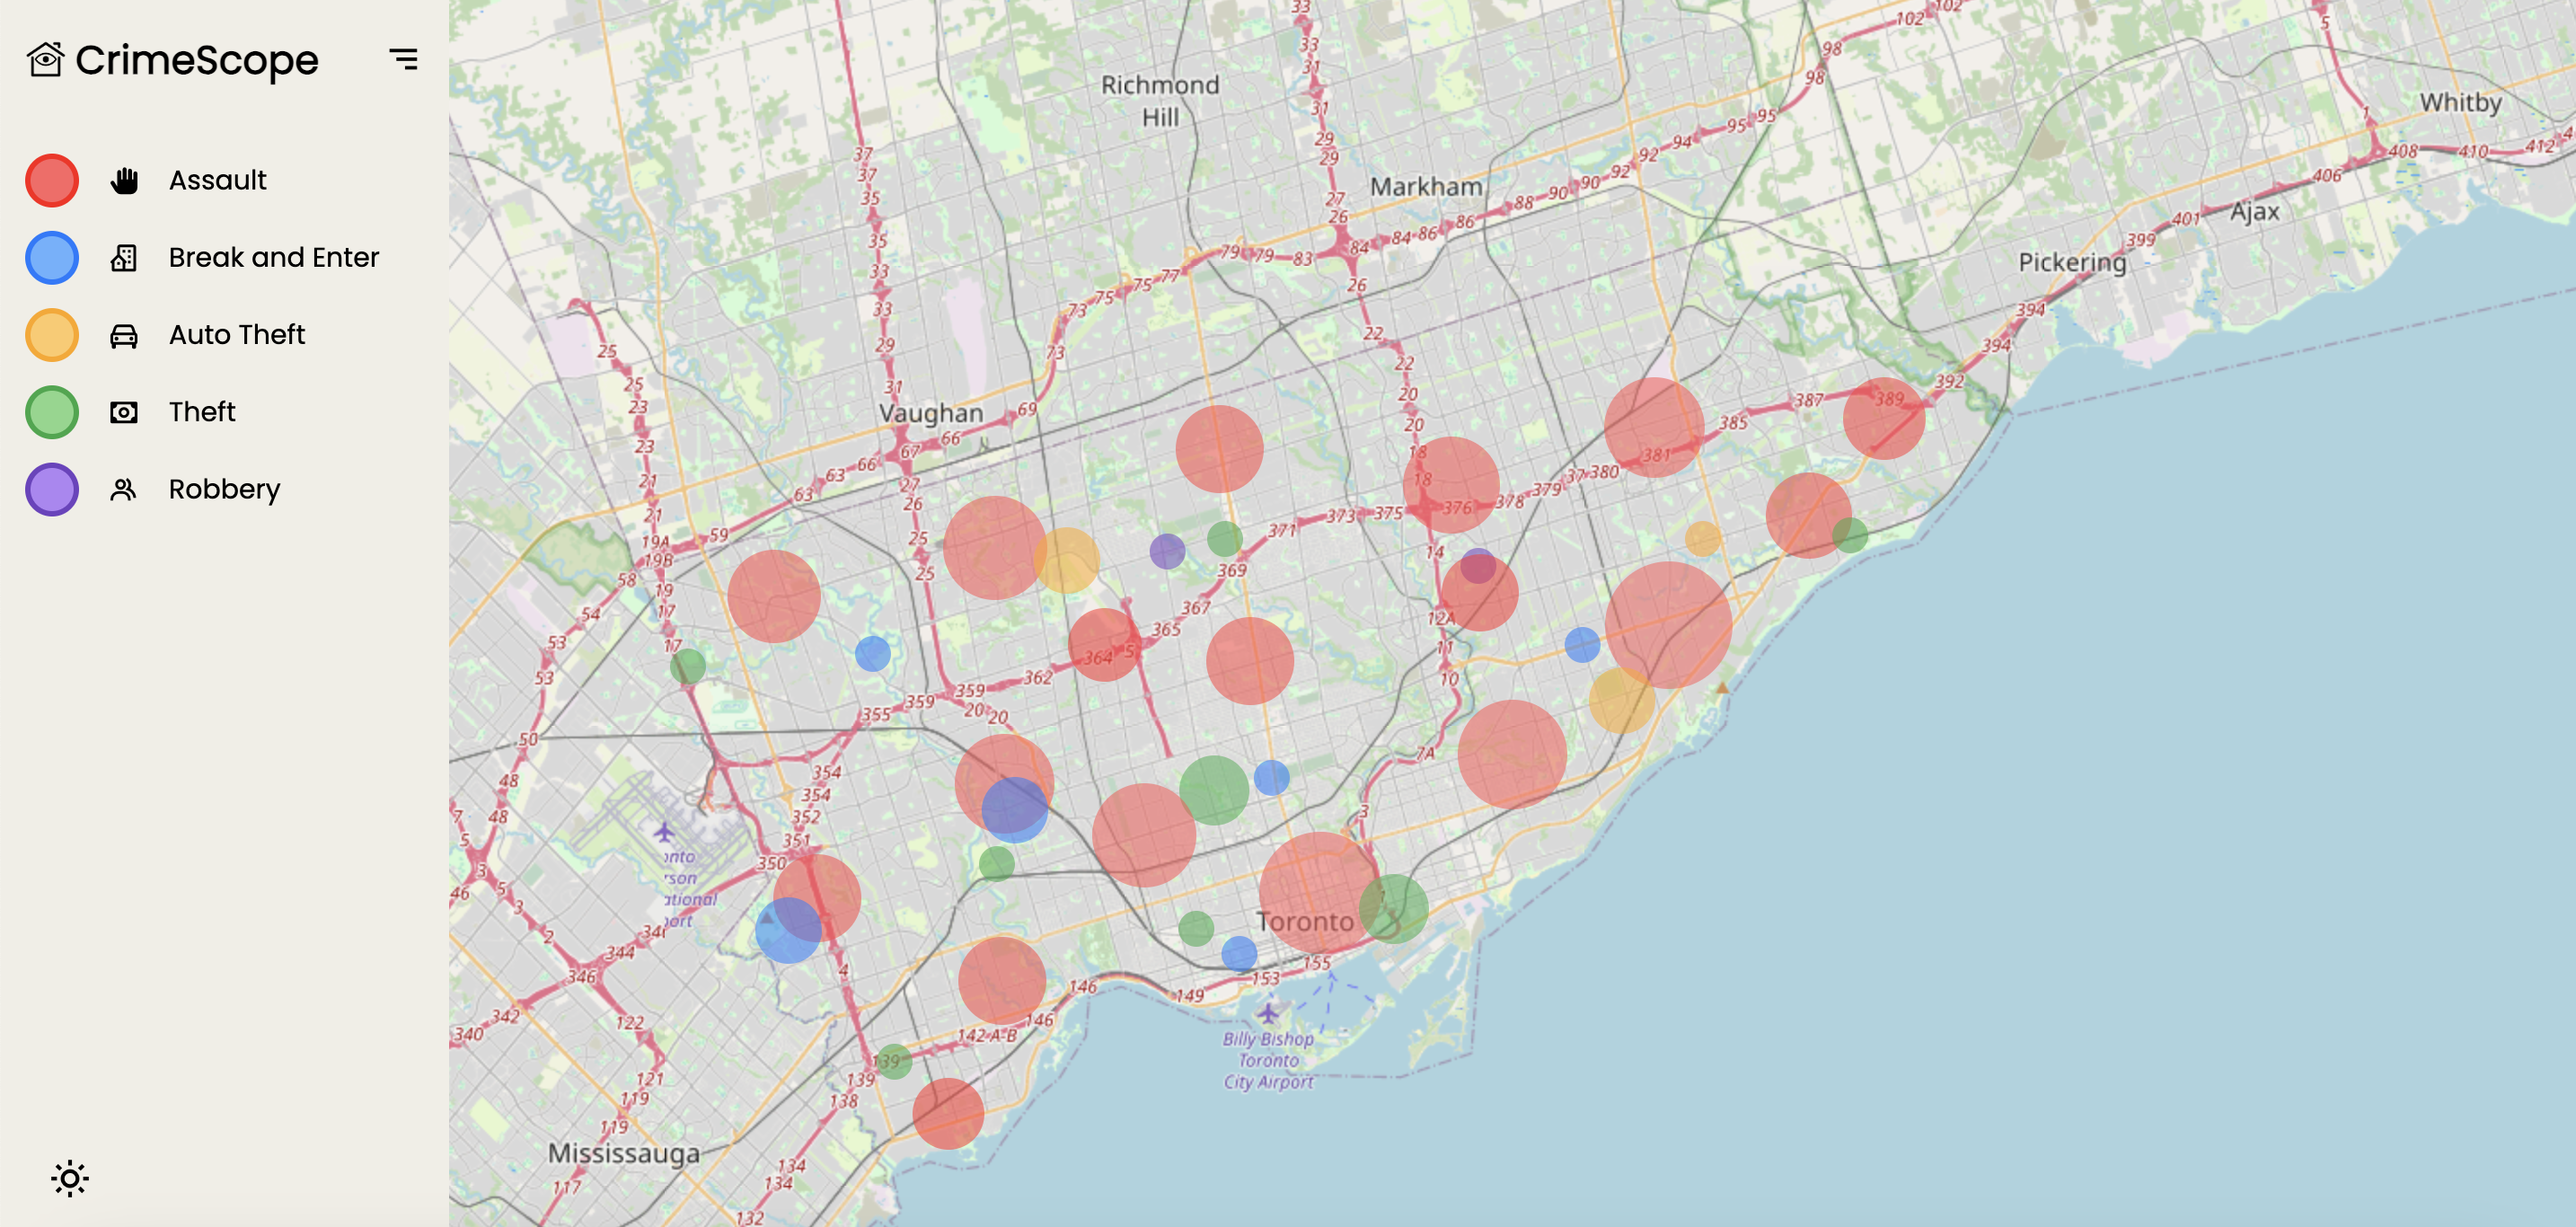
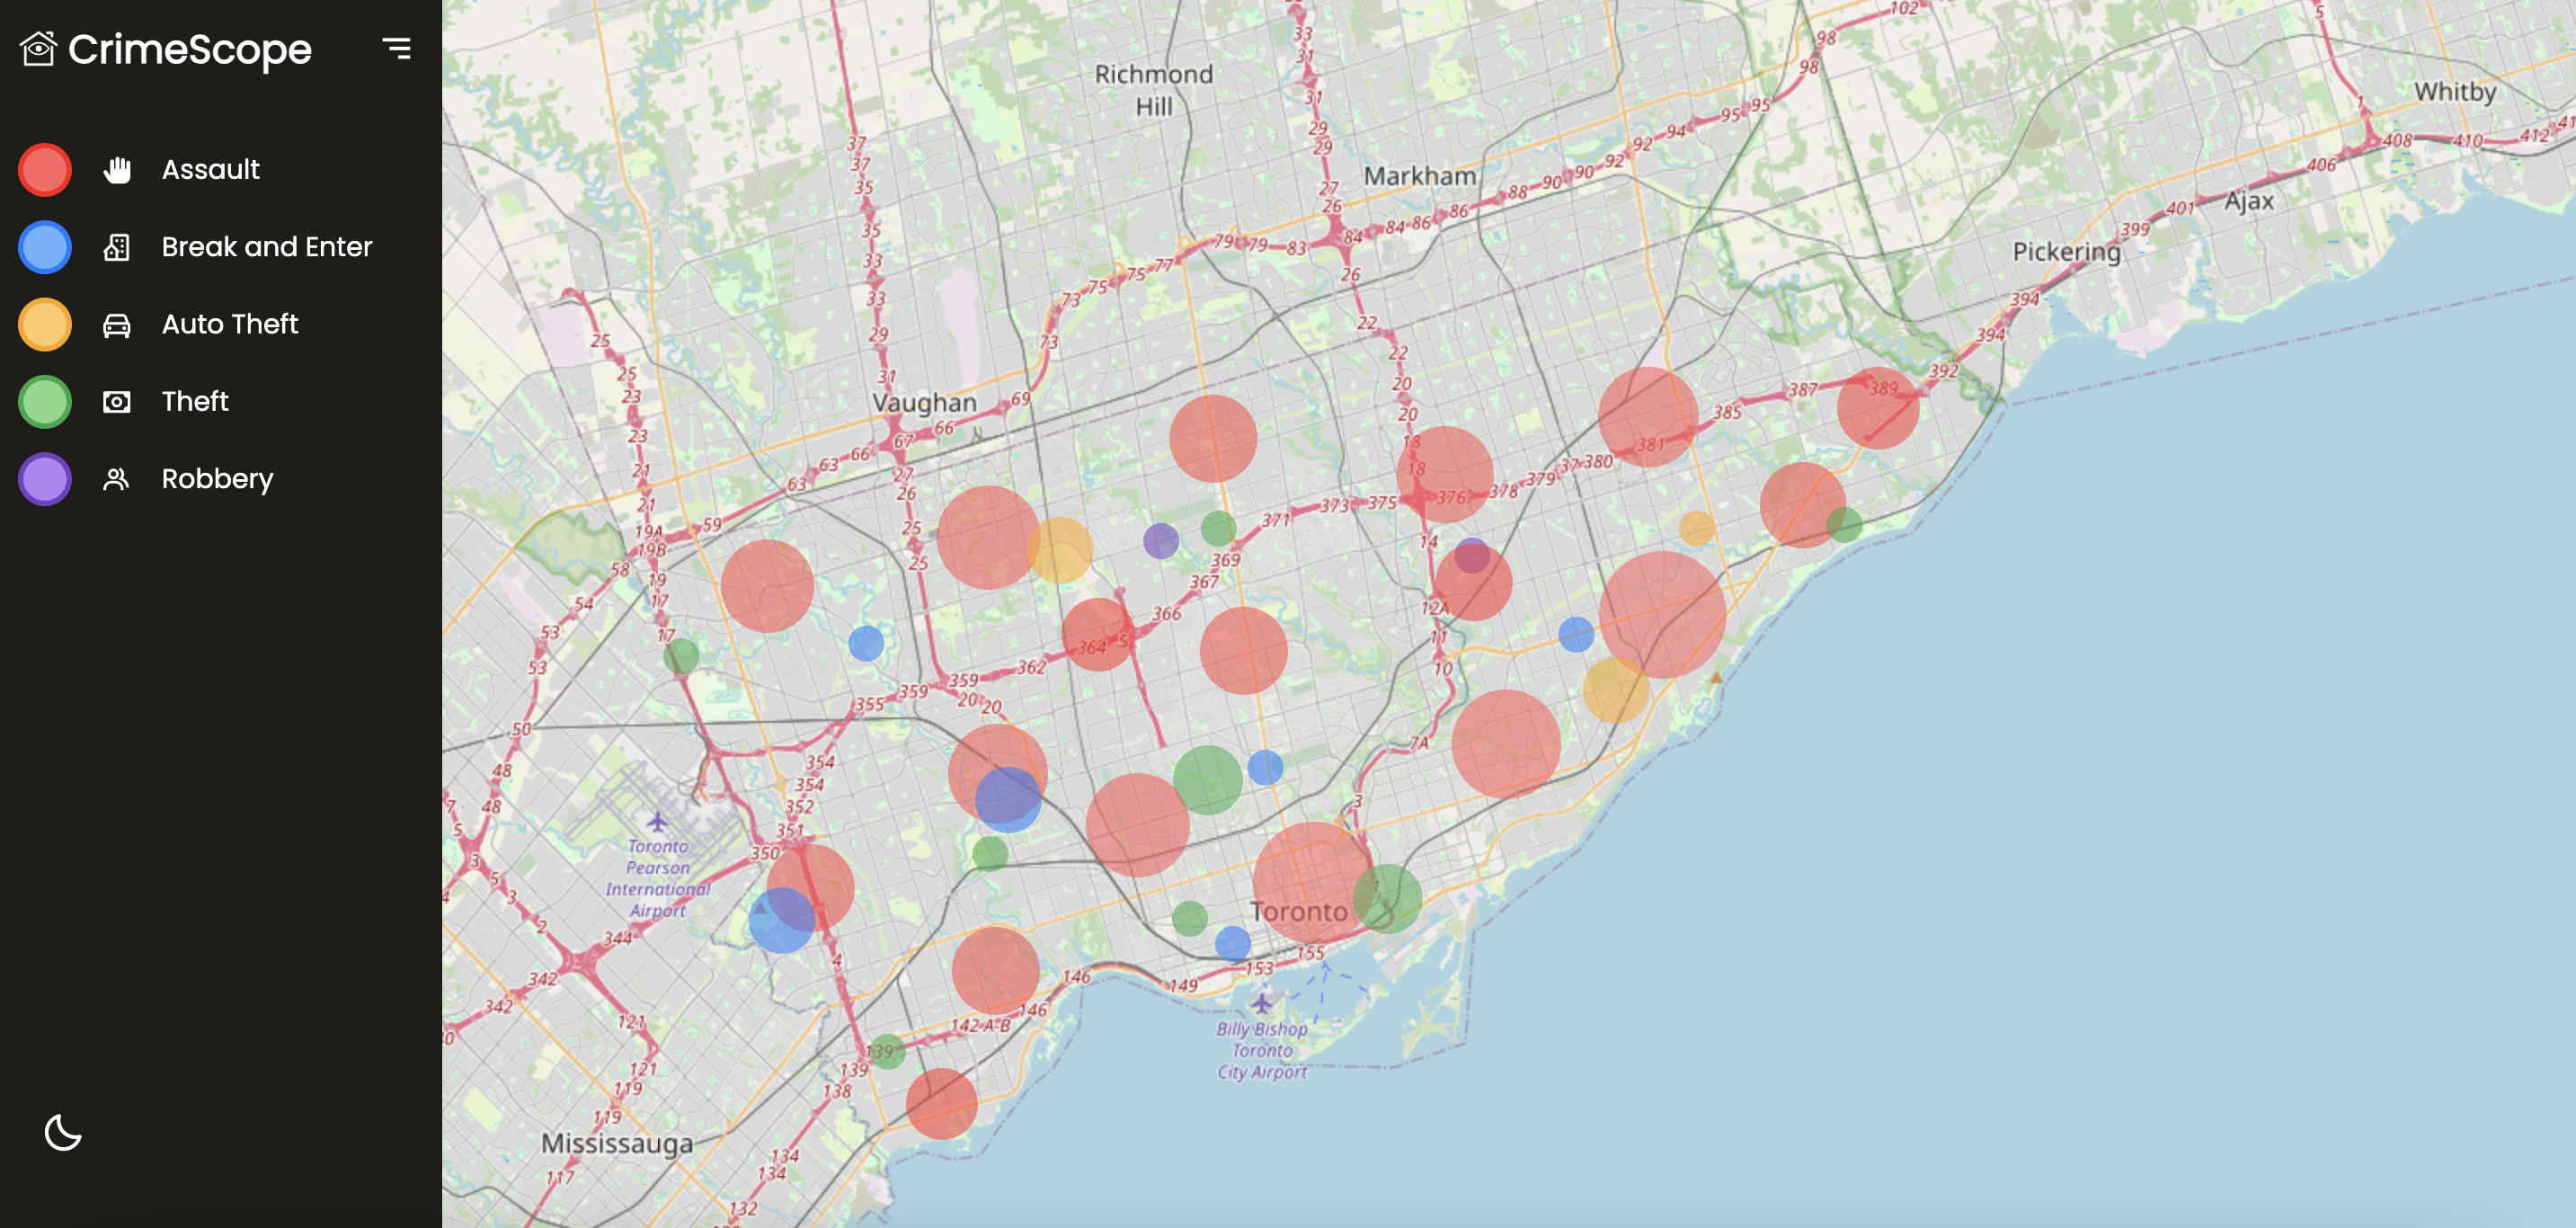
CrimeScope: Empowering Safer Decisions
Who It’s For
CrimeScope is designed with two main user groups in mind:
- Primary Users: Landlords and individuals looking to purchase homes. Finding a perfect home goes beyond just square footage and price; safety is a critical factor. With CrimeScope, users can identify high-crime areas, locate neighborhoods with lower crime rates nearby, and make informed decisions when choosing where to live or invest.
- Secondary Users: Citizens who want to stay informed about crime in their local area, and community organizations that need insights to allocate resources effectively.
Why It’s Necessary
Safety is one of the most vital aspects of choosing where to live or invest. Yet, navigating the complexity of crime data and understanding neighborhood trends is not easy. For landlords, purchasing property in a safer area ensures higher tenant satisfaction and value retention. Similarly, homebuyers want to ensure they are making the right choice for their family’s safety.
CrimeScope addresses this gap by providing a clear, intuitive interface to visualize crime data. Users can easily see areas of high crime density, evaluate safer alternatives nearby, and avoid making uninformed decisions that could have long-term consequences. This tool empowers users to prioritize safety, enabling them to balance safety concerns with other neighborhood benefits.
Note: As of now, CrimeScope focuses exclusively on crime data in Toronto, offering a localized but impactful solution to safety-conscious decision-making. Data is updated dynamically from https://data.torontopolice.on.ca/.
Technologies Used
CrimeScope was built with:
- Frontend: Leaflet.js for map visualization and interactive features.
- Backend Data Handling: JavaScript and asynchronous programming to fetch and process real-time crime data from open datasets.
- Clustering and Visualization: Marker clusters to group crime incidents by type and intensity, ensuring a user-friendly, uncluttered map interface.
Design Decisions
- Intuitive Color-Coding: We chose specific color gradients to represent different crime categories. For instance, shades of red for assaults and shades of blue for break-and-enters ensure users can instantly grasp the severity and category of crime at a glance.
- Clustered Markers: To reduce visual clutter and improve scalability, we implemented clustered markers that dynamically resize and recolor based on the number of incidents. This keeps the map readable while allowing users to explore detailed information on demand.
- Focus on Simplicity: Rather than overwhelming users with too many features, we streamlined the interface to highlight core functionalities like category-based clustering and easy navigation.
- Prioritizing Relevance: By filtering out invalid data points (e.g., zero latitude and longitude), we ensured only accurate information is displayed, maintaining user trust and credibility.
- Dark Mode Support: We included a dark mode option for users who prefer it, enhancing usability in low-light environments and reducing eye strain. The mode is easily switchable, ensuring a personalized and comfortable user experience.
What’s Next
We envision scaling CrimeScope to serve a larger audience and cover more regions. Here’s what’s on the horizon:
- Expanded Data Sources: Incorporating more datasets to provide comprehensive coverage across all provinces in Canada, ensuring users nationwide can benefit.
- Enhanced Categories: Adding new crime categories for finer granularity and better insights, enabling users to make even more precise decisions.
- Improved Refinement: Introducing advanced filtering options, like neighborhood overlays and customizable crime thresholds, to provide deeper insights tailored to individual needs.
CrimeScope is more than just a map; it’s a tool to empower individuals and communities to make safer, smarter choices. With further enhancements and broader data integration, CrimeScope aims to become Canada’s go-to platform for crime awareness and decision-making.
Built With
- css
- data.torontopolice.on.ca
- github
- html
- javascript
- leaflet.js
- openstreetmap

Log in or sign up for Devpost to join the conversation.