-
-
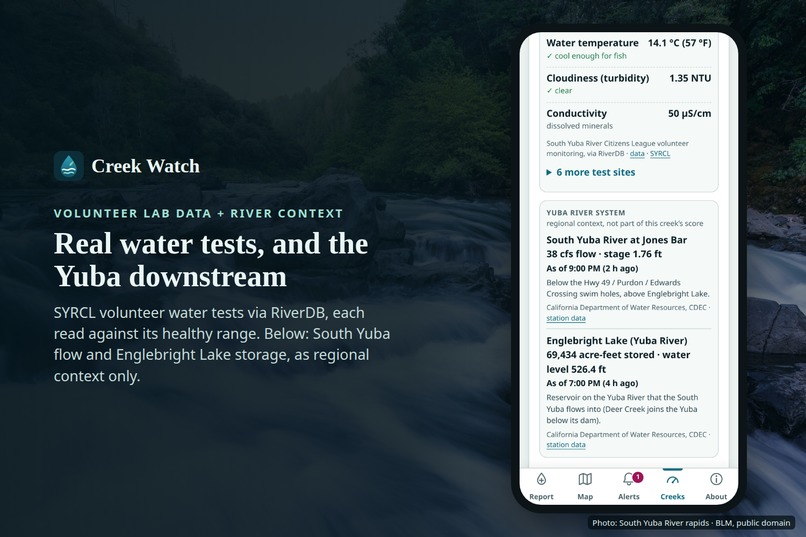
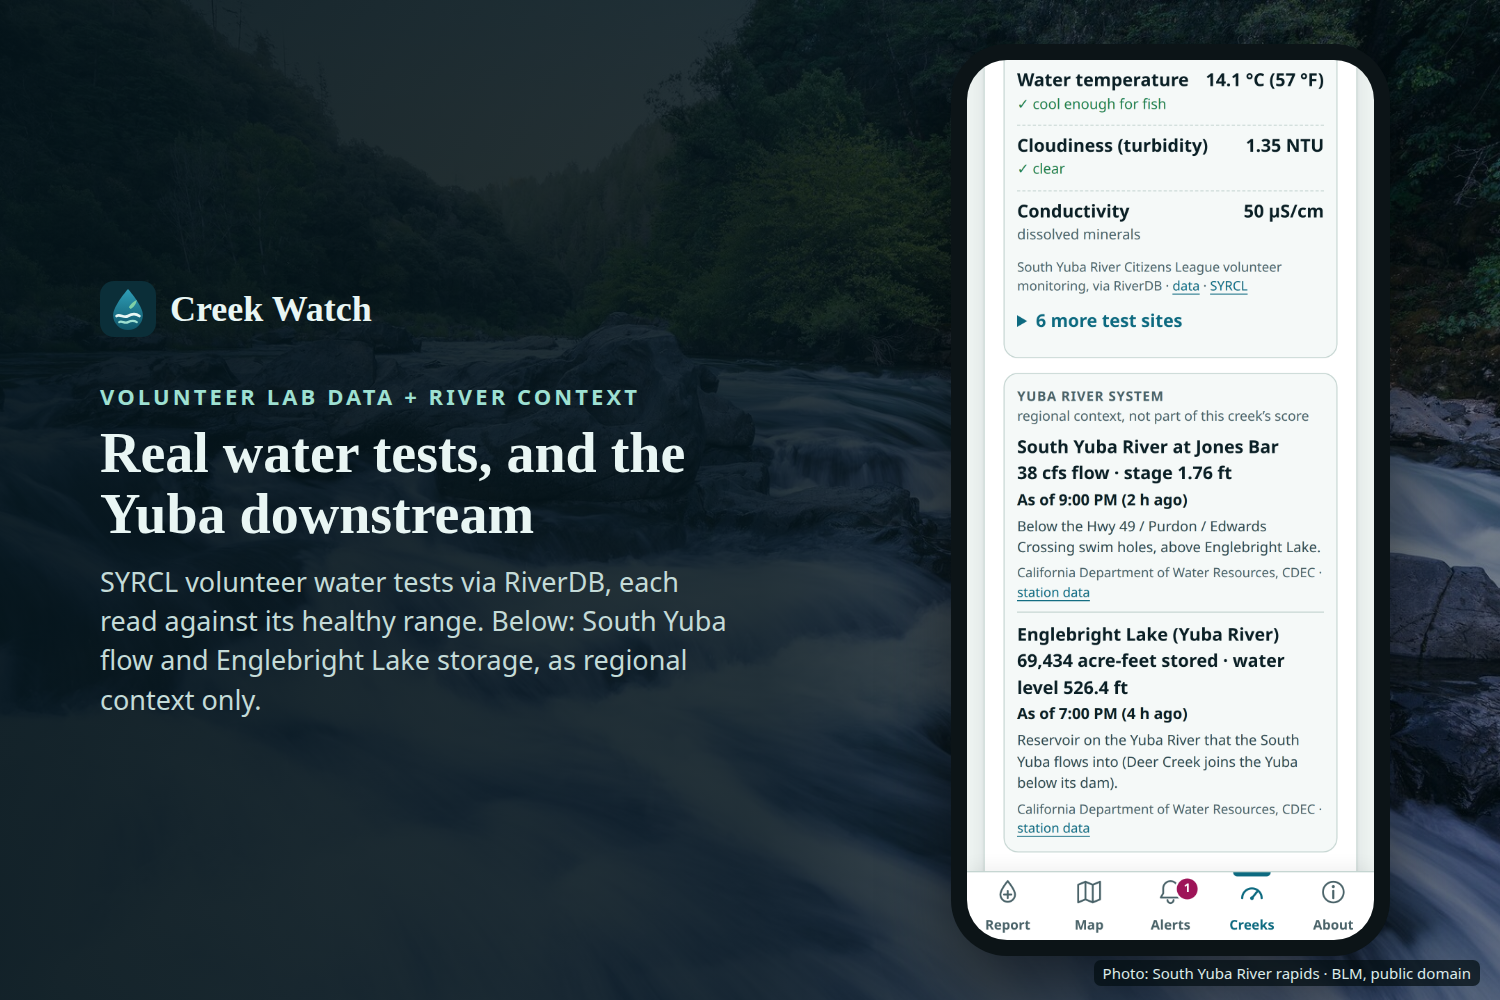
SYRCL water tests via RiverDB, plus South Yuba flow and Englebright storage as context. Photo: South Yuba River rapids · BLM, public domain.
-
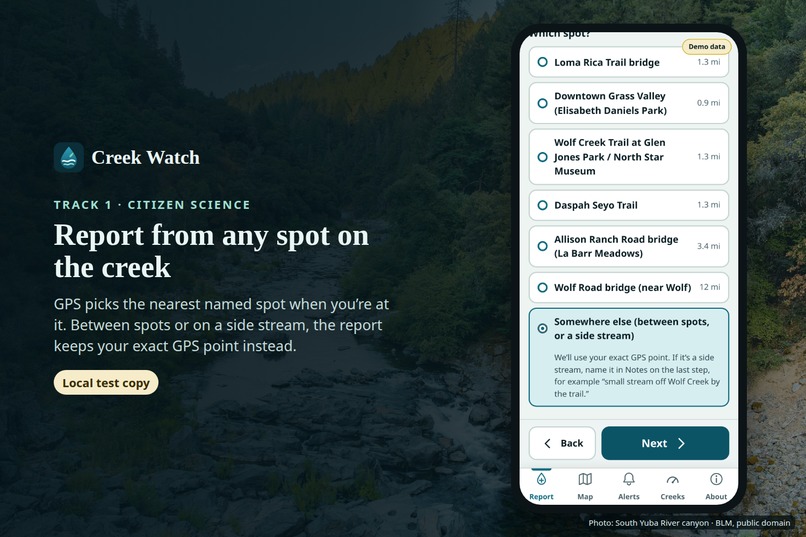
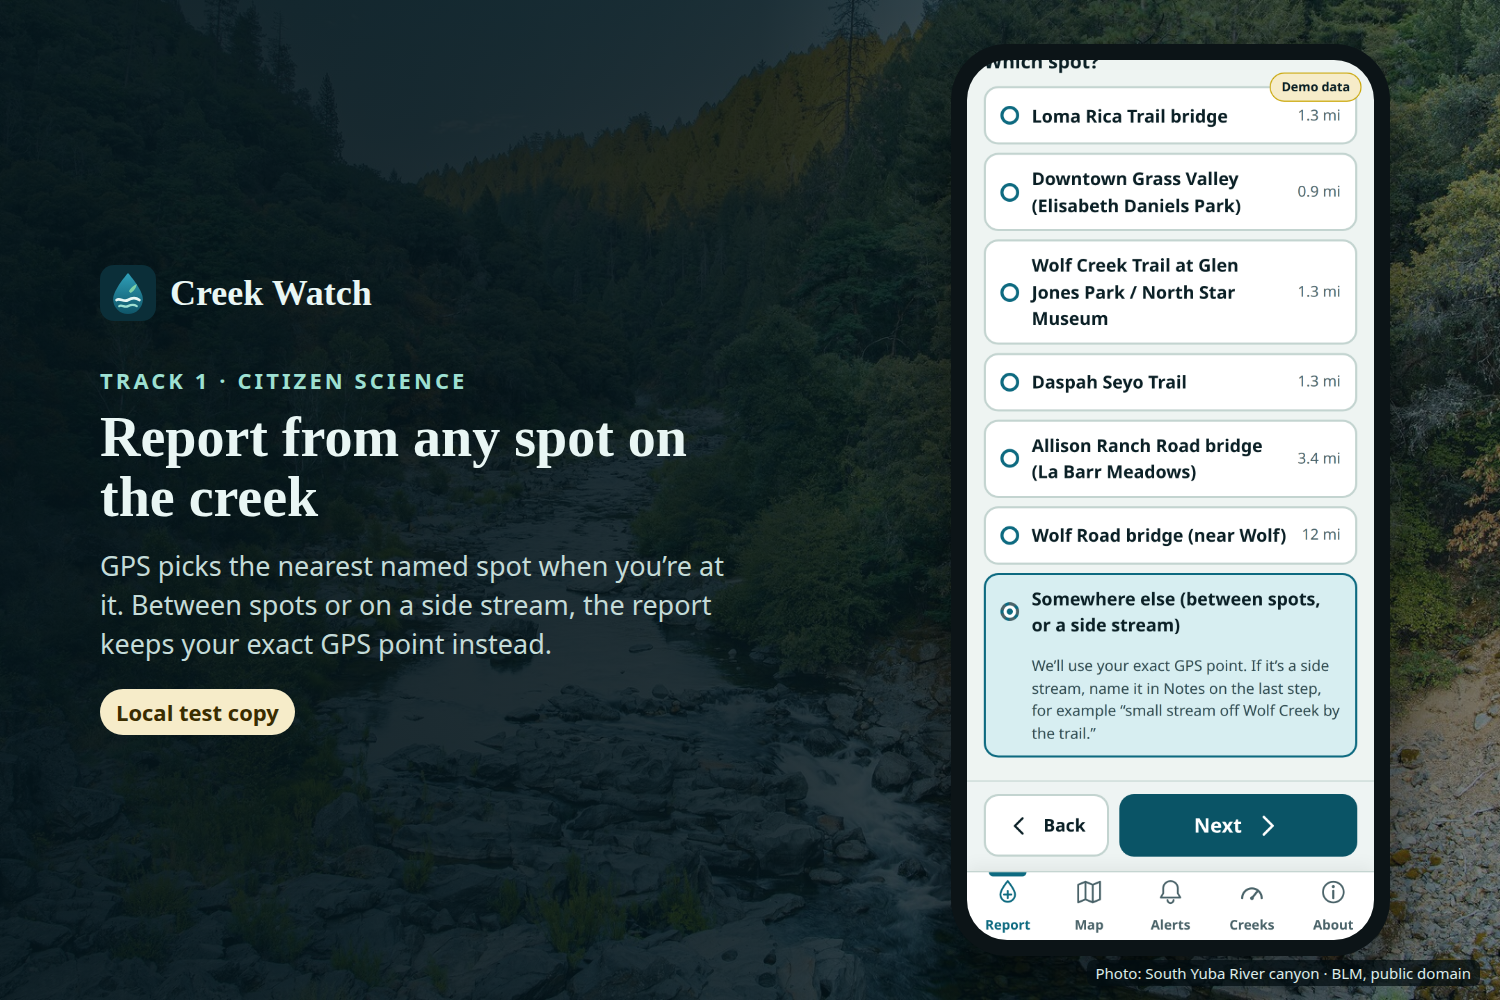
Track 1: report from any spot; off-spot reports keep their exact GPS point. Photo: South Yuba River canyon · BLM, public domain.
-
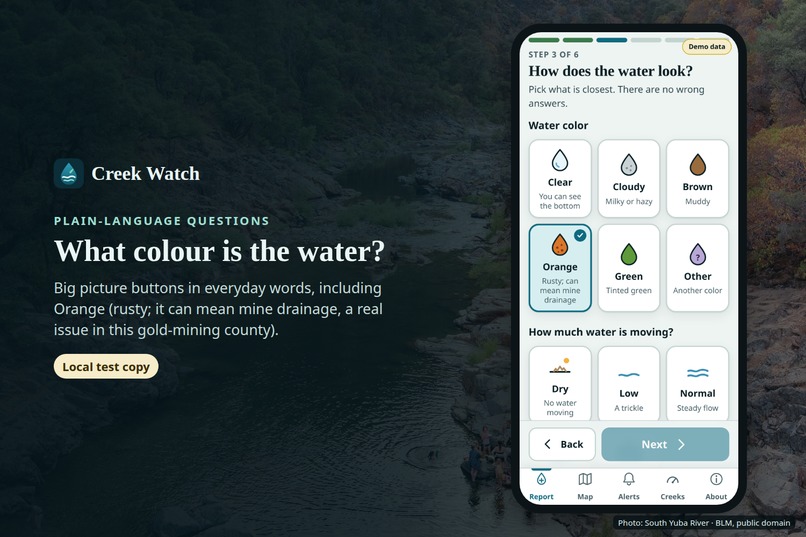
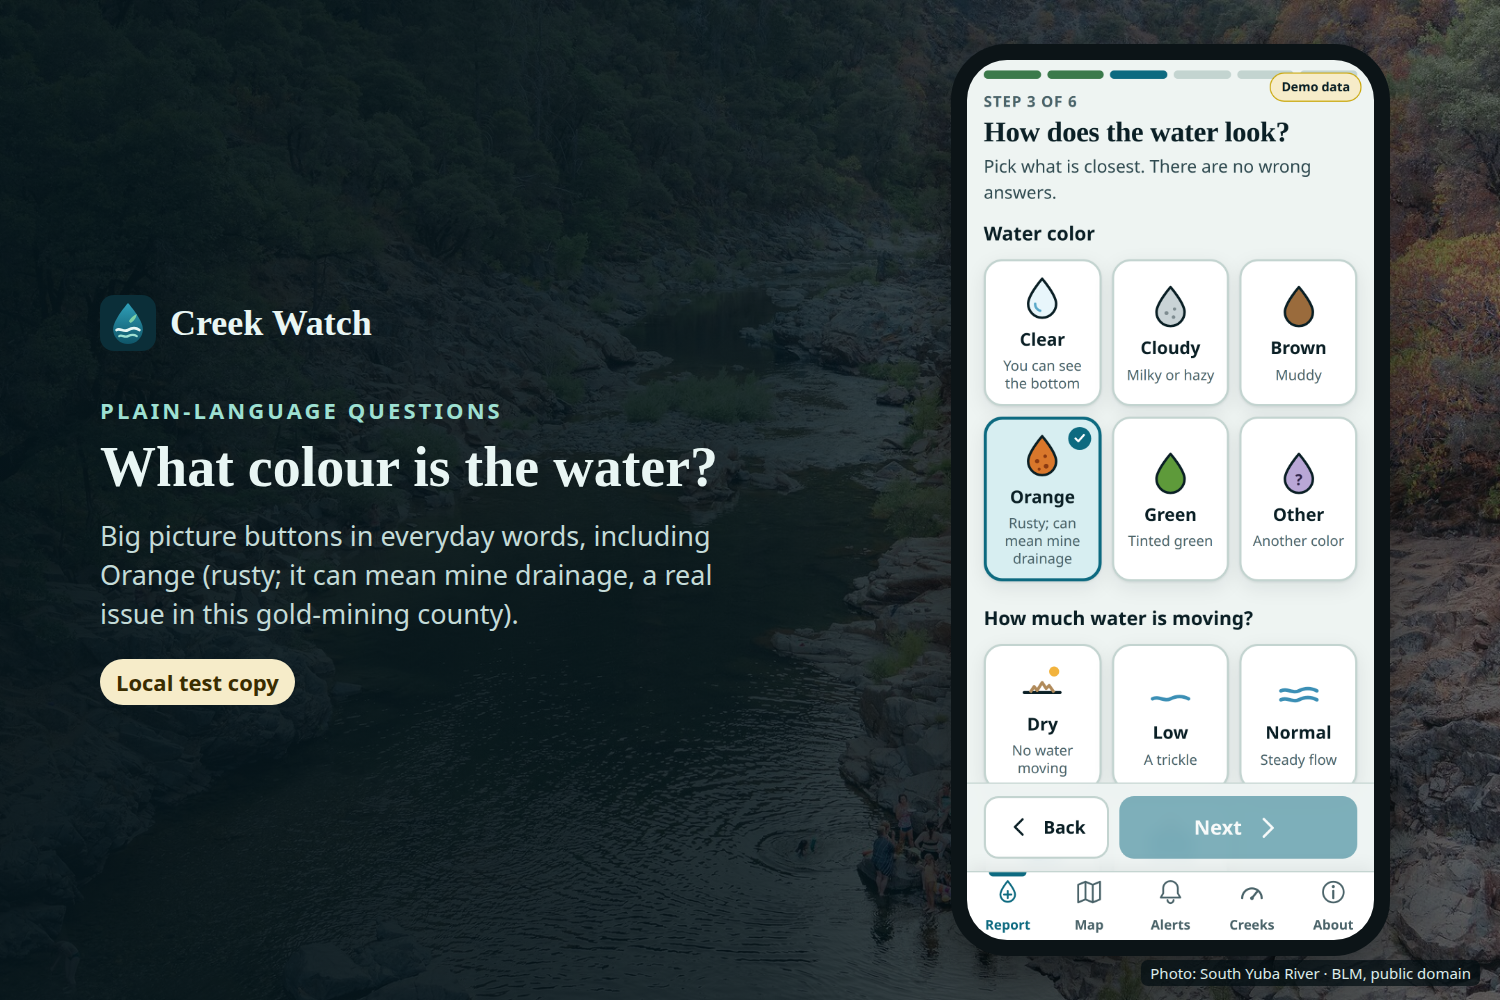
Plain-language questions, incl. Orange water (rusty; can mean old-mine drainage). Photo: South Yuba River · BLM, public domain.
-
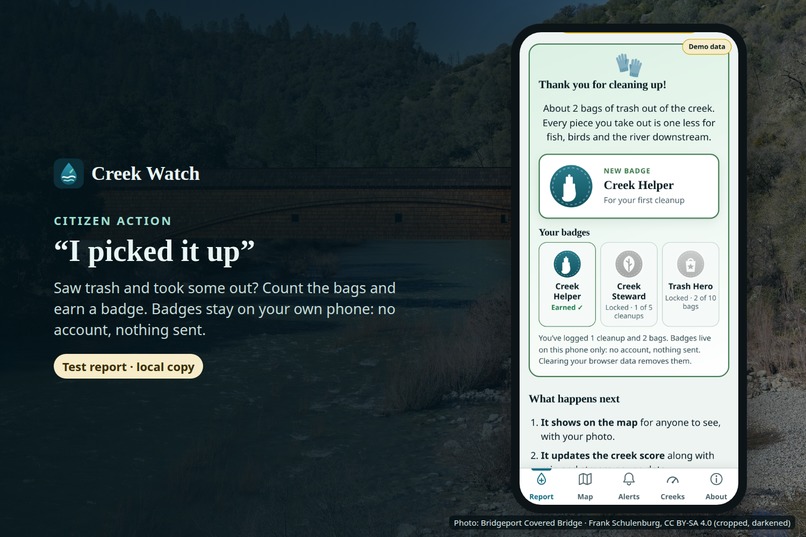
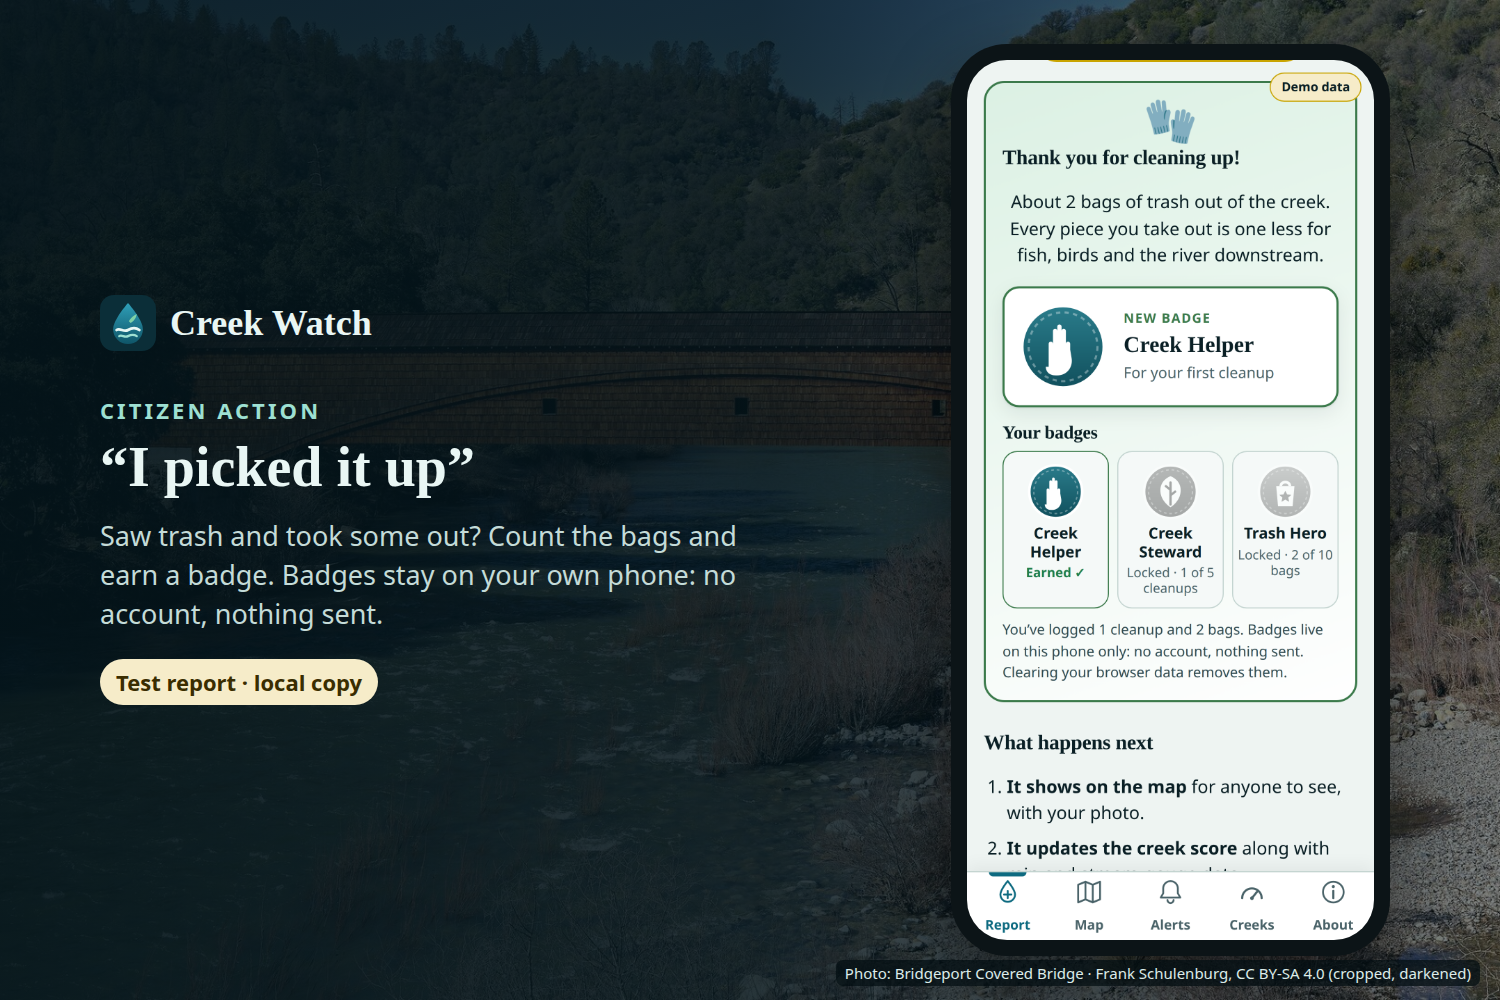
“I picked it up”: count bags, earn a badge on your phone. Photo: Bridgeport Covered Bridge · Frank Schulenburg, CC BY-SA 4.0 (cropped).
-
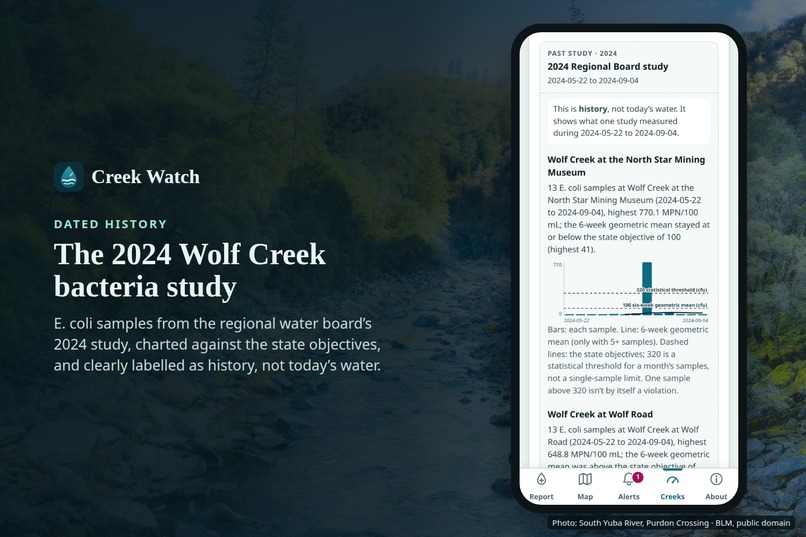
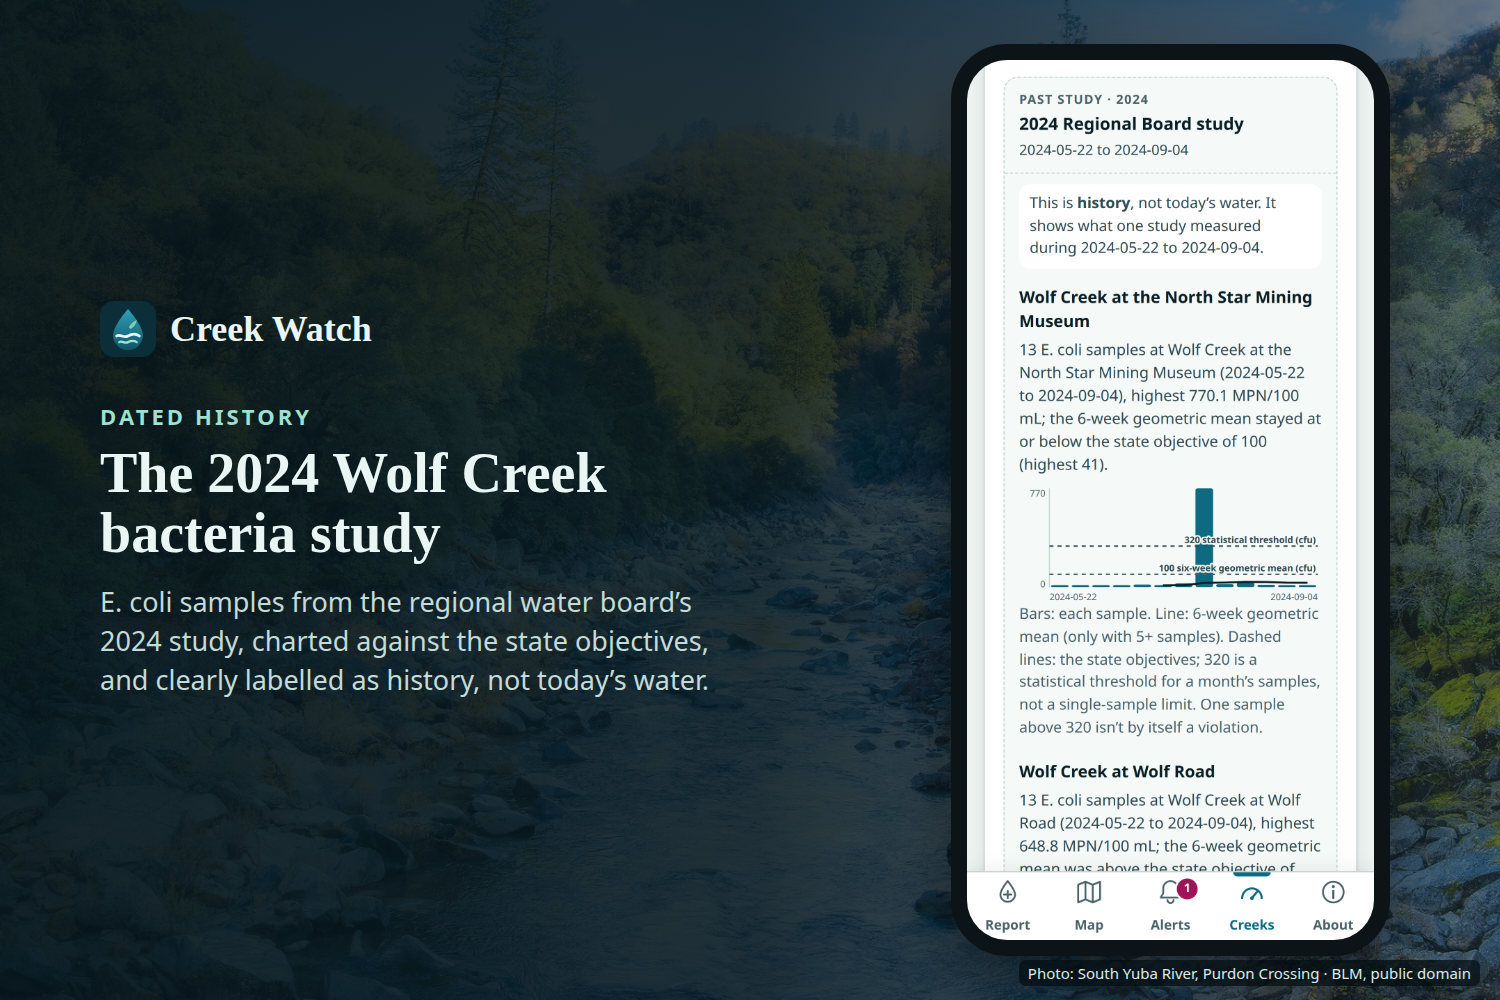
Dated history: the 2024 Wolf Creek E. coli study vs state objectives. Photo: South Yuba River, Purdon Crossing · BLM, public domain.
-
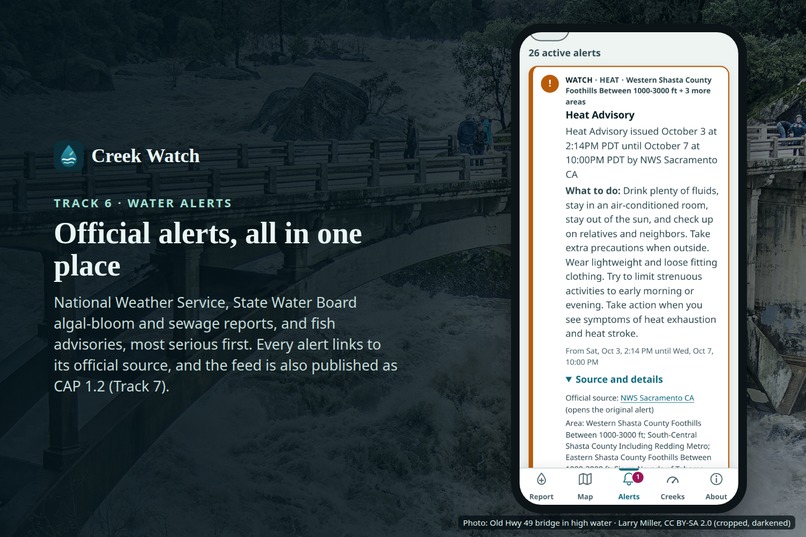
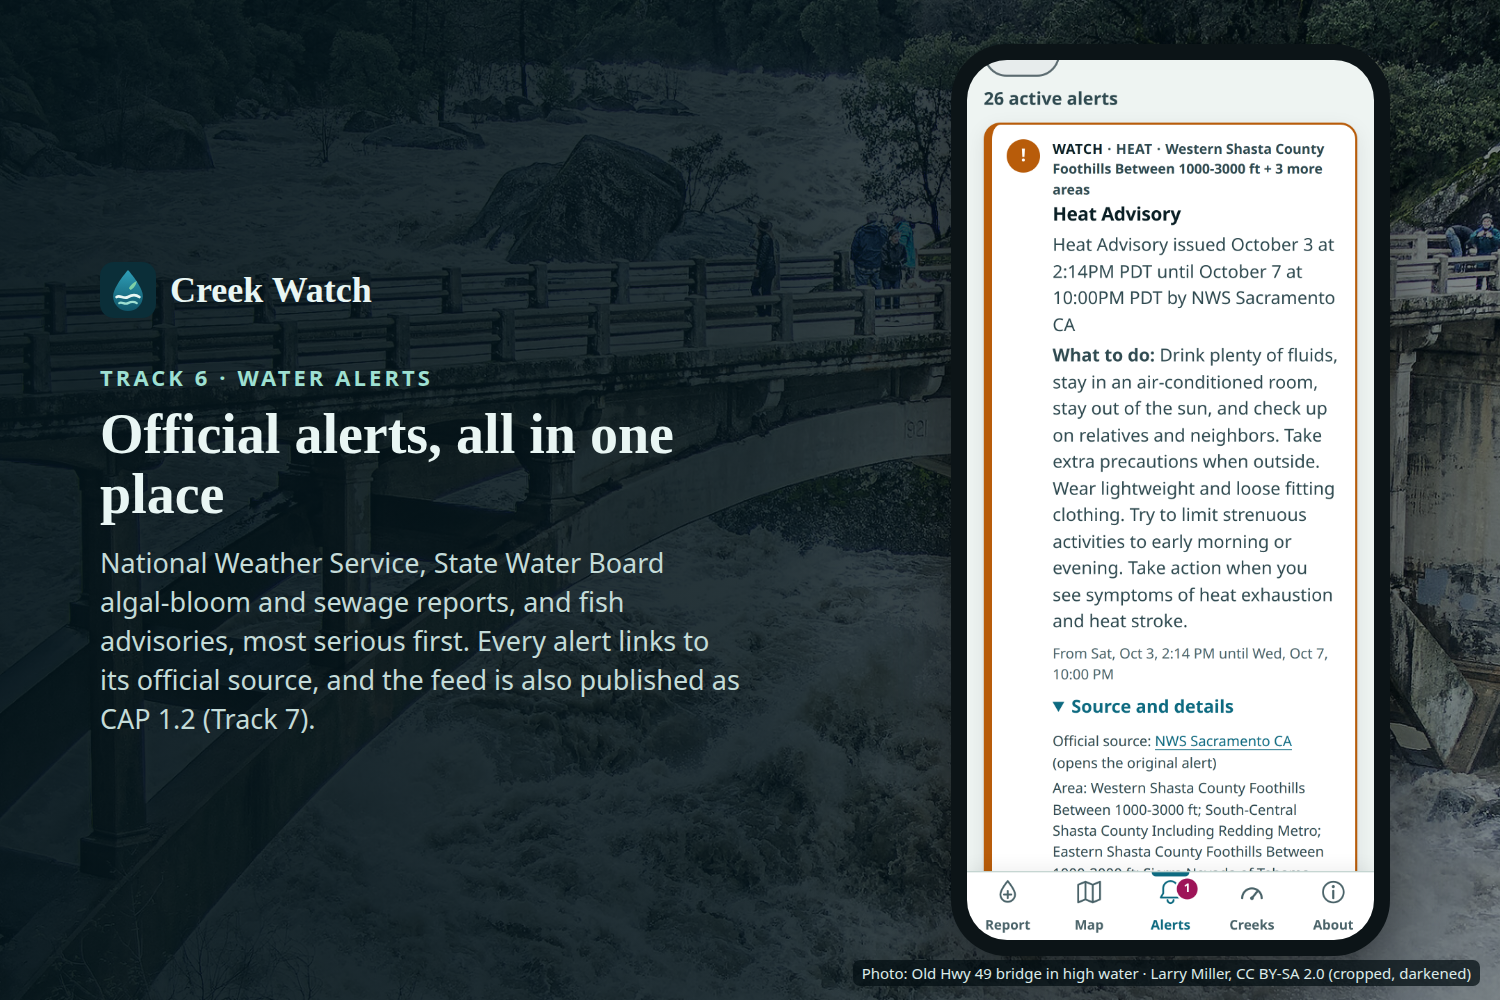
Track 6: official water alerts in one place; CAP 1.2 feed. Photo: Old Hwy 49 bridge in high water · Larry Miller, CC BY-SA 2.0 (cropped).
Track alignment
Primary: Track 2, Data-to-Insight. Creek Watch turns citizen-collected stream observations into actionable insight. It plots reports on a map, gives each creek a dashboard card, and computes a 0–100 creek-health score whose every input is explained in plain language (which signal moved the score, by how much, and where the data came from). It gets fresher every time someone reports and every time the public gauge and weather feeds update.
Also addresses:
- Track 1, Citizen Science UX: a guided six-step report flow with big tap targets, picture icons and everyday words ("cloudy", "smells like sewage") instead of lab terminology. Location is filled from the phone, and the nearest monitoring spot is picked automatically, but only when you're actually at it. Reporting from a side stream or between spots? Choose "Somewhere else (between spots, or a side stream)" and the report keeps your exact GPS point instead of being moved to the nearest named spot. When someone reports trash, an optional "I picked it up" toggle (with an optional bag count) records a cleanup, next to a safety line: "Only pick up what's safe. Leave needles, chemicals and big items, and report them." Repeat helpers earn small badges (Creek Helper, Creek Steward, Trash Hero). The badges are stored only on their own phone: no account, nothing sent.
- Track 6, Resilience Informatics: one place for water-related warnings on these creeks. Creek Watch checks eight live sources on a schedule:
- National Weather Service alerts and Creek Watch's own early-warning rules, every 5 minutes;
- USGS high- and low-flow signals and NOAA river flood categories, every 15 minutes;
- state harmful-algal-bloom advisories, hourly;
- State Water Board sewage-spill reports, every 12 hours;
- volunteer bacteria tests and California's fish-consumption advisories, daily.
It shows them on an Alerts page, and anyone can opt in to push notifications filtered by creek and severity. Creek Watch's own rules turn citizen reports into warnings: heavy rain plus brown-water reports raises a runoff watch; orange water raises a possible mine-drainage watch; lots of algae in warm weather raises an algal-bloom watch; any dead fish, or a chemical or sewage smell, raises an alert. Every official alert links its source. For emergencies and evacuations, the app points people to Nevada County Alerts, AwareCA and 911; it doesn't replace them.
- Also Track 7, Digital Health Standards (interoperability): every alert is also published in CAP 1.2, the OASIS Common Alerting Protocol used by public alerting systems, inside an Atom feed (
/alerts.cap.xml). There's a plain Atom feed too (/alerts.atom), and both can be filtered per creek. Any system can read them without an account. On October 3, 2026, we checked each CAP alert in the live feed against the official OASIS CAP 1.2 schema. We don't claim FHIR or any formal integration with other systems.
Inspiration
Wolf Creek runs through downtown Grass Valley, and Deer Creek runs through downtown Nevada City, in California's Sierra foothills. Both pass parks, trails, streets and homes, and people walk beside them every day. Yet neither is monitored live where people are. Wolf Creek has no real-time USGS stream gauge at all. Deer Creek's only real-time gauge (USGS 11418500, near Smartsville) is about 22 km downstream of Nevada City, below Lake Wildwood, whose regulation damps and delays what happens in town. Those walkers see things an instrument can't: trash, algae, foam, an odd smell, a dead fish. But there's no simple way to record what they saw or to connect it with the stream-gauge and weather data that already exist. We wanted the people who notice first to become part of the early-warning system.
Why this matters: water warnings here are real, but scattered
These are public records, checked on October 3, 2026, the weekend we built Creek Watch:
- Sewage spills. The State Water Board's sanitary-sewer spill data (Cat 1–3 spills file, reporting since June 2023) lists 41 spill events in and around Nevada County. Three of them reached our creeks or the lake on Deer Creek:
- Wolf Creek, Grass Valley, May 5, 2026: 850 gallons to surface water (1,000 gallons total);
- Deer Creek, Nevada City, September 3, 2025: 50 gallons to surface water (300 total);
- Lake Wildwood, November 20, 2025: 71,355 gallons to surface water (71,455 total).
- Algal blooms. The state's freshwater harmful-algal-bloom reports (data.ca.gov, HABs portal) show open "Caution" advisories at Lake of the Pines (from September 22, 2026) and Lake Zyac (from September 15, 2026), both in Nevada County.
- Fish. California's OEHHA lists 10 fish-consumption advisories touching Nevada County, including one for Deer Creek (dataset).
- Weather. While we were building, the National Weather Service had a Heat Advisory in effect at our Deer Creek trail site (issued October 3, 2026).
Each of these lives on a different government website, in a different format. Someone walking by the creek has no single place to see them, and no way to add what they see themselves. That gap, together with having no live stream gauge in town, is why we built Creek Watch.
What it does
- Report (phone-first): take or choose a photo, then answer six quick questions: water colour (clear, cloudy, brown, green, orange or other), algae, trash, flow, odour, and dead fish. An optional note and wildlife sighting can be added. GPS fills the location and the app picks the nearest named spot. Photos have their EXIF metadata stripped on the server, and the reporter's name is optional.
- Safeguards, with no accounts: a report must be within 25 km of a monitored creek; anything farther is refused with a plain-language reason. Each device can file up to 12 reports per 10 minutes, and one busy device doesn't block anyone else. (Both were checked on 2026-10-04 in a rehearsal against a scratch copy of the live build, which uses the same settings as production: 24 km accepted, 26 km refused, the 13th report in 10 minutes refused while a second device was still accepted.)
- Cleanups: if you remove trash, tap "I picked it up" and optionally add how many bags. Once someone logs a cleanup, each creek card shows a community counter ("N reported cleanups · B bags"), described as reported by volunteers rather than verified. The score's trash explanation thanks people who removed trash, but reported trash still counts, because it shows that dumping or runoff reached the creek.
- Map: creek lines, named monitoring spots and recent-report pins coloured by health band. Tap a pin to see the photo and the report.
- Dashboard: one card per creek with the health score (0–100) and band (good, fair, watch or alert). Each signal comes with its explanation and source. The card also shows the latest USGS stream-gauge reading, current weather and 24-hour rainfall, recent reports, and a 7-day report sparkline.
- Past study, Wolf Creek, 2024 (dated history): the Wolf Creek card has a "Past study · 2024" panel. It charts the Central Valley Regional Water Board's 2024 E. coli sampling (May 22 to September 4, 2024, from CEDEN), with the state's six-week average (100) and statistical threshold (320) drawn as reference lines. At Wolf Creek at Wolf Road, the six-week average was above 100 in four weekly calculations, July 17 to August 7, 2024 (highest 119.3), each based on at least five samples. A single sample above 320 was recorded once at each of the two study stations Creek Watch shows: 648.8 at Wolf Road (May 22) and 770.1 at the North Star Mining Museum (July 31). 320 is a statistical threshold for a month's samples, so one sample above it isn't by itself a violation. The samples were measured in MPN/100 mL while the state objective is written in cfu/100 mL; the two are commonly treated as comparable, not identical. The Wolf Creek Community Alliance says the State Water Board asked it for recommended sampling locations, "based on our 20 years of creek monitoring". This is history, shown with its dates, never as today's condition.
- Yuba River system (regional context): the Deer Creek card also shows the South Yuba River's flow at Jones Bar and Englebright Lake's storage, from California's CDEC. These readings can lag by several hours, so each one shows when it was observed. They're context, not part of the creek's score.
- Swim holes (dated volunteer tests): the map marks five popular swimming spots: Purdon Crossing, Edwards Crossing, the Hwy 49 bridge and Bridgeport on the South Yuba, and the Oregon Creek swimming hole on the Middle Yuba. Each shows its latest E. coli test from the South Yuba River Citizens League's volunteer monitoring (via RiverDB), labelled with its date as "a summer sample, not a live reading", and whether it was below California's recreational threshold of 320 (a statistical threshold, not a single-sample limit). A recent result above the threshold adds a regional advisory to the alerts feed. Swim holes don't change the creek scores.
- Early warning: the rules above raise a watch or an alert, each with a plain-language reason.
- Orange water (added after local watershed feedback): a report of orange water raises a watch. The app explains that orange water can be a sign of mine drainage (iron and other metals) from old mine sites, or of a natural iron seep. It says to avoid contact until it clears, and to report it through CalEPA's environmental complaint form, which sends it to the appropriate agency.
- Alerts: one list of active water-related alerts for the area, from official sources and Creek Watch's own rules. Each alert has a plain-language summary, a severity (alert, watch, advisory or info) and a link to the official source. Open feeds: Atom and CAP 1.2.
- Push notifications (opt-in): choose creeks, a minimum severity and optional quiet hours. A welcome notification confirms it worked, and you can turn it off at any time. No account is needed. The server stores only the browser's push address with its encryption keys and your filters, plus timestamps and a delivery-failure counter. Web Push was tested end to end on a real phone on October 3, 2026: subscribing delivered the welcome notification, including after unsubscribing and resubscribing.
- About the data: every source with a link, how the score works, its limitations, privacy, and the One Health framing.
Prior art and what's new
Citizen creek reporting isn't new: IBM Research's 2010 Creek Watch app, whose name we honour, showed that a photo plus a few plain questions helps water managers (CHI 2011). OneAquaHealth's own app does guided assessments today. Creek Watch adds three things for two real creeks in California's Sierra foothills. It fuses each report with live USGS stream-gauge, National Weather Service and Open-Meteo rainfall data into a 0–100 score that explains every point it gives or takes. It runs simple, transparent early-warning rules. And it's honest about a real monitoring gap: Wolf Creek has no live stream gauge, and Deer Creek's only one is 22 km downstream, below a reservoir. Local groups (Wolf Creek Community Alliance and Sierra Streams Institute) have run trained, lab-grade monitoring here for about 20 years; Creek Watch is the everyday layer between their samples, not a replacement. Full landscape: docs/devpost/PRIOR-ART.md.
Target users
- Residents, walkers, students and volunteer creek groups: the people already at the water, with no training needed.
- Teachers: a ready-made field activity that produces real data.
- City and county staff, watershed groups and researchers: an early, low-cost signal between scheduled samples, with photos for context. It doesn't replace lab monitoring.
Impact on ecosystem and human health (One Health)
Creek health, wildlife health and human health are linked. Storm runoff carries sediment and street pollutants into the same water where fish and birds live and where children and dogs play. Algal blooms can harm wildlife, pets and people. Sewage or chemical odours point to contamination that matters to everyone downstream. Creek Watch makes these links visible at the neighbourhood scale:
- Fills a real monitoring gap: in town, these creeks have no live instrument (see Inspiration). Many casual observers can report between official samples, and each report carries a photo.
- Explainable, not black-box: every score change says why, so residents and officials can trust it and act on it.
- Awareness and stewardship: filing a report teaches people what a healthy creek looks like.
- From noticing to doing: trash in creeks harms fish, birds and the people and dogs who use the water. The cleanup toggle and badges reward people who safely remove what they can, and the safety line steers them away from needles, chemicals and large items.
How we built it
All code was written new for this hackathon on October 3–4, 2026, during the extended submission window (before the October 4, 9:00 pm PDT deadline).
- Backend: Python 3.12, FastAPI and SQLite, run with uv. One process serves the JSON API (
/api/*) and the static web app. Photo uploads are re-encoded with Pillow (with HEIC support), which strips EXIF and caps the size. Enum validation, per-IP rate limiting and a geofence reject reports far from the creeks. - Frontend: a no-build progressive web app in plain HTML, CSS and ES modules, with Leaflet and OpenStreetMap tiles. It is mobile-first and installable, with light and dark themes.
- Data and score: creek lines and 12 public access sites were built from OpenStreetMap (Overpass API). Each site was snapped to the open channel and checked for public access; road bridges with private banks are marked "view from the bridge only". Ingest modules pull USGS stream-gauge readings (discharge and gage height from the new USGS Water Data API and legacy NWIS Water Services, with either one as a fallback for the other), National Weather Service current conditions from station KGOO (Nevada County Air Park) plus gridpoint short forecasts for each town, and Open-Meteo hourly rainfall estimates for the past and next 24 h. All are keyless, and the results are cached. A transparent, weighted, rule-based score combines them with recent citizen reports. Each signal records its name, value, weight, explanation and source. There are 341 automated Python tests (217 for the backend: API, alert store, feeds, push and security; 124 for data: ingest, the score, the alert sources and the river and bacteria history) and 7 headless-browser test suites for the web app. All pass (
uv run pytestandnpm testintests/web, checked 2026-10-03 on commit 0bcd363). - Honest gauge mapping: a USGS site-inventory query over the area returns only 4 active real-time stream gauges. Deer Creek uses 11418500, which is on Deer Creek but 22 km downstream and regulated. Wolf Creek has no live gauge (former station 11423150 holds only 3 water-quality samples), so Bear River near Wheatland (11424000) is shown as low-weight regional context only. The score says so in its explanations rather than pretending a distant gauge describes the creek in town.
- Deploy: a Docker container on an AWS Graviton (arm64) EC2 instance in us-west-1, shipped with Kamal 2 (kamal-proxy terminates TLS with Let's Encrypt; images in Amazon ECR). It has hourly database and photo backups to S3 (restore-drilled) plus daily AWS Backup snapshots of the server, at https://creekwatch.realm.watch. It moved there from a home server on October 4, 2026; the URL didn't change.
- Team prior work: the team already runs Forage for All, an open-source (AGPL-3.0) community map of edible plants on public land, built with privacy-first design: fuzzy locations by default, anonymous reports allowed, no trackers. Creek Watch carries over those principles (locations rounded to about 110 m, photo metadata stripped, optional names). No code was reused. Creek Watch is a separate codebase written for this hackathon.
- AI assistance: the code and docs were written with AI coding assistants (Anthropic's Claude, via Claude Code) under human direction and review. The demo video's narration is text-to-speech reading the team's script. The app itself uses no AI in the scoring: the score is deterministic rules, so every result can be explained.
Data sources
| Source | What we use | Terms |
|---|---|---|
| Citizen reports (Creek Watch users) | Photos and observations | Submitted by users. EXIF stripped, names optional |
| USGS Water Services (waterservices.usgs.gov) | Discharge (cfs) and gage height (ft), provisional. Deer Creek: 11418500 near Smartsville, about 22 km downstream and regulated by Lake Wildwood. Wolf Creek: no live gauge; Bear River near Wheatland 11424000 as low-weight regional context only | U.S. public domain (USGS policy) |
| National Weather Service API (api.weather.gov) | Temperature, short forecast, chance of precipitation | Public domain (NWS disclaimer) |
| Open-Meteo (open-meteo.com) | Rain in the past and next 24 h: gridded model estimates, not a rain gauge | CC BY 4.0; free API for non-commercial use, and this project is non-commercial |
| Volunteer water tests via RiverDB | Latest dissolved oxygen, pH, temperature, turbidity, conductivity and E. coli from local monitoring groups: South Yuba River Citizens League (Deer Creek above and below Nevada City, monthly, 2022 to 2026-08-08; fetched live, cached 24 h), Sierra Streams Institute (19 Deer Creek sites, 2000–2023), Wolf Creek Community Alliance (Wolf Creek, 2017–2019, background only) | The groups' own publicly published data, credited by name on every reading. These are periodic samples, not live sensors |
| NWS alerts (api.weather.gov/alerts) | Active water- and weather-related alerts at our sites | Public domain; linked, never reworded in meaning |
| NOAA National Water Prediction Service (api.water.noaa.gov/nwps) | River flood categories at forecast gauges in range (few have flood stages near us) | NOAA, public domain |
| State Water Board sewage spills (spill data file) | Spills reported near our creeks | Public data, self-reported by the sewer agencies; linked |
| CA freshwater harmful algal blooms (data.ca.gov, HABs portal) | Caution/Warning/Danger advisories | State Water Board, public domain |
| OEHHA fish-consumption advisories (data.ca.gov) | Standing advisories for local waters, each linked to OEHHA | Public domain; text not reproduced, link only |
| CEDEN, via the California open data portal (fecal indicator bacteria results) | The 2024 Regional Board E. coli study on Wolf Creek, shown as dated history | State Water Board public data; the portal lists no licence; credited "Central Valley Regional Water Quality Control Board via CEDEN" |
| CDEC, California Department of Water Resources (cdec.water.ca.gov) | South Yuba River flow at Jones Bar (JBR) and Englebright Lake storage (ENG), as regional context | State public data, credited to DWR CDEC and linked. Readings can lag by several hours, and each shows its observation time |
| OpenStreetMap (openstreetmap.org) | Base map tiles; creek lines and access sites (via Overpass API) | © OpenStreetMap contributors, ODbL. Attribution shown on the map |
Details and retrieval URLs: data/SOURCES.md.
Challenges we ran into
- There's no live gauge where the people are. Wolf Creek has no real-time USGS stream gauge at all, and Deer Creek's only one is about 22 km downstream, below Lake Wildwood. Instead of passing off a distant gauge as local truth, we show the Bear River gauge as low-weight background only and say so in the score's explanations. That gap became the reason the app exists.
- An unreliable federal API, mid-build. USGS's legacy NWIS Water Services returned intermittent HTTP 503s and took 0.6–7.6 s. We added the new USGS Water Data (OGC) API, which gave identical values in about 0.25 s, and made it the primary with NWIS as the fallback. A cold conditions lookup went from 4–8 s to about 0.9 s.
- Finding the right creeks and safe spots. California has several Wolf Creeks and Deer Creeks, and Wolf Creek runs in a culvert under downtown Grass Valley. We built the creek lines from OpenStreetMap with a "within 0.5 km of the town centre" check, snapped every site onto the open channel, and marked road bridges with private banks as "view from the bridge only". Two spots from our original plan turned out wrong: one park is 0.56 km from the creek, and another is on a tributary.
- Photo privacy, including iPhone HEIC. Phone photos carry GPS and device metadata. The server re-encodes every upload from raw pixels to a JPEG of at most 1600 px, which removes all EXIF. We tested it with real iPhone HEIC samples that carry GPS: the output had no EXIF and no GPS, and was correctly rotated. Public report locations are rounded to about 110 m.
- Fair rate limits behind Cloudflare. Behind the tunnel, every request looks like it comes from one address. We trust Cloudflare's client-IP header only when it arrives from the local proxy. We also set separate global budgets so junk requests can't use up the capacity that real reports need.
- A split-DNS TLS bug on our own network. Chrome on our home network failed with
ERR_SSL_PROTOCOL_ERRORwhilecurlworked. We traced it to local DNS rewriting the address but passing through Cloudflare's HTTPS (SVCB) record and its ECH settings. Disabling just that DNS feature in the browser fixed it. Phones on cellular were never affected, and the fix belongs in the local DNS, not the app. - The name. "Creek Watch" was also the name of a 2010 IBM Research app. We checked: that app is no longer available, and we found no live trademark. We kept the name and credit IBM's work openly (prior art).
Accomplishments we're proud of
- A live, public, phone-usable prototype, not a mockup, at https://creekwatch.realm.watch, with real data from USGS, NWS, Open-Meteo, OpenStreetMap and local volunteer monitoring groups.
- Ready for the field. The report flow has passed an end-to-end test at phone size over the public Cloudflare path, the same path a phone on cellular uses, and our teammate's first real field reports from Wolf Creek and Deer Creek begin on the morning of Sunday, October 4, 2026. The live map shows every report filed so far.
- A health score that explains every point it gives or takes, built from simple fixed rules and covered by automated tests (341 Python tests plus 7 browser suites).
- Honest about what we can't measure: the gauge gap and the model-based rain estimates are stated in the app, not hidden.
- A working water-alert hub: on the evening of October 3, 2026, all eight alert sources were loaded and reporting successfully on the live site, and every CAP alert in the live feed passed validation against the OASIS CAP 1.2 schema.
- Credit where it's due: more than 20 years of local volunteer water tests (South Yuba River Citizens League, Sierra Streams Institute, Wolf Creek Community Alliance) appear next to citizen reports, credited by name.
What we learned
- Small creeks, the ones people actually walk beside, are often the least instrumented. Citizen observations aren't a gimmick there; they're the only near-real-time signal.
- An explanation beats a number. A score people can check by hand ("brown water plus heavy rain, so a runoff watch") is easier to trust than a model's output.
- Check the ground truth before you map it. Two of our first spots were wrong (one off-creek, one on a tributary), and only checking each spot against the map caught it.
- Public data needs a plan B. A federal API can return 503s on a Saturday, and credits and licences (CC BY 4.0, ODbL) are part of the work, not an afterthought.
- Real monitoring already exists. Local groups have sampled these creeks for about 20 years. The useful thing to build is the everyday layer between their samples, not a replacement for them.
What's next for Creek Watch
- Partner with local creek volunteer groups to calibrate the score against their monitoring. Their published tests already appear on each creek card, via RiverDB.
- Add more creeks, offline report queueing for spots with no signal, and SMS or email alerts.
- Spanish and other languages.
- Export reports in open, standard formats so other platforms (such as the OneAquaHealth hub tools) can use them, and publish observations to Stroud's open-source Monitor My Watershed portal.
- Show iNaturalist wildlife sightings near each site, through its public API.
- Add a Creek Watch layer inside the team's Forage for All community map, and build an Expo/native version of the report flow.
Team
- Jeffrey "JP" Hein: Sierra College student and full-stack developer. Design and development.
- Alec: student. Field reports, writing, and testing.
Built With
- amazon-ec2
- amazon-web-services
- atom
- cap-1.2
- cdec
- ceden
- claude-code
- docker
- fastapi
- html5
- javascript
- kamal
- leaflet.js
- national-weather-service-api
- open-meteo
- openstreetmap
- pillow
- playwright
- pwa
- python
- sqlite
- usgs-water-services
- uv
- vapid
- web-push


Log in or sign up for Devpost to join the conversation.