ContractMap
Turning isolated grid plans into shared opportunities.
Try it: https://contractmap.onrender.com
Inspiration
Have you ever wondered what happens to the crane working on your building once the job is done? It goes back to the yard and sits there until someone calls for it again.
Now scale that up to the power grid. Utilities plan transmission lines and substations years in advance, and they often do it in isolation, even when their sites are only a few miles apart. Dominion Energy South Carolina and Georgia Power face each other across the Savannah River. Each one mobilizes its own crews, trucks its own equipment in, sets up its own laydown yard, and closes its own lanes on the same roads, sometimes in the same months.
This isn't a hypothetical problem. In 2024, FERC issued Order No. 1920 because planning in isolation has led to duplicated work, waste, and delays in building a reliable grid. Sperry Tech's GridLock Challenge asked us to find where these plans collide. We wanted to go one step further and make those collisions useful.
What it does
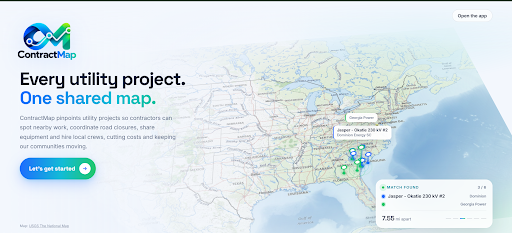
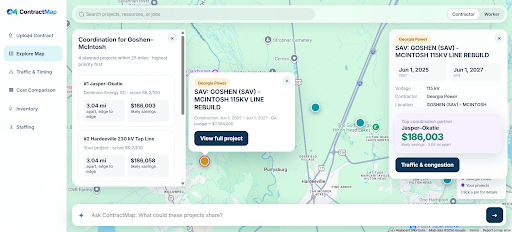
ContractMap reads the public construction plans of Dominion Energy South Carolina (DESC) and Georgia Power (GPC), places every project on an interactive map, and finds where their work overlaps in space and time. It then ranks those overlaps by how much coordination is actually worth.
The challenge, requirement by requirement
| Challenge requirement | What we built |
|---|---|
| Ingest public plans from at least 2 utilities | Parsed 182 real projects (44 DESC, 138 GPC) directly from the SCRTP filing and Georgia Power's IRP Ten-Year Transmission Plan PDFs |
| Geographic overlap within 40 km, measured closest point to closest point | Edge-to-edge distance between line and substation geometries, computed in UTM 17N, not center-to-center |
| Proximity tiers | Touching/crossing, then under 1.6 km (shared right-of-way), under 8 km (shared laydown), and under 40 km (shared crews) |
| Timeline overlap as a secondary signal | Construction-window overlap in months, plus detection of pairs that would overlap if one schedule moved by up to 12 months |
| Interactive UI highlighting overlaps | Full-screen pan/zoom/click map with both utilities, overlap links, and project detail cards |
| Ranked list of top opportunities | 55 cross-utility overlaps ranked on a 100-point score |
| Bonus: cost/impact estimate | Sourced savings range for every flagged pair, broken into mobilization, hauling, shared land, and traffic delay |
Our #1 opportunity is Jasper-Okatie ↔ McIntosh-Purrysburg. The two projects are 4.89 km apart with 24 months of overlapping construction, and we estimate about $127K in savings (range $35K to $374K) from coordinating them.
We also validated the engine against the answer key: from Sperry's 10 starter projects it reproduces exactly Sperry's 6 overlaps, with the correct distances and time gaps.
Beyond the brief: built for the people doing the work
Finding overlaps is useful to planners. We wanted it to be useful to contractors and crews too, because they are the ones who would actually share the crane.
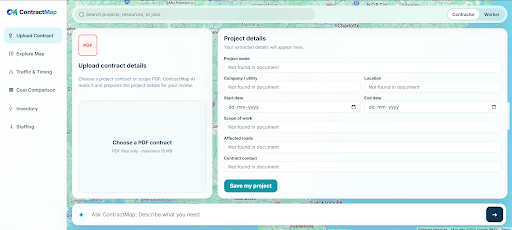
- Upload a contract, get a project. Drop in a contract PDF and ContractMap extracts the project name, location, dates, scope, and roads, with evidence quotes. You review and edit the record, then it's placed on the map and matched against every other company's planned work.
- Ranked coordination partners. Each match shows its proximity tier, timing fit, and a savings range with named sources.
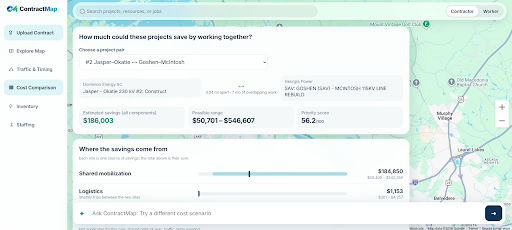
- Predicted savings. A live cost sandbox compares working separately against working together, and you can adjust the assumptions yourself.
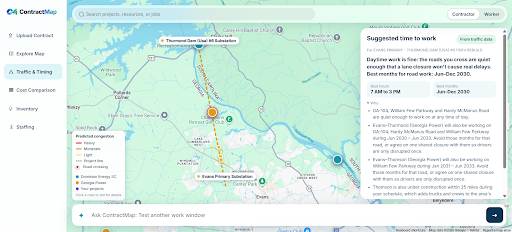
- Congestion and "best time to work." Our work-zone traffic model uses real SCDOT and GDOT traffic counts to find the roads your line crosses, predict the backups a lane closure would cause, recommend the best closure hours, and flag months when other nearby projects will be on the same roads.
- Smart inventory. Based on what your project needs (from the contract, or typical needs for that type of work), ContractMap suggests equipment listed by other companies nearby and scores each listing on fit, availability dates, distance, and whether the owner is already one of your coordination partners.
- Staffing and a worker job board. Contractors post jobs. Workers can search roles on a map and apply, so a lineworker whose crew is idle between contracts can pick up days on a nearby project.
- Messaging and an AI assistant. Companies can discuss a shared cost scenario directly. A Gemini assistant answers questions and drafts listings, and every change it proposes waits for the user to confirm it.
ContractMap turns separate plans into shared opportunities: for contractors cutting costs, for utilities meeting FERC's coordination goals, and for workers who want steady work.
How we built it
Data pipeline. We parsed DESC's "Project N of 44" filing and Georgia Power's Table 2 plus its 208 project detail pages. We split project titles into their endpoints (for example, GOSHEN (SAV) - MCINTOSH 115KV) and located each substation using OpenStreetMap, with fuzzy name matching, region anchors, and a manual review sheet for ambiguous locations near the river. Counties come from the FCC Area API.
Our core rule: numbers come from code, words come from Gemini. Every distance, date, score, and dollar figure is computed by deterministic code. Gemini only reads messy text and writes explanations, and we check its output: any number in its text must appear in the facts it was given, and any ID must come from a real tool result.
The math
1. Distance. Lines and substations are projected to UTM Zone 17N, and we measure the shortest distance between any point p on project A and any point q on project B:
$$d = \min \lVert p - q \rVert$$
A pair is flagged when this distance is under 40 km (25 mi). Sperry's center-point rule, using haversine distance, is kept as a cross-check.
2. Timeline overlap. If project 1 runs from s1 to e1 and project 2 runs from s2 to e2 (dates in days), the overlap in months is:
$$m = \max\left(0, \frac{\min(e1, e2) - \max(s1, s2)}{30.44}\right)$$
3. Opportunity score (out of 100). The score combines three parameters, proximity, savings, and timing:
$$\text{Score} = P + V + T$$
Proximity (up to 40 points):
$$P = B \cdot \left(1 - \frac{\min(d, 40)}{80}\right)$$
Savings (up to 40 points):
$$V = 40 \cdot \min\left(\frac{S}{0.05 \cdot C}, 1\right)$$
Timing (up to 20 points), when the construction windows overlap (m > 0):
$$T = 20 \cdot \frac{\min(m, 12)}{12}$$
If they don't overlap but would with a schedule shift of 12 months or less, T = 6. Otherwise T = 0.
Here B is the tier base (40, 34, 26, or 14 depending on the proximity tier), S is the estimated savings, and C is the smaller of the two project budgets. Pairs scoring 60 or above are labeled high potential, and 35 or above moderate.
4. Savings estimate. Every component is reported as a low / point / high range:
$$S = \text{mobilization} + \text{hauling} + \text{land} + \text{traffic}$$
$$\text{mobilization} = C \cdot p \cdot f$$
$$\text{hauling} = 2 \cdot n \cdot c \cdot \max(0, D - 1.2x)$$
Here p is the mobilization share of a budget (4 to 10%, MoDOT benchmark), f is the fraction of mobilization that can be shared (25 to 50%), n is the number of truckloads, c is the trucking cost per mile ($2.336, ATRI), D is the typical haul distance from the yard in miles, and x is the distance between the two sites in miles (the 1.2 factor converts straight-line distance to road distance). Shared right-of-way (land) is the length of one line inside a 1.6 km buffer around the other, multiplied by the MISO corridor width for its voltage, and valued at USDA farmland prices.
5. Traffic delay. We use a deterministic input-output queue with hourly demand from real traffic counts:
$$q(h+1) = \max\left(0, q(h) + \lambda(h) - \mu\right)$$
$$\text{Delay} = \sum \frac{q(h) + q(h+1)}{2}$$
Here q(h) is the queue (vehicles) at the start of hour h, λ(h) is the traffic arriving in hour h, and μ is the work-zone capacity (1,600 vehicles per hour times the number of open lanes). Summed over all hours with one-hour steps, the delay comes out in vehicle-hours. Delay is converted to dollars at the USDOT value of $29.15 per vehicle-hour. We try every possible start hour to find the least disruptive closure window. This delay cost is the traffic term in the savings estimate.
Machine learning, used only where the data supports it
- Construction duration: a random forest trained on 205 Georgia Power projects with filed start and in-service dates. It fills in Dominion's missing start dates, with a typical error of about 8.5 months, and beats a median baseline (5-fold CV, repeated 10 times).
- Project cost: ridge regression on log(cost), trained on 44 Dominion budgets, to estimate Georgia Power's redacted budgets and missing contract budgets. Its typical error is about 47%, and it beats simple baselines under the same cross-validation.
Every prediction is labeled "predicted," shows a range, and never overrides a date or budget that appears in a filing or contract. We deliberately did not train a ranking model, because no data yet exists on which coordinations actually happened. Instead, the app collects planner feedback so that a ranking model can be trained on real outcomes later.
Stack: a Python/FastAPI backend with Shapely and PyProj for geometry, scikit-learn for the models, MongoDB Atlas for storage, and Gemini for language tasks, deployed on Render. The frontend is HTML/CSS/JavaScript with Google Maps and PDF.js for in-browser contract parsing. The backend has 171 automated tests.
Challenges we ran into
- The data lives in PDFs. Neither utility publishes coordinates, so we reconstructed project locations from substation names in two differently formatted filings.
- Substation names are ambiguous. "McIntosh" or "Goshen" can match more than one place. We added cross-checks, including a requirement that a match in the other state must sit in the river border band, plus a human review sheet.
- Georgia Power budgets are redacted, so we had to estimate costs without making up numbers. That's why we built the cost model and show every estimate as a range.
- Keeping AI honest. We wanted Gemini's convenience without letting it invent figures, so we built guards that reject any number it didn't get from our engine.
- Deploying a heavy backend. The road network, traffic model, and ML models live in memory (about 435 MB), which exceeded Render's smaller plans. We moved to a larger instance, precomputed congestion in the background, and added a read-only fallback so the map still works if the database is unreachable.
Accomplishments that we're proud of
- A pipeline that turns two regulatory PDFs into 182 mapped projects and 55 ranked opportunities, and matches Sperry's answer key exactly.
- A savings estimate where every constant cites a real source (MoDOT, ATRI, BLS, MISO, USDA, USDOT) and every assumption is labeled as one.
- Extending the challenge from "where do the plans overlap?" to "who shares the crane, who fills the crew, and when should we close the road?"
What we learned
- Geospatial work is harder than it looks. Projections, closest-point geometry, and messy place names each took real effort.
- It's worth being honest about what ML can and can't do. The best model is sometimes the one you decide not to train.
- Utility planning is a coordination problem as much as a technical one. The value only appears when the people doing the work can see each other's plans.
What's next for ContractMap
- Add more utilities and move DESC's data to SERTP-published sources as its transition completes.
- Collect real construction dates and costs from contractors to improve the models.
- Train an opportunity-ranking model on real coordination outcomes from planner feedback.
- Replace straight-line routes with real transmission corridors from HIFLD data.
- Add verified company accounts and equipment reservations with real contracts.
Built With
- css
- fastapi
- gemini
- google-maps
- html
- javascript
- mongodb-atlas
- openstreetmap
- pandas
- pdf.js
- pyproj
- python
- render
- scikit-learn
- shapely


Log in or sign up for Devpost to join the conversation.