-
-
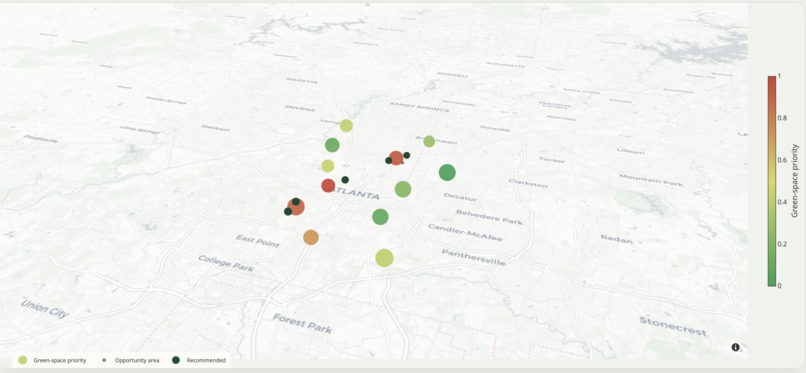
3D Map
-
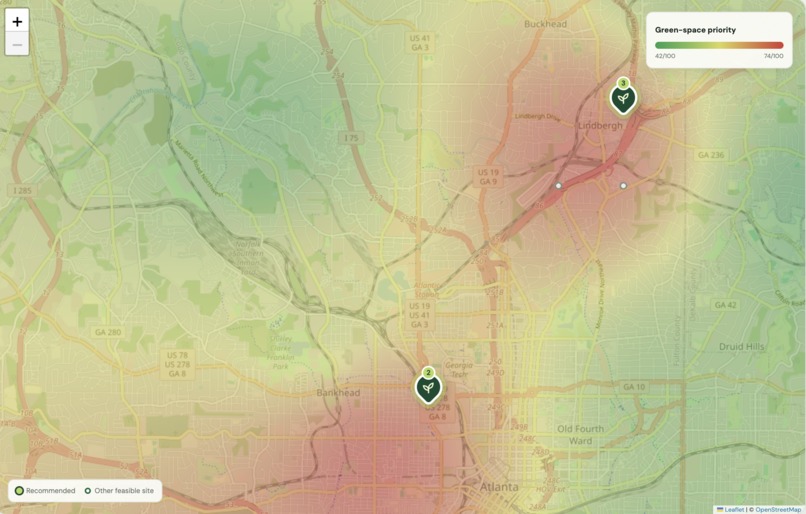
Heatmap

GreenGrid
Putting green space where the city needs it most
A data-driven platform that turns a capital budget into an optimal, equity-aware portfolio of green-space sites for Atlanta.
| At a glance | |
|---|---|
| Data sources | 3 live, public feeds — Census ACS, OpenStreetMap, Landsat |
| Backend | 1 FastAPI server — REST API + static frontend in one process |
| Core logic | Set-based coverage, so no resident is double-counted |
| Coverage | Built and tested on real Atlanta data |
Inspiration
Parks, plazas, greenways, and tree canopy are not handed out evenly across Atlanta. Whole neighborhoods sit on the wrong side of that distribution, carrying heavier urban heat, thinner access to nature, and fewer of the open, shaded, walkable places where kids and families gather. Cities know they must invest, yet capital budgets are finite and unforgiving: every misallocated dollar quietly becomes years of delayed access for precisely the communities that can least afford to wait.
The tools that already exist, such as ParkServe and Tree Equity Score, are genuinely useful, but each one looks through a single lens and answers a single question at a time. What we kept running into was the absence of anything that could hold the whole picture at once — weighing equity, existing park access, demographics, urban heat, and ecological pressure together, and then saying plainly where new green space would do the most good. That gap is the reason GreenGrid exists.
What it does
GreenGrid is a planning platform that answers a deceptively simple question: given a fixed budget, where should a city build? A planner enters a capital budget, and GreenGrid returns the optimal portfolio of candidate sites across the city, deliberately accounting for overlapping coverage so that two neighboring parks never get credit for serving the same residents twice.
Underneath each recommendation sits a green-space priority score, assembled from park-access gaps, equity need, urban-heat burden, and ecological factors. Crucially, planners are never asked to trust a black box: every one of those layers can be peeled back and viewed on its own across the map, so it is always clear what is actually driving a recommendation in any given neighborhood. Each selected site arrives with a cost estimate and a short rationale for what it should prioritize — whether that is cooling a heat-vulnerable block, draping canopy over an impervious surface, or closing an access gap in an underserved community.
How we built it
The platform runs as a single FastAPI service that ingests three real data sources, fuses them into a per-block-group score, hands that score to an optimizer, and serves the resulting map to the browser, all from one process.
        DATA SOURCES                      FastAPI BACKEND                        FRONTEND
   ┌────────────────────┐
   │     Census ACS     │
   │    OpenStreetMap    │ ──┐
   │   Landsat imagery   │   │
   └────────────────────┘   │
                            ▼
                  ┌──────────────────┐   ┌──────────────────┐   ┌──────────────────┐
                  │   Block-group    │ ▶ │  Site-selection  │ ▶ │   Leaflet map    │
                  │  priority score  │   │    optimizer     │   │  IDW + layer     │
                  │  (4 weighted     │   │   (set-based     │   │     toggles      │
                  │    factors)      │   │    coverage)     │   │                  │
                  └──────────────────┘   └──────────────────┘   └──────────────────┘
        harmonize  →           weight  →            optimize  →            visualize
The priority score. For each block group \(i\), four normalized pressures — an access-gap term \(A_i\), an equity-need term \(E_i\), a heat-burden term \(H_i\), and an ecological term \(G_i\) — combine into a single weighted score:
$$ P_i = w_1\,A_i + w_2\,E_i + w_3\,H_i + w_4\,G_i $$
| Factor | What it captures |
|---|---|
| Park access gaps | Residents who today live far from any existing park |
| Equity need | Historically under-resourced communities, by income and demographics |
| Urban heat burden | The block groups running hottest, drawn from Landsat thermal imagery |
| Ecological factors | Impervious surface and missing canopy that greenery would relieve |
The optimizer. Each candidate site \(s\) reaches a set of block groups \(R_s\) at cost \(c_s\). Given a budget \(B\), GreenGrid solves a budget-constrained maximum-coverage problem — choosing the portfolio \(S\) that maximizes total covered priority without spending past the budget:
$$ \max_{S \subseteq C}\ \sum_{i \in \bigcup_{s \in S} R_s} P_i \qquad \text{subject to} \qquad \sum_{s \in S} c_s \le B $$
The detail that matters is the \(\bigcup\): coverage is counted as a set union, not a running sum, so ==each block group contributes to the score exactly once== no matter how many nearby sites happen to reach it.
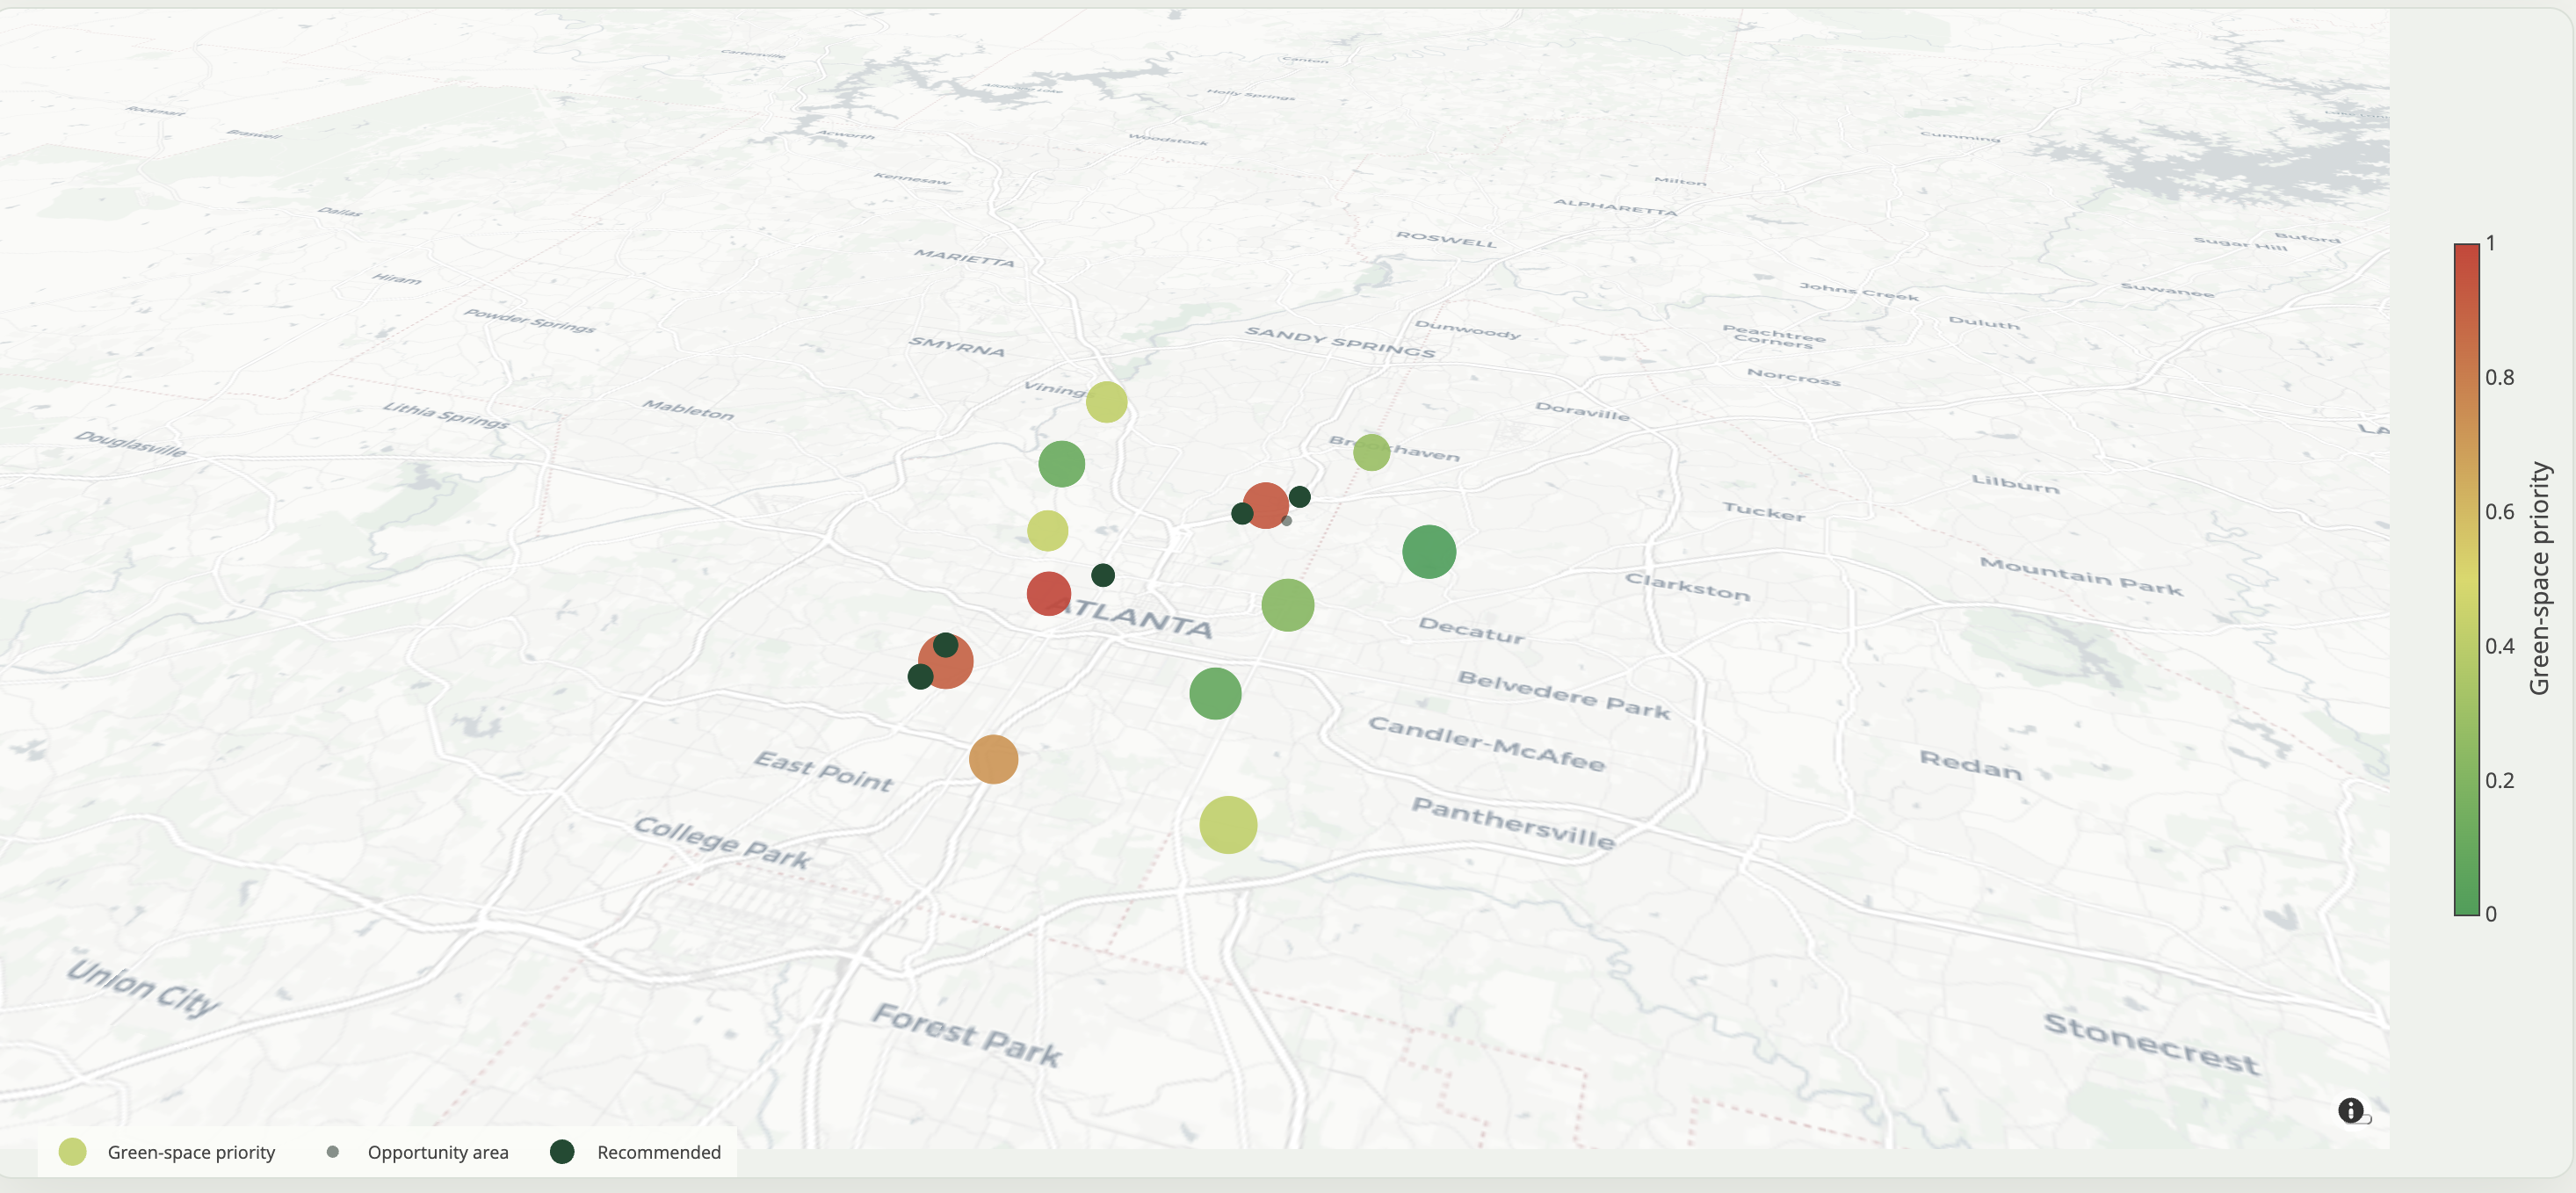
The frontend. On the client we leaned on Leaflet, rendering each demand block group as a colored circle marker sized by population, with a switchable IDW heatmap overlay so a planner can glide between a precise dot view and a smooth continuous surface. The same toggle machinery exposes the equity, heat, and access layers individually, turning the map into something closer to an investigative instrument than a static picture.
| Layer | Stack |
|---|---|
| Presentation | Leaflet · population-sized circle markers · switchable IDW heatmap · equity / heat / access toggles |
| Application | FastAPI — one server exposing the REST API and serving the static frontend together |
| Intelligence | Block-group priority scoring · set-based coverage optimizer · site-level AI insights |
| Data | Census ACS demographics · OpenStreetMap infrastructure · Landsat thermal imagery |
Goals for the city
Every layer in the model traces back to a concrete civic outcome. These are the goals GreenGrid is built to serve:
| Goal | What it means |
|---|---|
| Cool the hottest blocks | Direct shade and canopy to heat-vulnerable neighborhoods |
| Close access gaps | Reach residents who today live far from any park |
| Invest equitably | Prioritize historically under-resourced communities |
| Add living canopy | Replace impervious surface with greenery and tree cover |
| Space for kids & youth | Create recreational, gathering-friendly public places |
| Spend every dollar well | Maximize measurable impact under a fixed budget |
Impact on Atlanta
Atlanta faces a unique combination of rapid population growth, urban development pressure, unequal park distribution, and increasing climate-related heat challenges.
GreenGrid provides a practical framework for helping city leaders make more informed and equitable investment decisions.
Using publicly available data from Atlanta neighborhoods, GreenGrid can help decision makers:
| Challenge | How GreenGrid Helps |
|---|---|
| Unequal park access | Identifies underserved neighborhoods |
| Urban heat islands | Prioritizes heat-vulnerable communities |
| Limited public budgets | Maximizes impact per dollar spent |
| Development pressure | Preserves opportunities for future green space |
| Environmental inequity | Incorporates equity directly into recommendations |
Rather than relying solely on intuition or isolated metrics, GreenGrid enables city planners to evaluate environmental, social, and demographic needs simultaneously.
This creates a more transparent and data-driven process for allocating public resources while ensuring investments reach communities that have historically been overlooked.
Challenges we ran into
Two problems consumed most of the build. The first was data, not math. Pulling clean, trustworthy inputs from three very different worlds and then harmonizing them into one coherent scoring framework was a real grind: each source arrives in its own format, at its own resolution, along its own geographic boundaries, and none of it means anything until those mismatches are reconciled.
The second was keeping the optimizer honest. A naive objective simply sums every site's reach, which happily clusters parks on top of one another and counts the same residents again and again. Our set-based objective replaces that double-counting sum with a union,
$$ \text{value}(S) = \sum_{i \in \bigcup_{s \in S} R_s} P_i , $$
forcing the optimizer to spread impact outward across the city. Engineering that distinction was the algorithmic heart of the project.
What we learned
More budget did not always mean more sites. At $8M, the optimizer chose just four sites, favoring a single 19.5-acre parcel over a handful of smaller ones, because the math rewarded large-scale environmental impact over sheer quantity.
The deeper lesson was that the algorithm is rarely the hard part; the data is. Getting three real sources to align spatially, agree on resolution, and resolve into something coherent ate up most of our time. We also came to appreciate that optimization without constraints is easy and almost meaningless — the set-based coverage formulation is exactly what separates a recommendation that is genuinely useful from one that is merely optimal on paper. More broadly, we walked away with real conviction about how much civic impact is hiding inside publicly available data, waiting for someone to ask it the right question.
Accomplishments that we're proud of
What we are proudest of is unglamorous and important: GreenGrid works on real data. We ingested live Census demographics, OpenStreetMap green space, and Landsat thermal imagery for Atlanta and produced authentic, defensible recommendations. The set-based coverage logic makes those recommendations meaningful rather than clustered, the toggleable layers let anyone audit the reasoning behind a pick, and because every source is real and publicly accessible, a planner could carry these outputs straight into a budget meeting and stand behind them.
What's next for GreenGrid
- Harden the AI insights into consistent, actionable guidance for every site in a portfolio
- Scale beyond Atlanta — the same public data sources cover cities nationwide
- Earn adoption by real municipal planning departments, through city and community partnerships
Census ACS, OpenStreetMap, and USGS/NASA Landsat are all free and publicly available nationwide, which means these outputs can be reproduced and defended by anyone.
Built With
- census
- css
- duckdb
- fastapi
- geopandas
- html
- javascript
- landsat
- openstreetmap
- postgis
- python
- shapely
- uvicorn


Log in or sign up for Devpost to join the conversation.