What it does
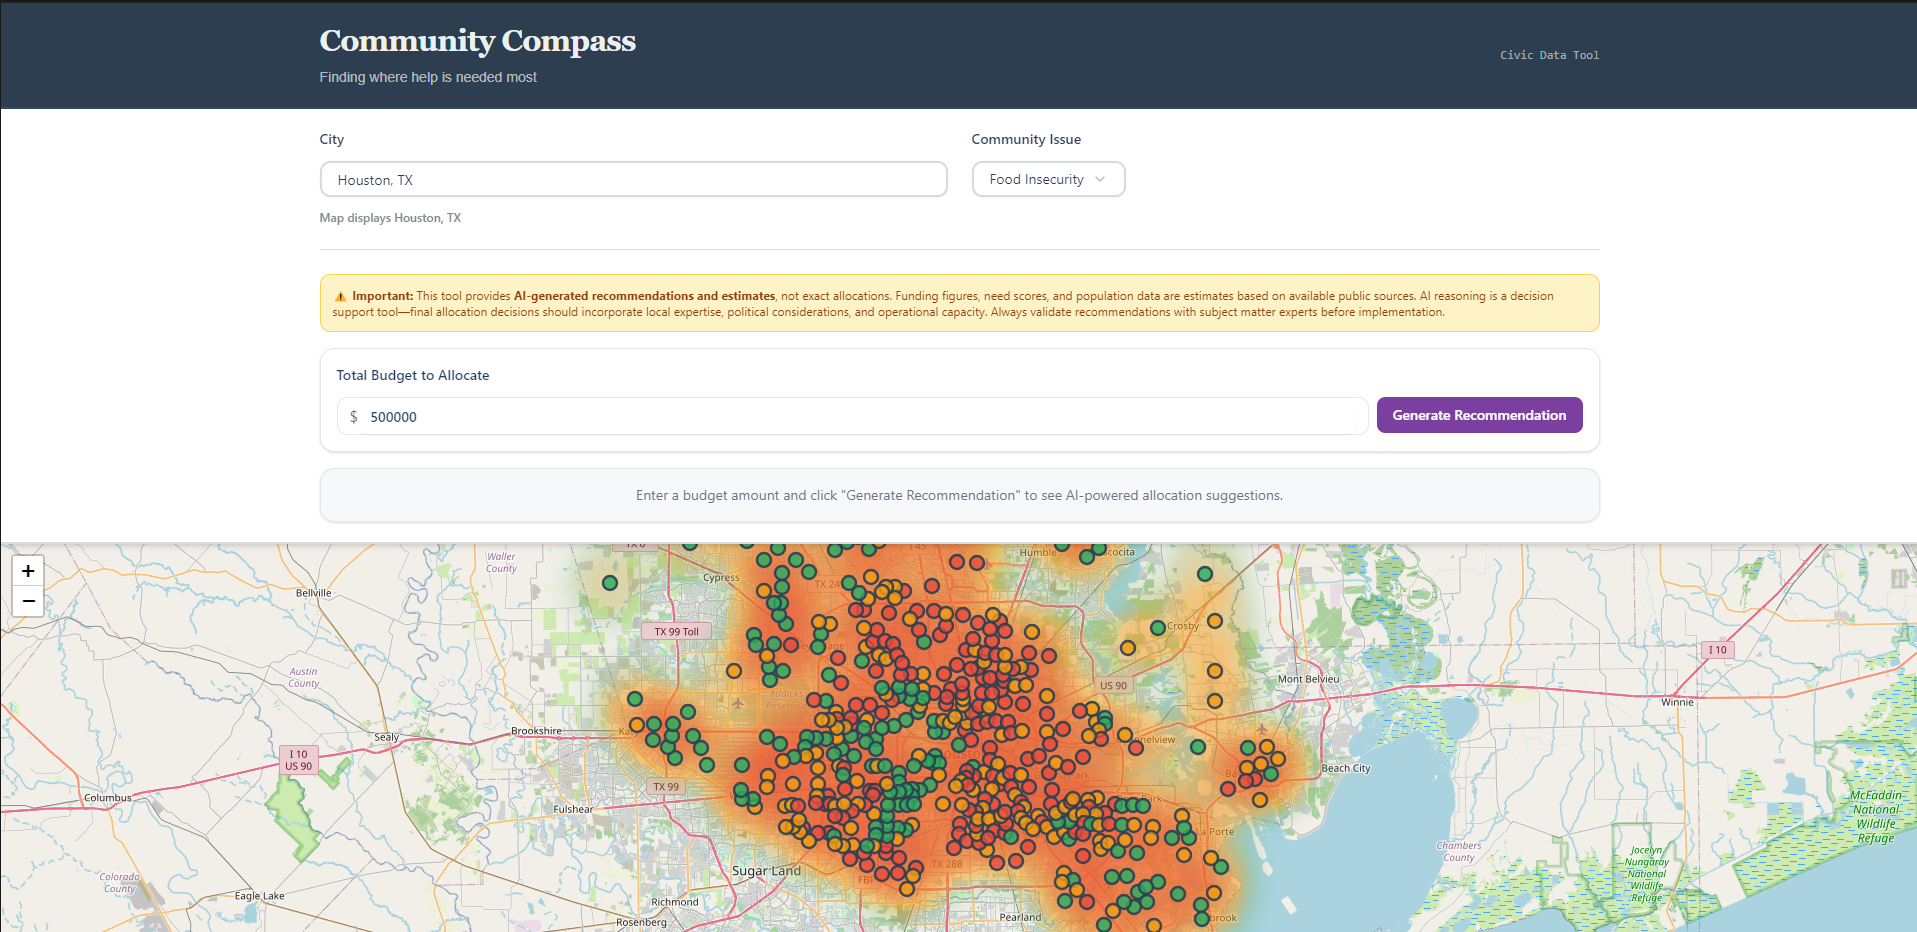
Community Compass is a live, AI-powered civic data tool that helps nonprofit coordinators and government officials find where community needs are highest — and figure out how to actually fund the response.
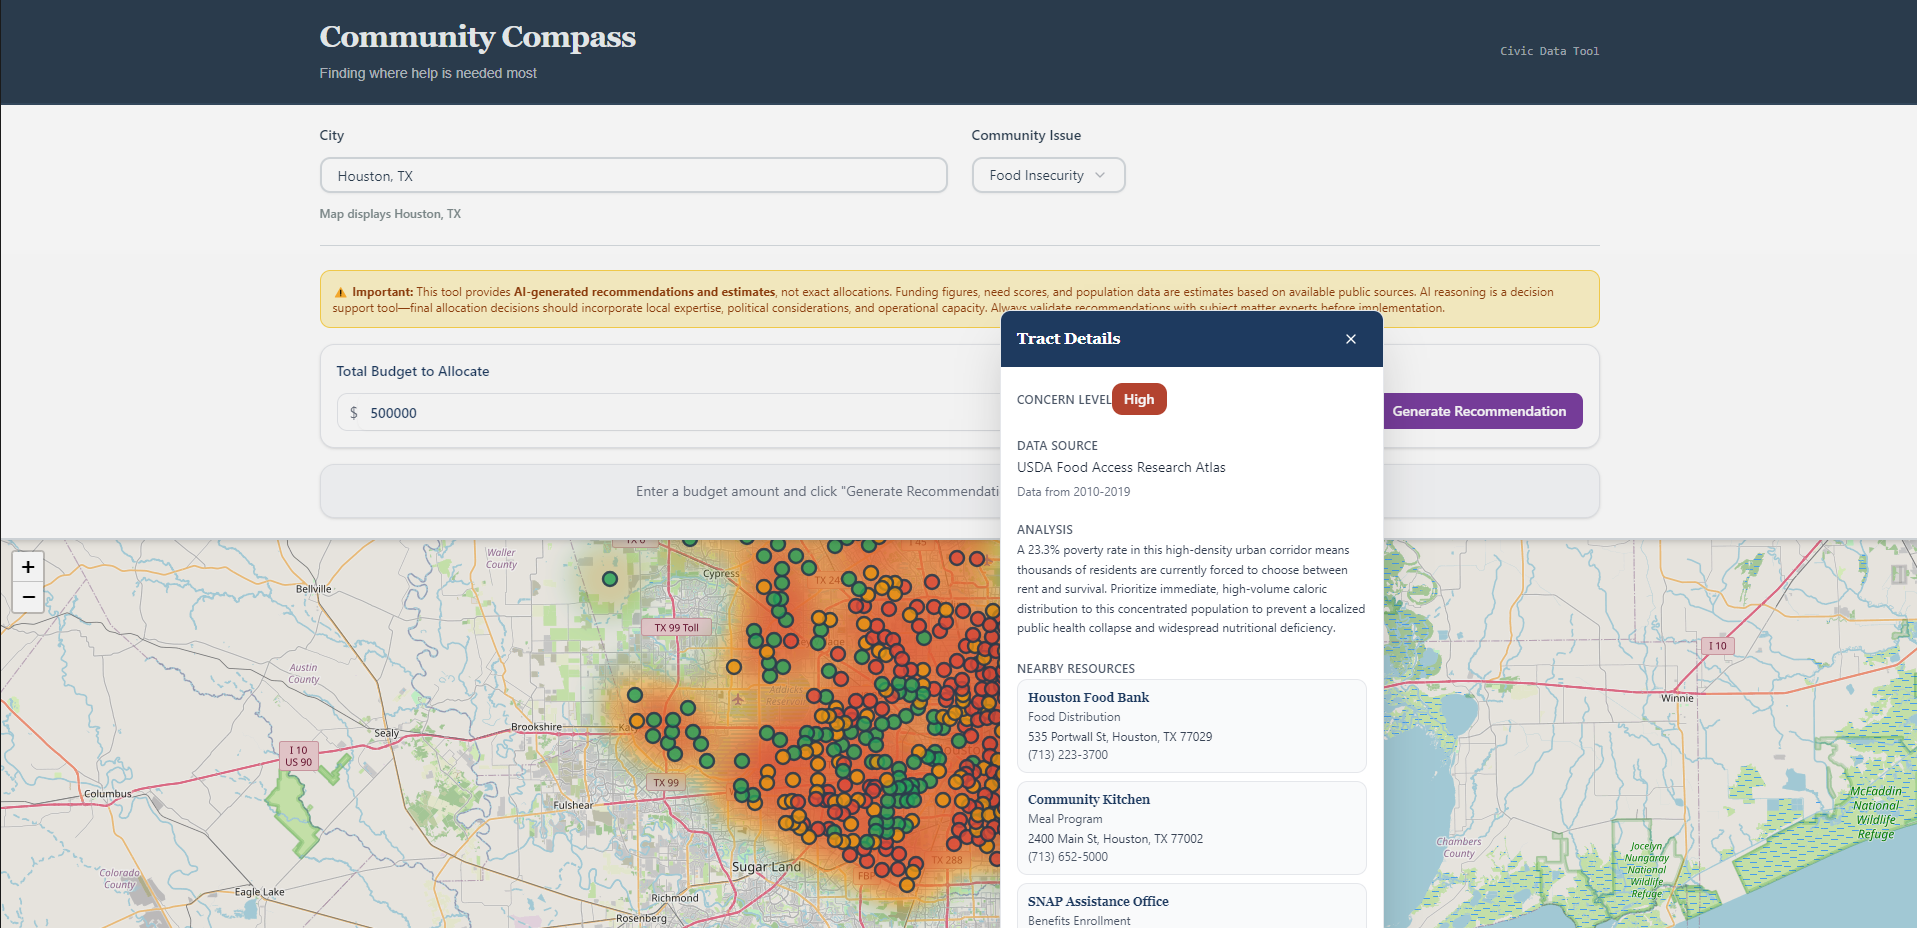
You pick a city and an issue. Our AI pulls from real federal public datasets — USDA, CDC, EPA, HUD — scans across every census tract at once, and generates an interactive heatmap showing where need is most concentrated. Red means critical. Green means low. Every area on the map has a plain-language explanation of why it was flagged and what data was used.
But knowing where the need is was only half the problem. The harder question is: given a limited budget, how do you actually split it up?
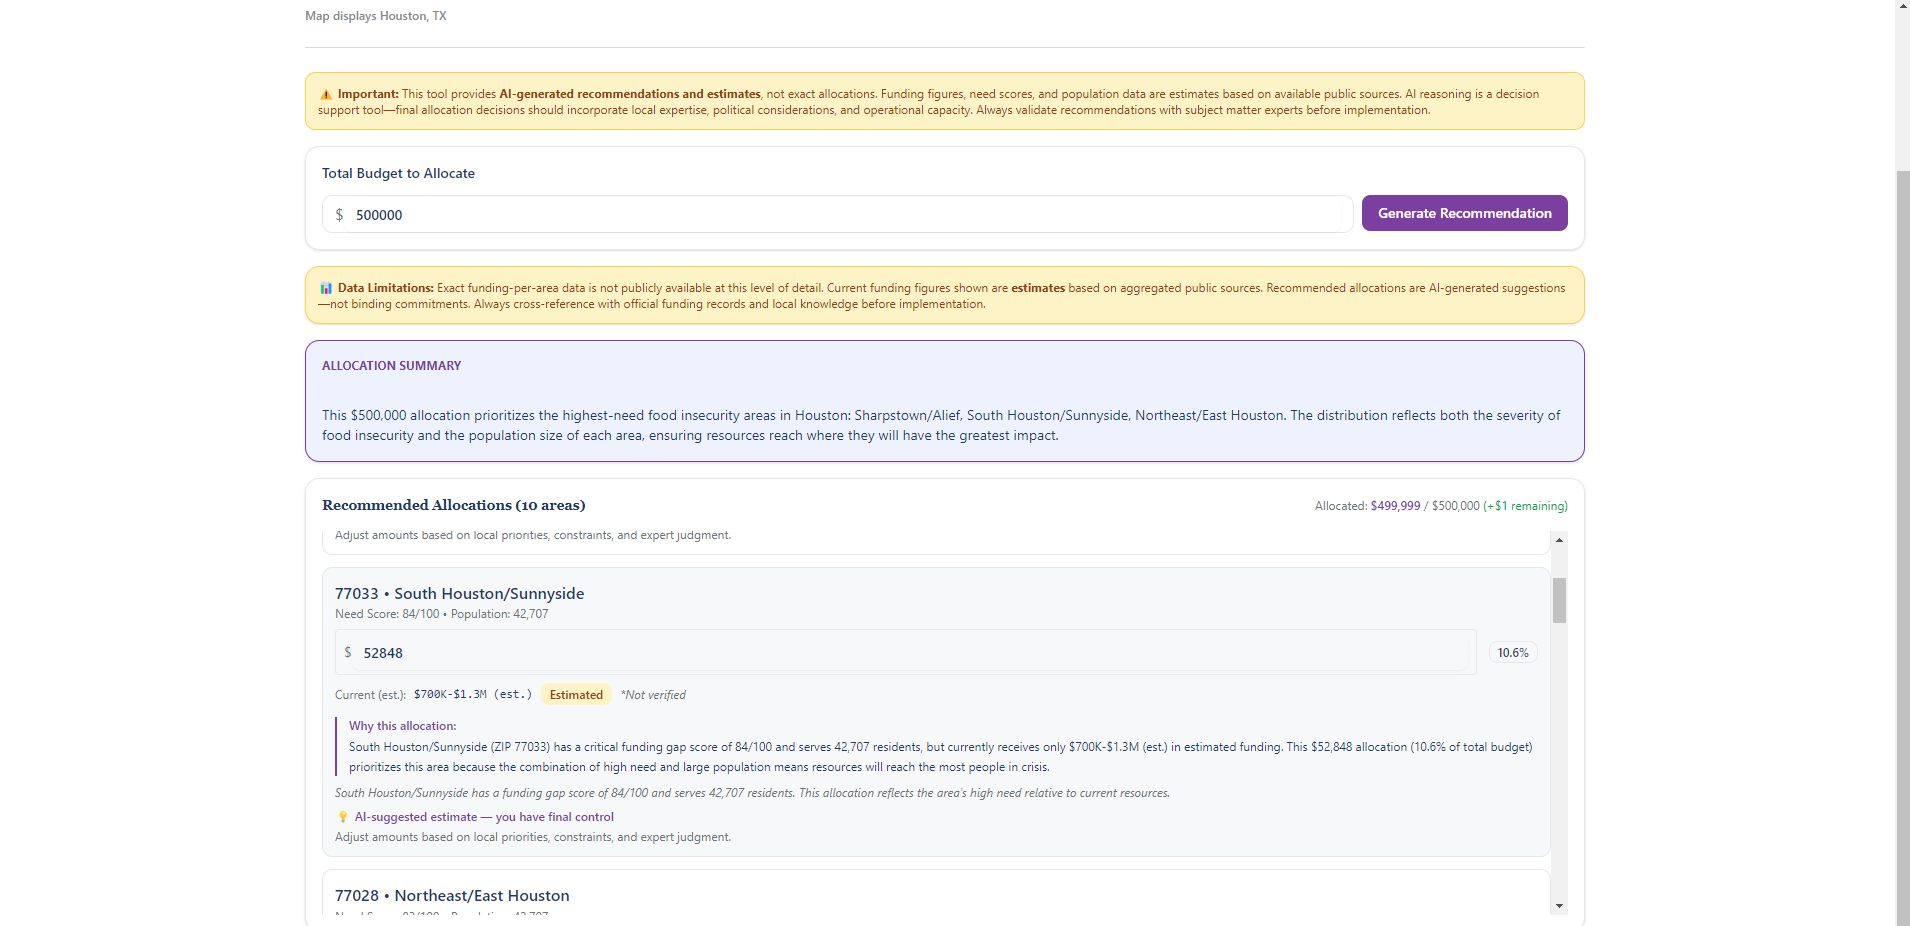
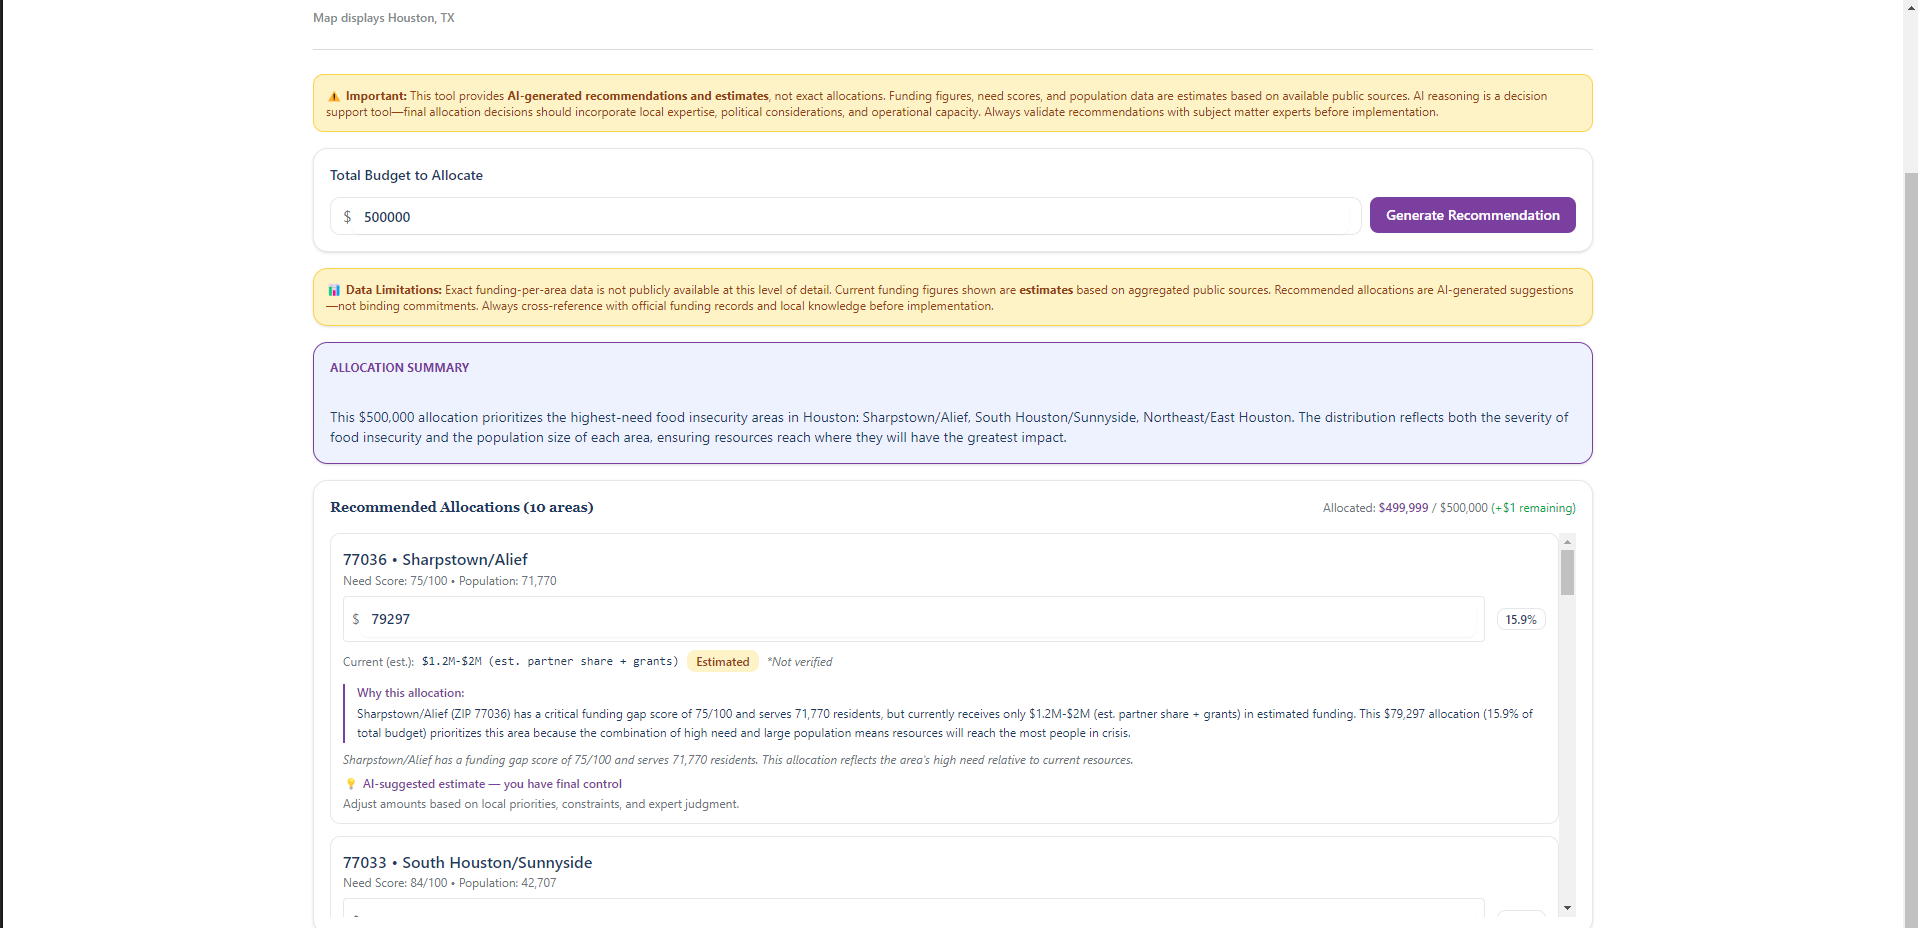
That's what our Smart Allocation Recommendations engine answers. A coordinator enters a dollar amount. Our AI calculates each area's share using a transparent formula — need score × population, normalized across all areas — and produces a ranked list of ZIP codes with how much each should receive and exactly why. Every amount is editable. The AI proposes. The human decides. That principle is baked into every layer of the tool.
We also built two transparency systems most tools skip entirely:
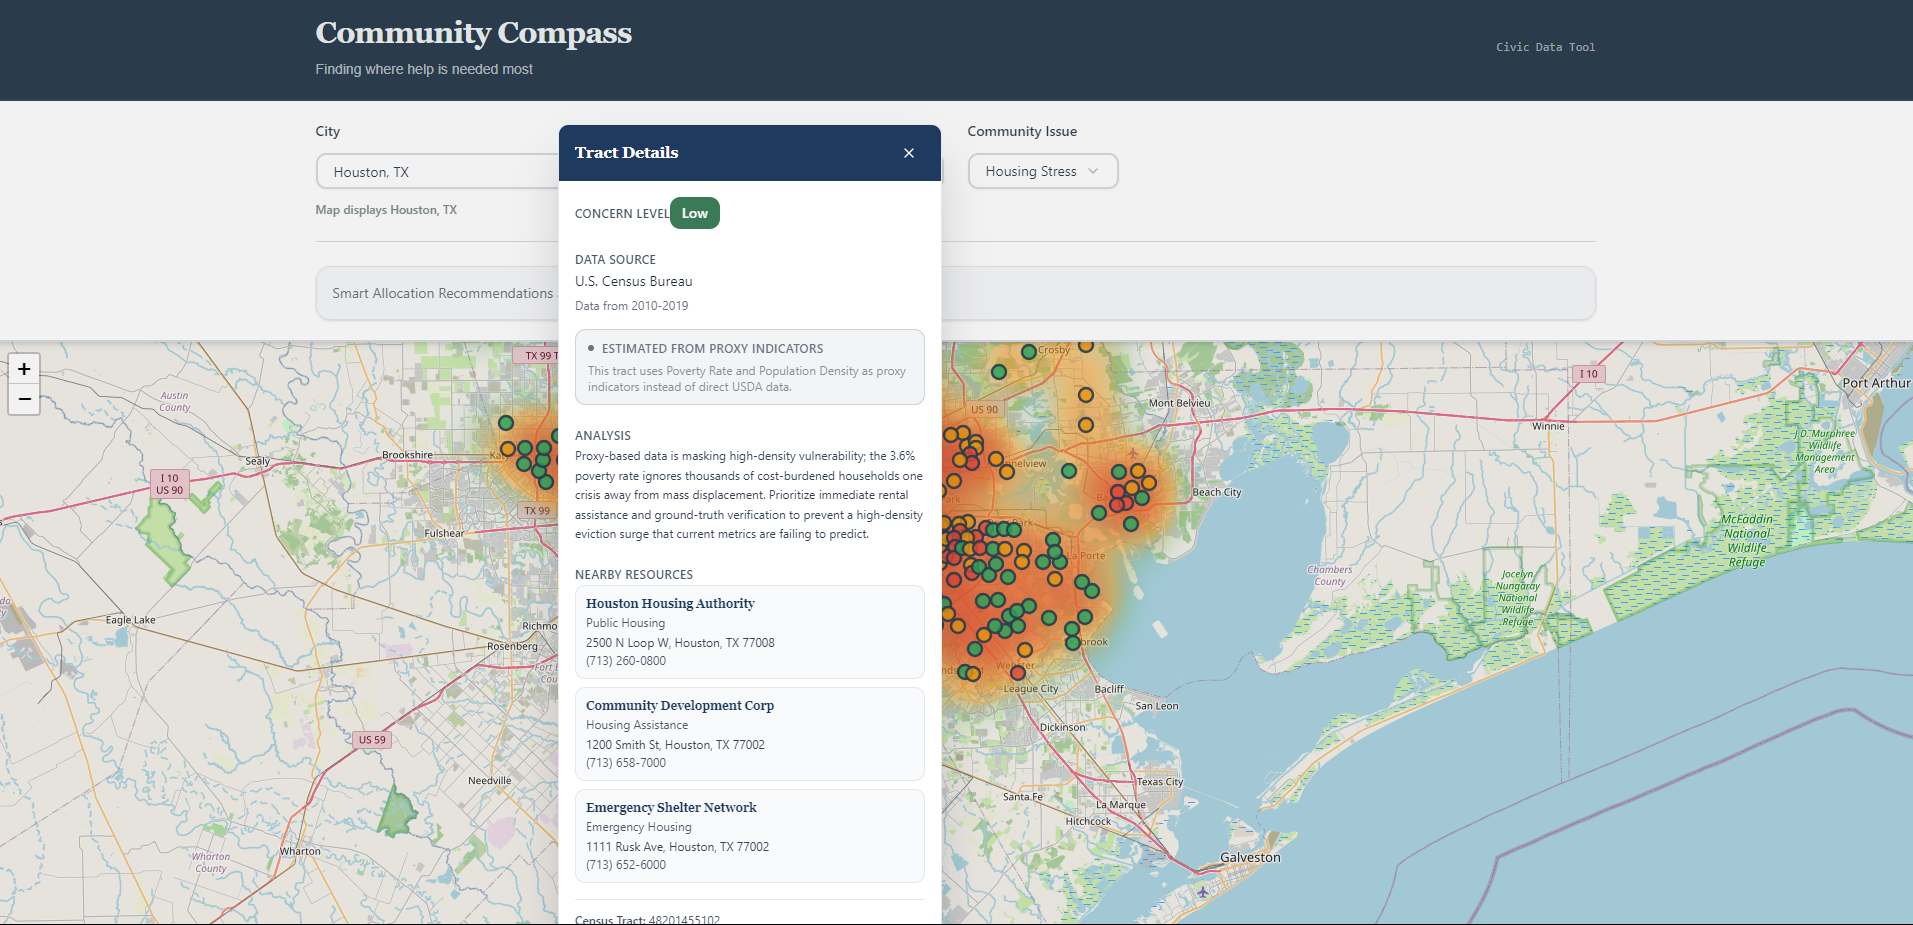
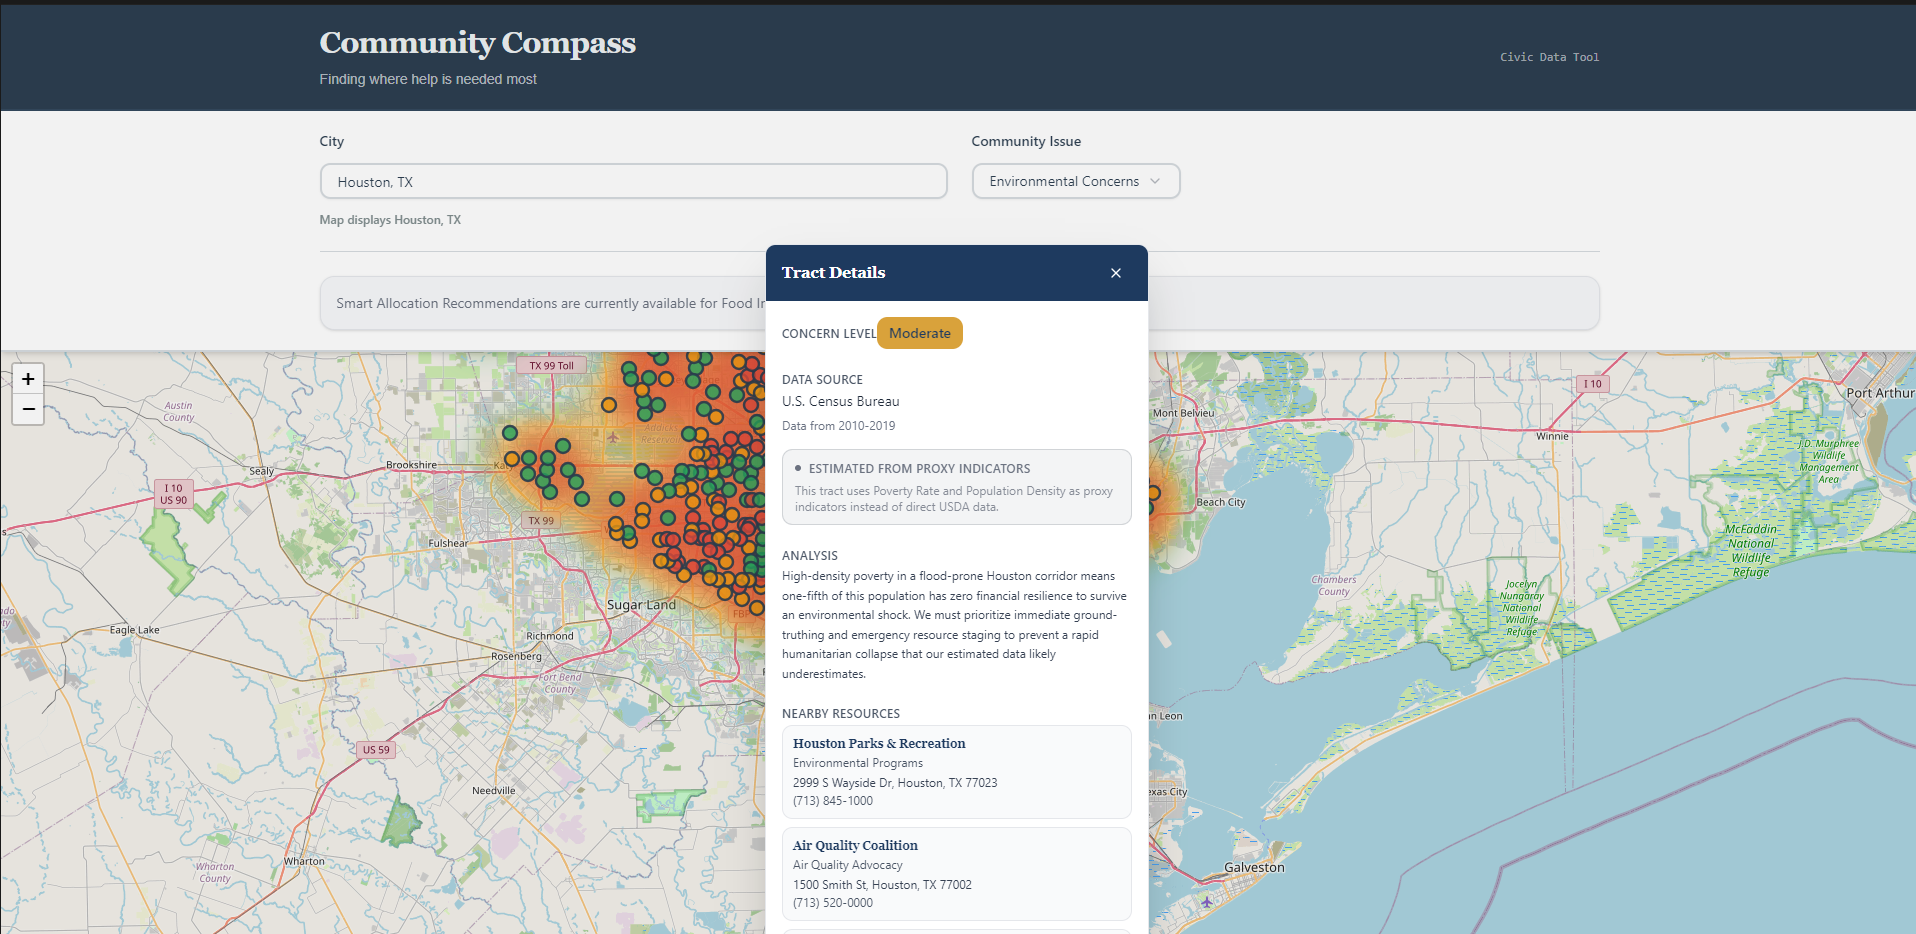
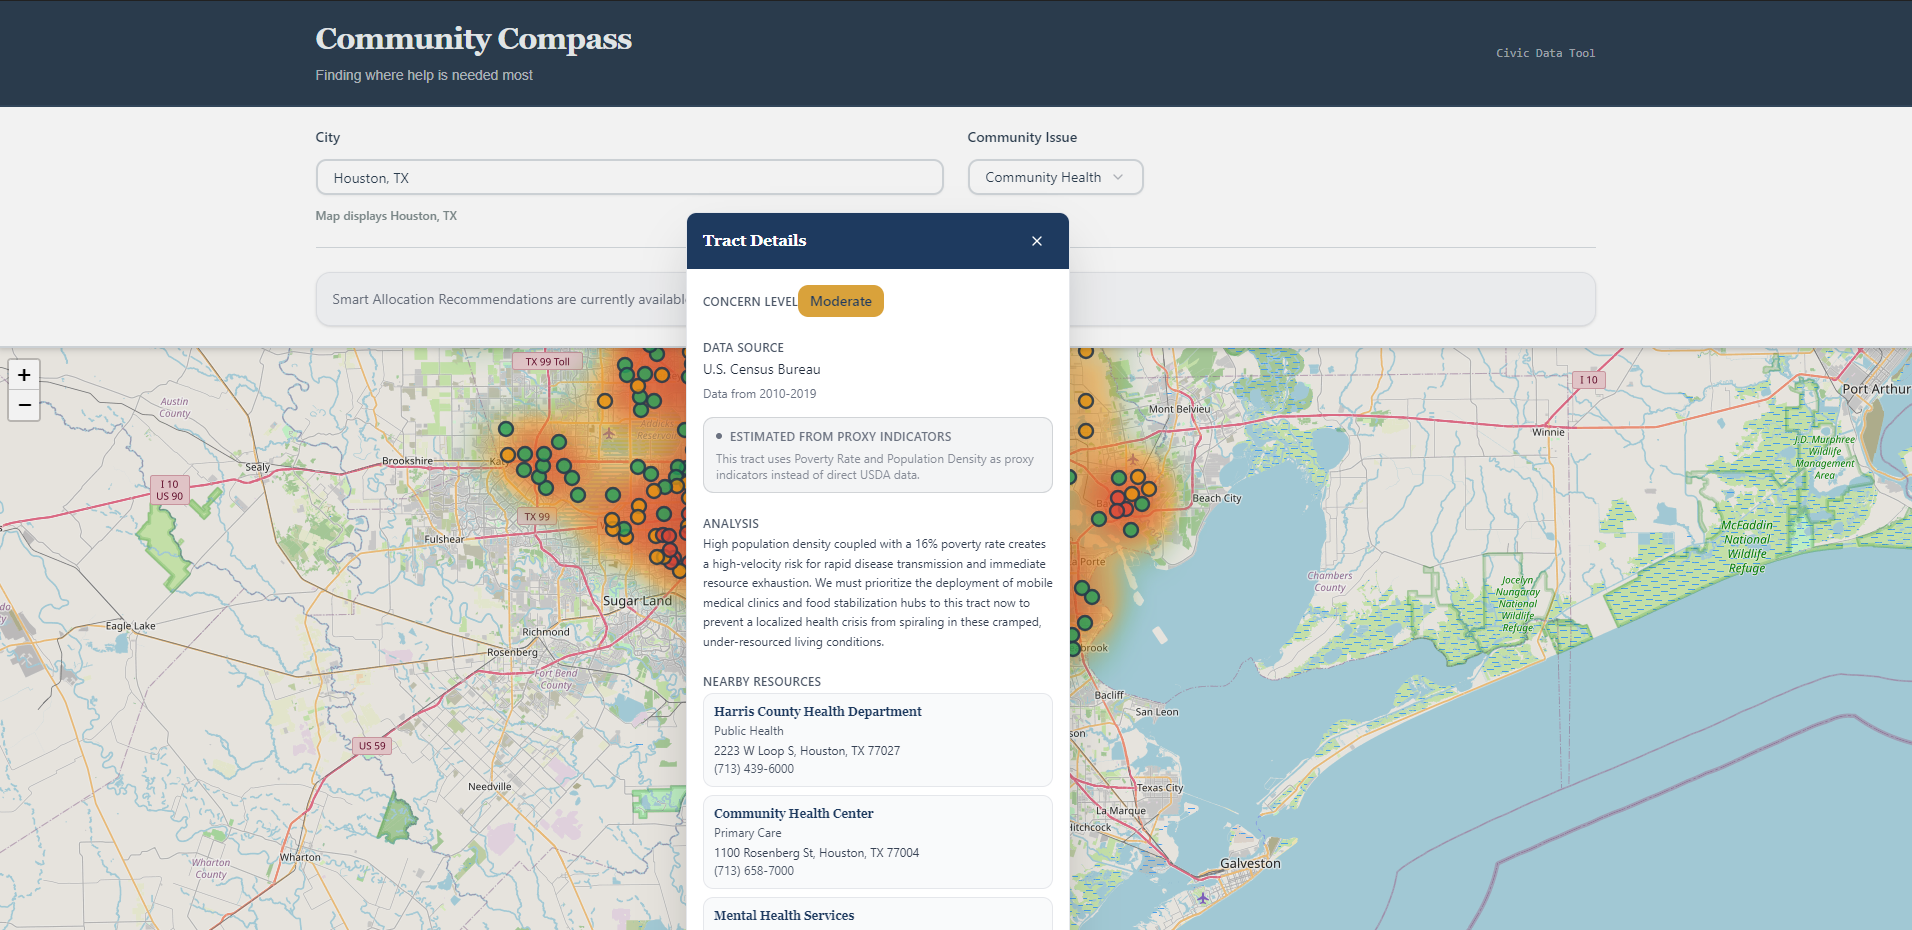
- Proxy data labeling — when direct data is missing for a neighborhood, we fill the gap using verified socioeconomic indicators (poverty rate, unemployment, population density) and mark those areas visibly as estimates. No neighborhood disappears just because its data is incomplete.
- Outdated data warnings — when underlying data is more than two years old, a visible flag appears before any resource decisions get made. A heatmap that hides its own uncertainty is more dangerous than no heatmap at all.
How we built it
We started with an implementation plan built using Manus AI, then vibe-coded the full application on top of it. The frontend is React 19 + TypeScript, styled with Tailwind CSS 4 and shadcn/ui. Maps are rendered with Leaflet.js on OpenStreetMap tiles. The API layer uses tRPC 11, and all Gemini calls are proxied through Netlify Functions so the API key never touches the client.
Data comes from the USDA Food Access Research Atlas, Census ACS, CDC PLACES, EPA EJScreen, and HUD housing data. For Houston's food insecurity ZIP-level scoring, we used the 2025 Food Insecurity Index from the Conduent Healthy Communities Institute via Houston State of Health.
The full heatmap covers 1,115+ Houston census tracts. The Smart Allocation feature is fully functional for Food Insecurity. Housing Stress, Environmental Concerns, and Community Health are UI-ready with a roadmap message — data pipelines are the next build phase.
Challenges we ran into
The hardest thing was deciding what to do about missing data. A lot of census tracts don't have complete issue-specific records — if we'd only shown areas where direct data existed, we'd have created a map that looked complete but had silent gaps exactly where coverage was worst. We built the proxy fallback system specifically to solve that, and then had to design the UI so coordinators could understand the difference between a direct reading and an estimate without needing to read a technical explanation.
Population data was the other headache. Some ZIP codes in our dataset had placeholders instead of numbers. We built a three-step fallback: use the number if it exists, query Census ACS if it doesn't, fall back to median population across all ZIPs if Census is unavailable. We never invent a number.
Accomplishments we're proud of
The proxy data transparency system. We didn't build it because it was easy — we built it because hiding uncertainty would have made the tool actively misleading. The fact that an area can simultaneously carry a concern level, a proxy-estimated flag, and an outdated data warning, and that we surface all three when that's true, is something we're genuinely proud of.
The Smart Allocation engine is the other one. It's not just showing patterns — it's doing constrained optimization across multiple variables (need, population, existing resources) and explaining every tradeoff in plain language. That's real AI reasoning, not a lookup table.
What we learned
We learned that responsible AI design isn't a checkbox at the end — it changes what you build from the start. The moment we committed to not hiding uncertainty, we had to rethink the whole data pipeline. And the moment we committed to human-in-the-loop allocation, we had to actually design the UI so overriding the AI was natural, not buried.
We also learned that "working" and "trustworthy" are different bars. Getting the heatmap to render was the easy part. Getting it to be honest about what it doesn't know took most of the work.
What's next
- Enable Smart Allocation for Housing Stress, Environmental Concerns, and Community Health
- Expand beyond Houston to other cities
- Add outcome tracking so coordinators can close the loop on whether allocations worked
- Build export functionality (CSV, PDF) for budget documentation
Built With
- 1.5
- access
- acs
- api
- atlas
- cdc
- census
- css
- data
- ejscreen
- epa
- food
- functions
- gemini
- housing
- hud
- leaflet.js
- manus
- openstreetmap
- places
- pnpm
- pro
- react
- research
- shadcn/ui
- tailwind
- trpc
- typescript
- usda
- vite


Log in or sign up for Devpost to join the conversation.