-
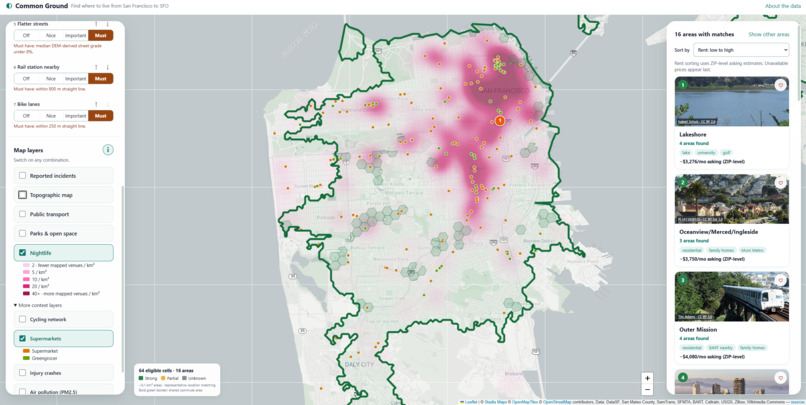
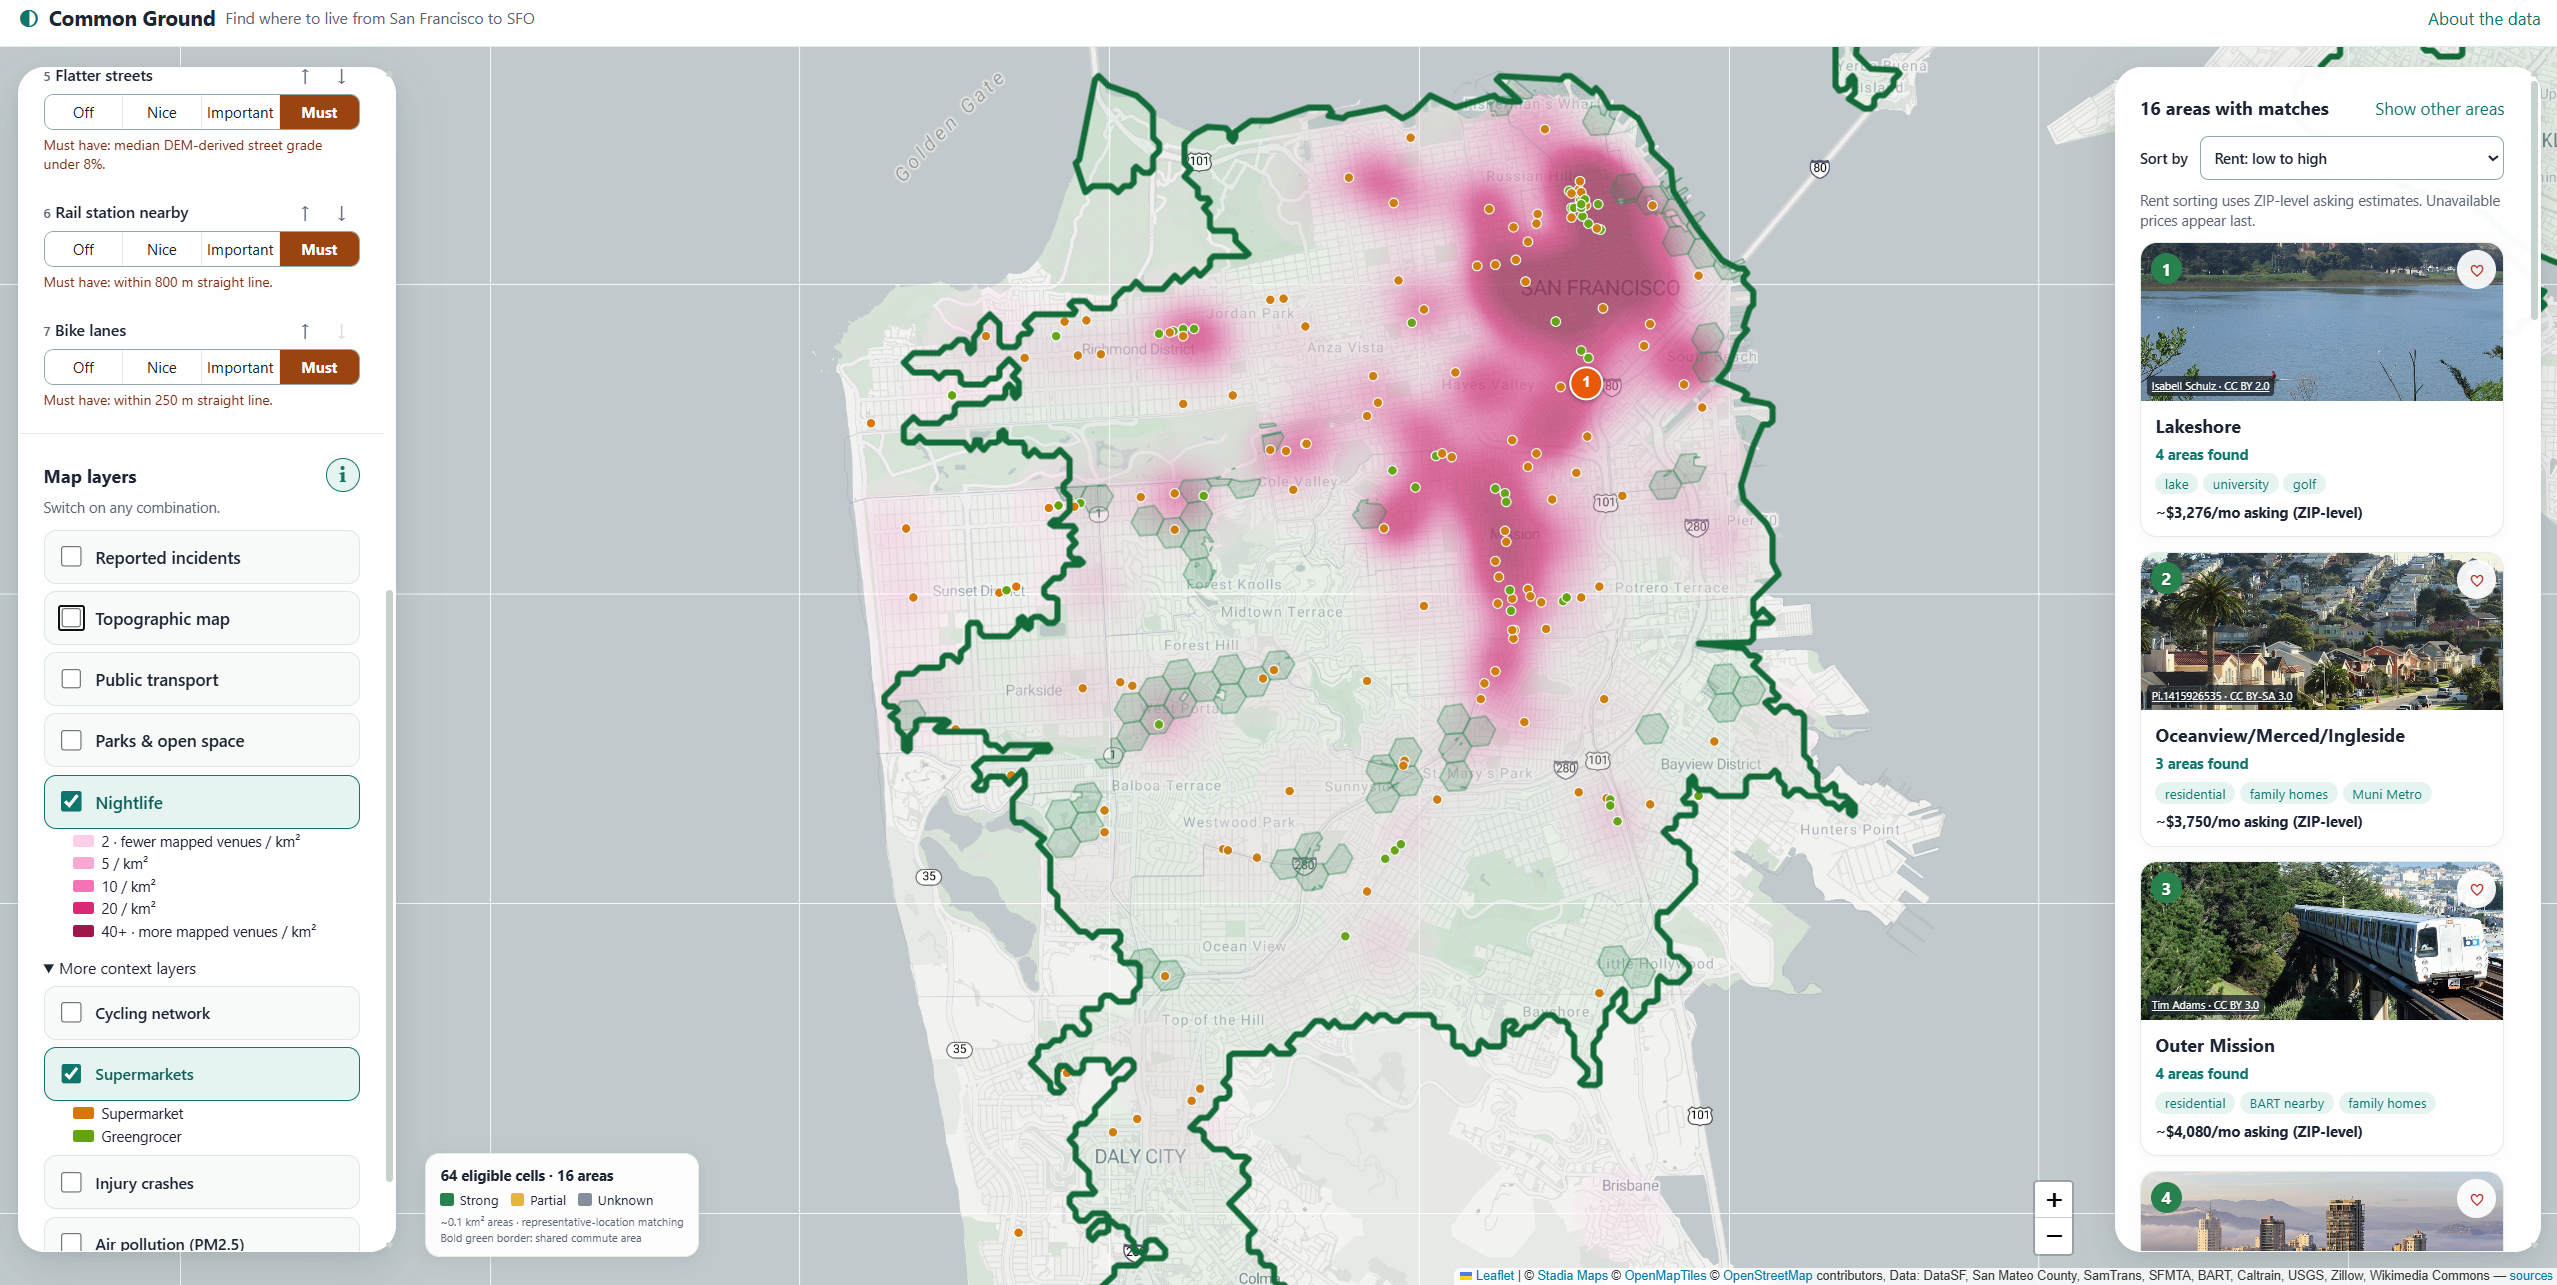
Heatmap of nightlife and Supermarket
-
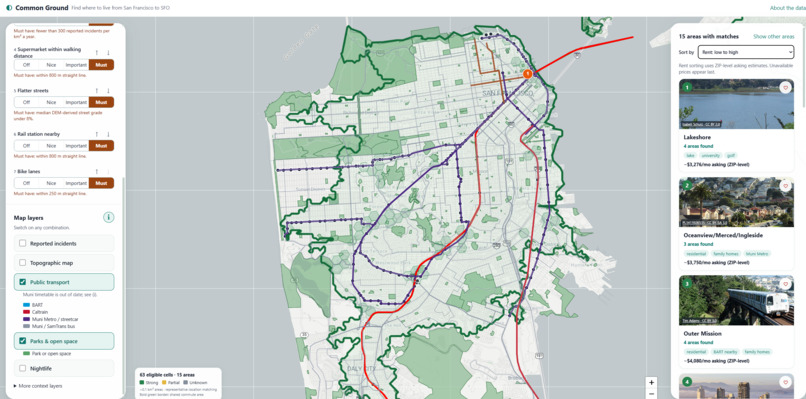
Public Transportation
-
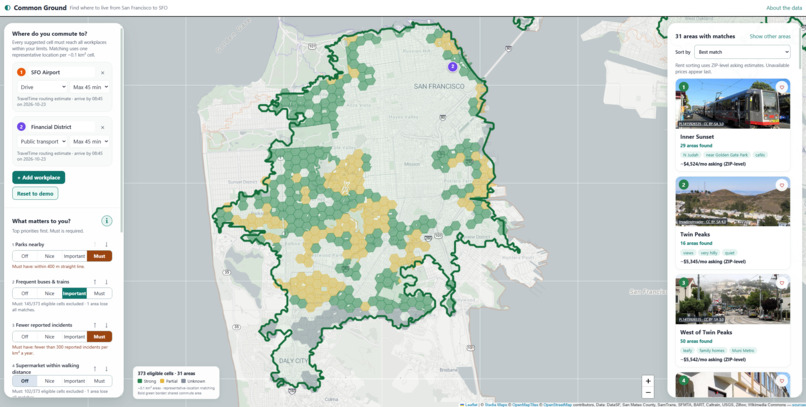
Recommended
Inspiration
Choosing where to live in San Francisco usually starts on a listings site, but the real question comes first: which part of the city actually works for us?
Couples and housemates have different commutes, San Francisco's hills make two blocks of the same neighbourhood feel completely different, and most "best neighbourhood" tools hide everything behind a single liveability score you can't question.
We wanted an honest, transparent area-discovery tool: commute first, your priorities second, and every number labelled for what it really is. It finishes by linking you to rental platforms instead of trying to be one.
What it does
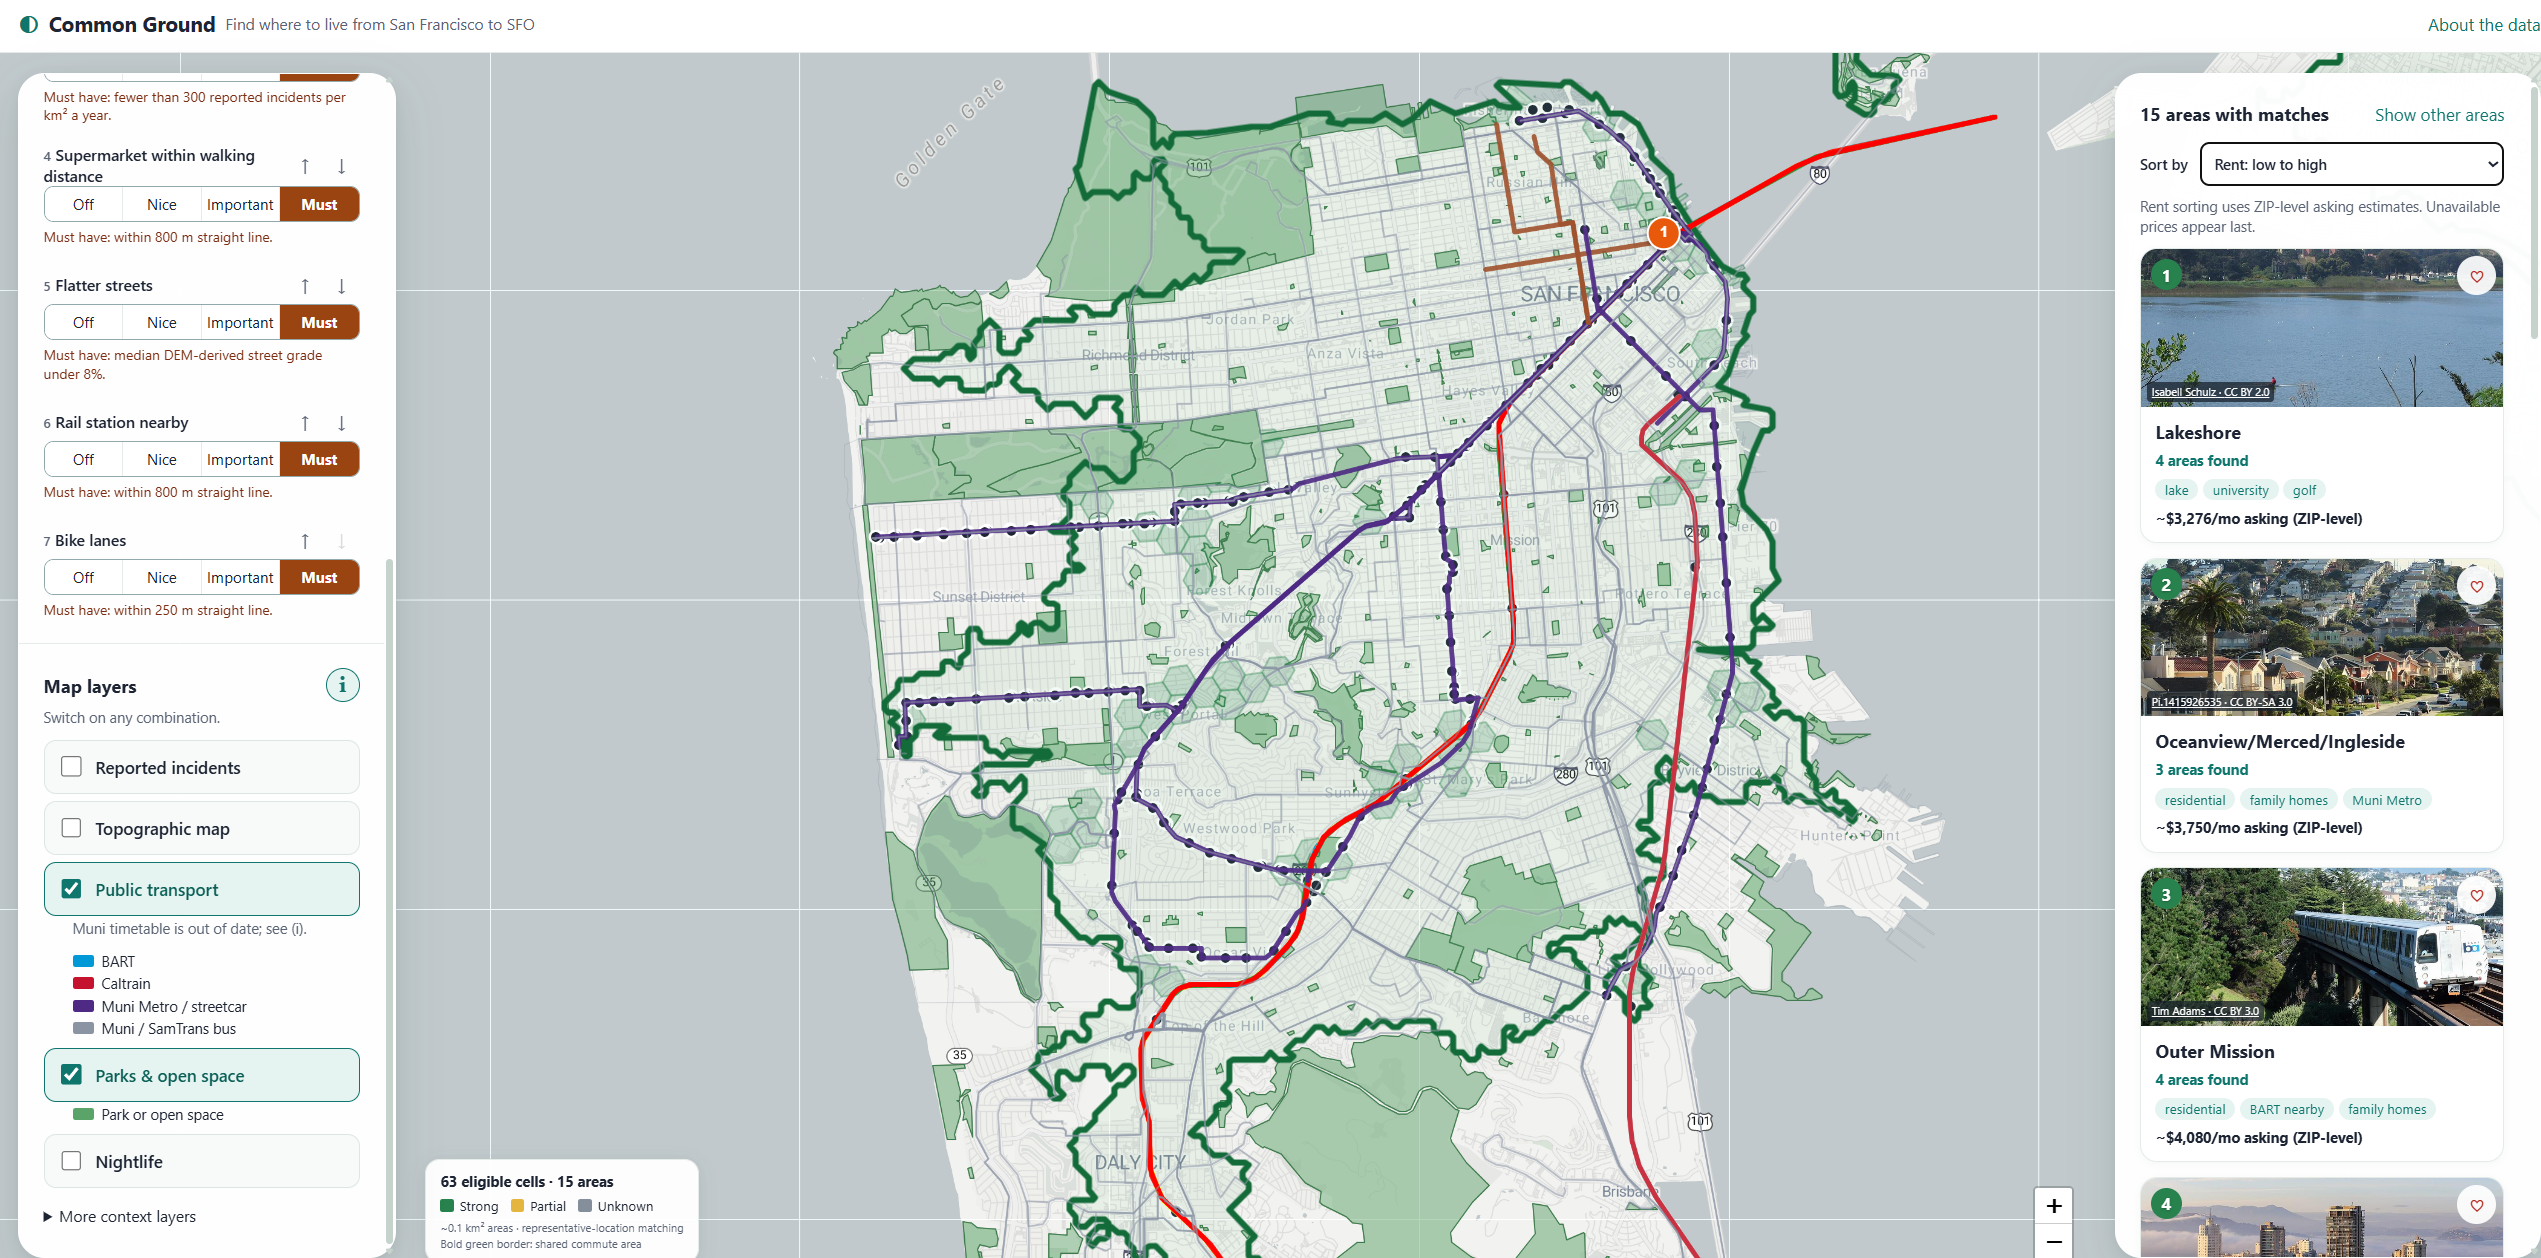
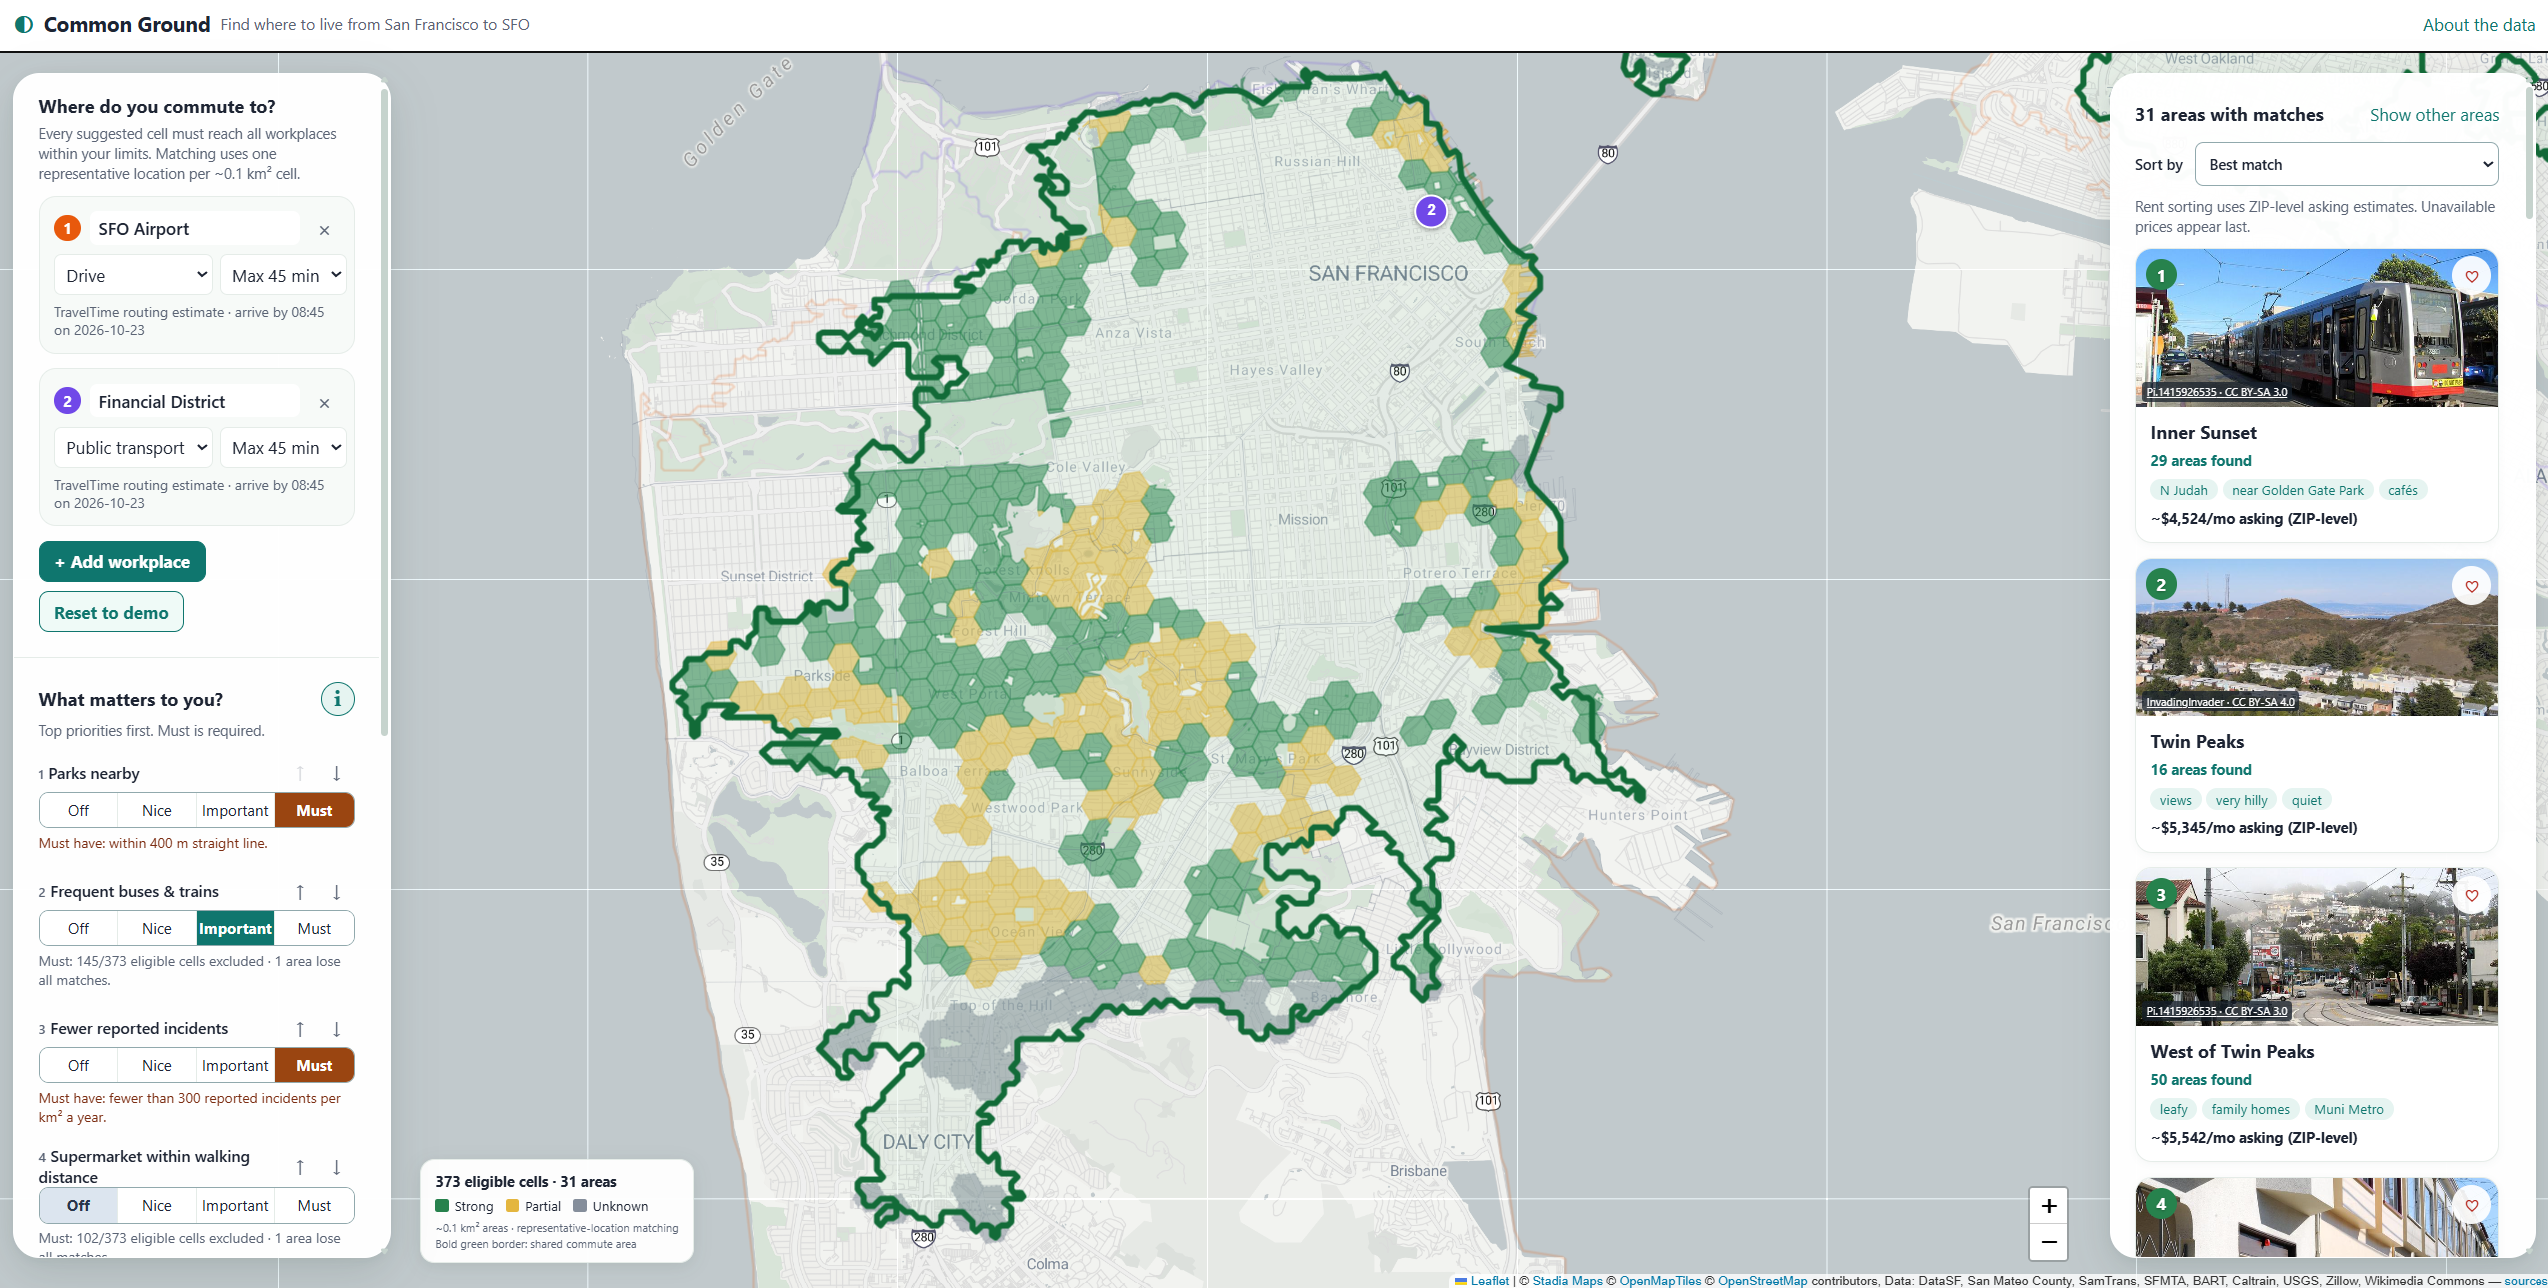
Commute is the hard gate. Add up to four workplaces (the demo uses SFO Airport by transit within 60 minutes and the Financial District by transit within 45 minutes). Commutes are modelled from home to work, arriving by 08:45. A home location qualifies only if it is inside every workplace's commute area at the same time. The map shows each commute area faintly and outlines the shared overlap in bold green.
Fine-grained matching
San Francisco through South San Francisco to SFO is divided into 2,408 hexagonal cells of approximately 0.1 km² each (H3 resolution 9), grouped into 41 SF neighbourhoods plus 17 Peninsula city areas, including Daly City, South San Francisco, San Bruno, Colma, Brisbane, Millbrae and Pacifica.
Different parts of one neighbourhood can match differently, so a great corner of an otherwise bad fit is never hidden.
Priorities without a black-box score
Flatter streets, frequent buses and trains, rail access, parks, supermarkets, cycling facilities and fewer reported incidents can each be set to Off, Nice, Important or Must, and reordered with up/down arrows.
Ranking compares your first priority in broad measurement bands, then the next, so there is no weighted total and no hidden liveability score.
Transparent filtering
Must-haves are previewed before you apply them. Each one tells you how many currently eligible cells it would remove and which areas would lose all their matches.
Near misses show cells that fail only one Must-have and explain what relaxing it to Important would change.
Honest handling of missing data
Missing data is never a pass or a fail. If a measurement doesn't exist, the cell is marked unknown (grey), never quietly counted as zero.
Green means everything you asked for is satisfied. Yellow means the hard requirements pass, but some softer preferences are weaker or unmeasured.
Explanations everywhere
Click any cell for its local evidence, including street grade, distance to the nearest park, transit, rail and grocery store, reported incidents, pollution and rent, with sources.
Excluded areas list every reason they were excluded.
Results you can act on
Neighbourhood cards include licensed photos, editorial descriptions, ZIP-level asking-rent trends, sorting by best match or rent, a saved shortlist with side-by-side comparison, and links to rental listings.
Context map layers
Topographic elevation, transit, parks, reported incidents, cycling networks, pollution and more, plus cafés, restaurants and bars at street zoom.
These amenities are available for discovery only and are never used in ranking.
How we built it
Frontend
React 19, TypeScript and Vite, with Leaflet driven directly (no react-leaflet) and two Turf.js modules for geometry.
The ranking engine is pure TypeScript and unit-tested. The frontend is a static site: the browser loads precomputed data files, and no per-user information is sent to a server.
Data pipeline
Python, using GeoPandas, Shapely, pyproj, H3, rasterio and pandas.
One download script registers every source and fetches it repeatably. One processing step exists per dataset, and every output is recorded in a manifest.yaml file with its source URL, download date, time period, licence and known limitations.
A file without a manifest entry is never used.
Public data sources
- DataSF: neighbourhood boundaries, SFPD incident reports (12 months), street centrelines, Rec & Park properties and injury collisions.
- San Mateo County GIS: city boundaries, water masks, streets, bikeways and parks.
- Transit timetables (GTFS) from BART, Muni, Caltrain and SamTrans.
- USGS 3DEP elevation data.
- US Census ACS 2020–24 population and rent paid.
- CalEnviroScreen 5.0, using pollution indicators only.
- Zillow Observed Rent Index, by ZIP code.
- OpenStreetMap: parks, supermarkets, cafés, restaurants and bars.
- Wikimedia Commons photographs, credited individually.
Street steepness
We split every official street centreline into approximately 10 m pieces, sampled the USGS elevation model with bilinear interpolation, and measured grade across rolling 40 m windows along the road.
Results are length-weighted into each hexagon, providing median grade, 90th percentile grade and the share of street length above 10% gradient.
We cross-checked the elevation units at Twin Peaks against the USGS Elevation Point Query Service: 250.198 m versus our calculated 249.435 m.
Commute areas
Commute calculations use a swappable provider.
Offline, the demo uses precomputed transit catchments built from GTFS timetables, working backwards from arrival time with typical waits, walking transfers and the SFO AirTrain.
Live, a small Node proxy calls the TravelTime API (free Basic plan) with arrive-by searches.
API keys stay on the server and never reach the browser. The proxy caches responses and caps daily calls.
Testing and development
Our testing includes:
- 38 Python data-contract tests.
- 29 frontend logic tests.
- 4 routing-proxy tests.
- 12 desktop and mobile browser tests using Playwright.
- 9 dataset validators.
- A reproducibility check confirming identical output files through matching SHA-256 hashes.
We built the project in AI-assisted sessions with Claude Code, guided by a written rulebook (CLAUDE.md) covering product and data rules.
Challenges we ran into
Getting the hills right
Our first hills filter was measuring the wrong thing.
It averaged terrain slope within 170 m of a point, so a flat street beside a hillside scored as steep.
We rebuilt it to measure grade along the streets themselves. Valencia and Irving now come out flat, while blocks of Jones, 22nd and Vermont vary considerably from one block to the next.
Whole-neighbourhood filtering
Our first version required at least 50% of a neighbourhood to be reachable, which threw away neighbourhoods where only one part worked.
We moved to per-cell matching, where the same location must satisfy every commute, and added a regression test for a neighbourhood split into two disconnected halves.
Expired and restricted data
SFMTA's public "current" Muni timetable expired on 28 August 2026, before our demo date.
Instead of pretending it was current, we labelled it out-of-date in the data, commute areas and UI.
The Census API now needs a key, so we switched to official bulk files.
CARTO's basemap started requiring a key, so we moved to Stadia Maps.
DataSF's neighbourhood map turned out to be a visualisation with no export, so we found its underlying table.
Extending to the Peninsula honestly
Peninsula cities have no geocoded 12-month police or crash feed comparable to San Francisco's.
We kept those values as explicit nulls instead of extending SF numbers or treating them as zero. A Must-have for fewer incidents therefore makes those cells unknown.
We also found SamTrans's official, keyless timetable download, valid on the demo date.
Cleaning the crime data
SFPD records include supplements that duplicate original reports, plus non-crime categories such as lost property, warrants and traffic collisions.
We counted distinct initial reports only.
Results are shown on approximately 0.74 km² hexagons (H3 resolution 8) and described as reported incidents, never as "safe" or "unsafe".
Filling gaps in parks data
The SF Rec & Park layer omits the Presidio, Lands End, Fort Funston and state parks.
We merged in OpenStreetMap parks and removed overlapping areas to avoid double-counting.
Engineering challenges
County GIS servers return at most 1,000 features per request, so we had to paginate results.
Each data file had to stay under a 3 MB budget, so we split the street layers and load them only when needed.
Windows encoding bugs required us to standardise on UTF-8.
A custom workplace bug turned out to be the app running in offline-only test mode against an outdated copy on another port.
On mobile, placing a workplace on the map broke Leaflet styling, and the tabs stopped responding to taps. Both required additional debugging.
Accomplishments that we're proud of
End-to-end live commute routing
We verified the full multi-commute flow using live TravelTime routing:
Browser → Proxy → TravelTime → Map
One test with a third workplace in South San Francisco still left 10 matching South San Francisco cells.
Ranking without a liveability score
Every result can be explained by measured values, thresholds and the user's own priority order.
There is no hidden weighted score determining where someone should live.
Transparency about data quality
We made geographical resolution and data limitations central to the product.
Crime is represented as reported incidents aggregated into hexagons, never precise incident points.
Rents are ZIP-level asking rents.
Pollution uses CalEnviroScreen pollution indicators only, never composite or vulnerability scores.
Offline walking, cycling and driving commutes are explicitly labelled Synthetic.
Responsible use of public data
Licences and credits travel with the data and remain visible in the app, including SFMTA's required notice.
Reproducible data processing
A complete rebuild from cached raw sources produces byte-identical output files.
This makes our data pipeline auditable and repeatable.
What we learned
Getting the resolution right is the product
A neighbourhood average often answers a question nobody is asking.
People care about the specific streets and areas where they might actually live.
Missing data is a product decision, not a footnote
Treating null as a third state changed both our ranking logic and our user interface.
Unknown should never silently mean good or bad.
Transit data goes stale quietly
Checking every timetable against the demo date caught an expired feed we would otherwise have presented as current.
Written rules make AI-assisted development more reliable
Writing our product rules down first in CLAUDE.md kept fast, AI-assisted iteration from drifting into misleading shortcuts.
What's next for Common Ground
We plan to expand and improve Common Ground by:
- Refreshing Muni data with a current 511 transit feed.
- Finding comparable Peninsula police and crash data.
- Adding noise, fog and sunshine information.
- Integrating street trees and urban greenery.
- Incorporating flood and seismic risk.
- Adding schools as an optional preference.
Our long-term goal is to make Common Ground a transparent, data-driven starting point for anyone moving to an unfamiliar city, helping people find the right area before they start searching for a home.
Built With
- calenviroscreen
- datasf
- geopandas
- gtfs
- h3
- leaflet.js
- node.js
- openstreetmap
- pandas
- playwright
- python
- rasterio
- react
- shapely
- stadia-maps
- traveltime-api
- turf.js
- typescript
- us-census-acs
- usgs-3dep
- vite
- vitest
- wikimedia-commons
- zillow

Log in or sign up for Devpost to join the conversation.