Inspiration
Karachi is a coastal megacity of 17+ million people that faces two recurring climate shocks: monsoon urban flooding and extreme heat. Underpasses and arterial roads often flood within hours, while municipal teams still get coarse, late forecasts and react after traffic is already gridlocked.
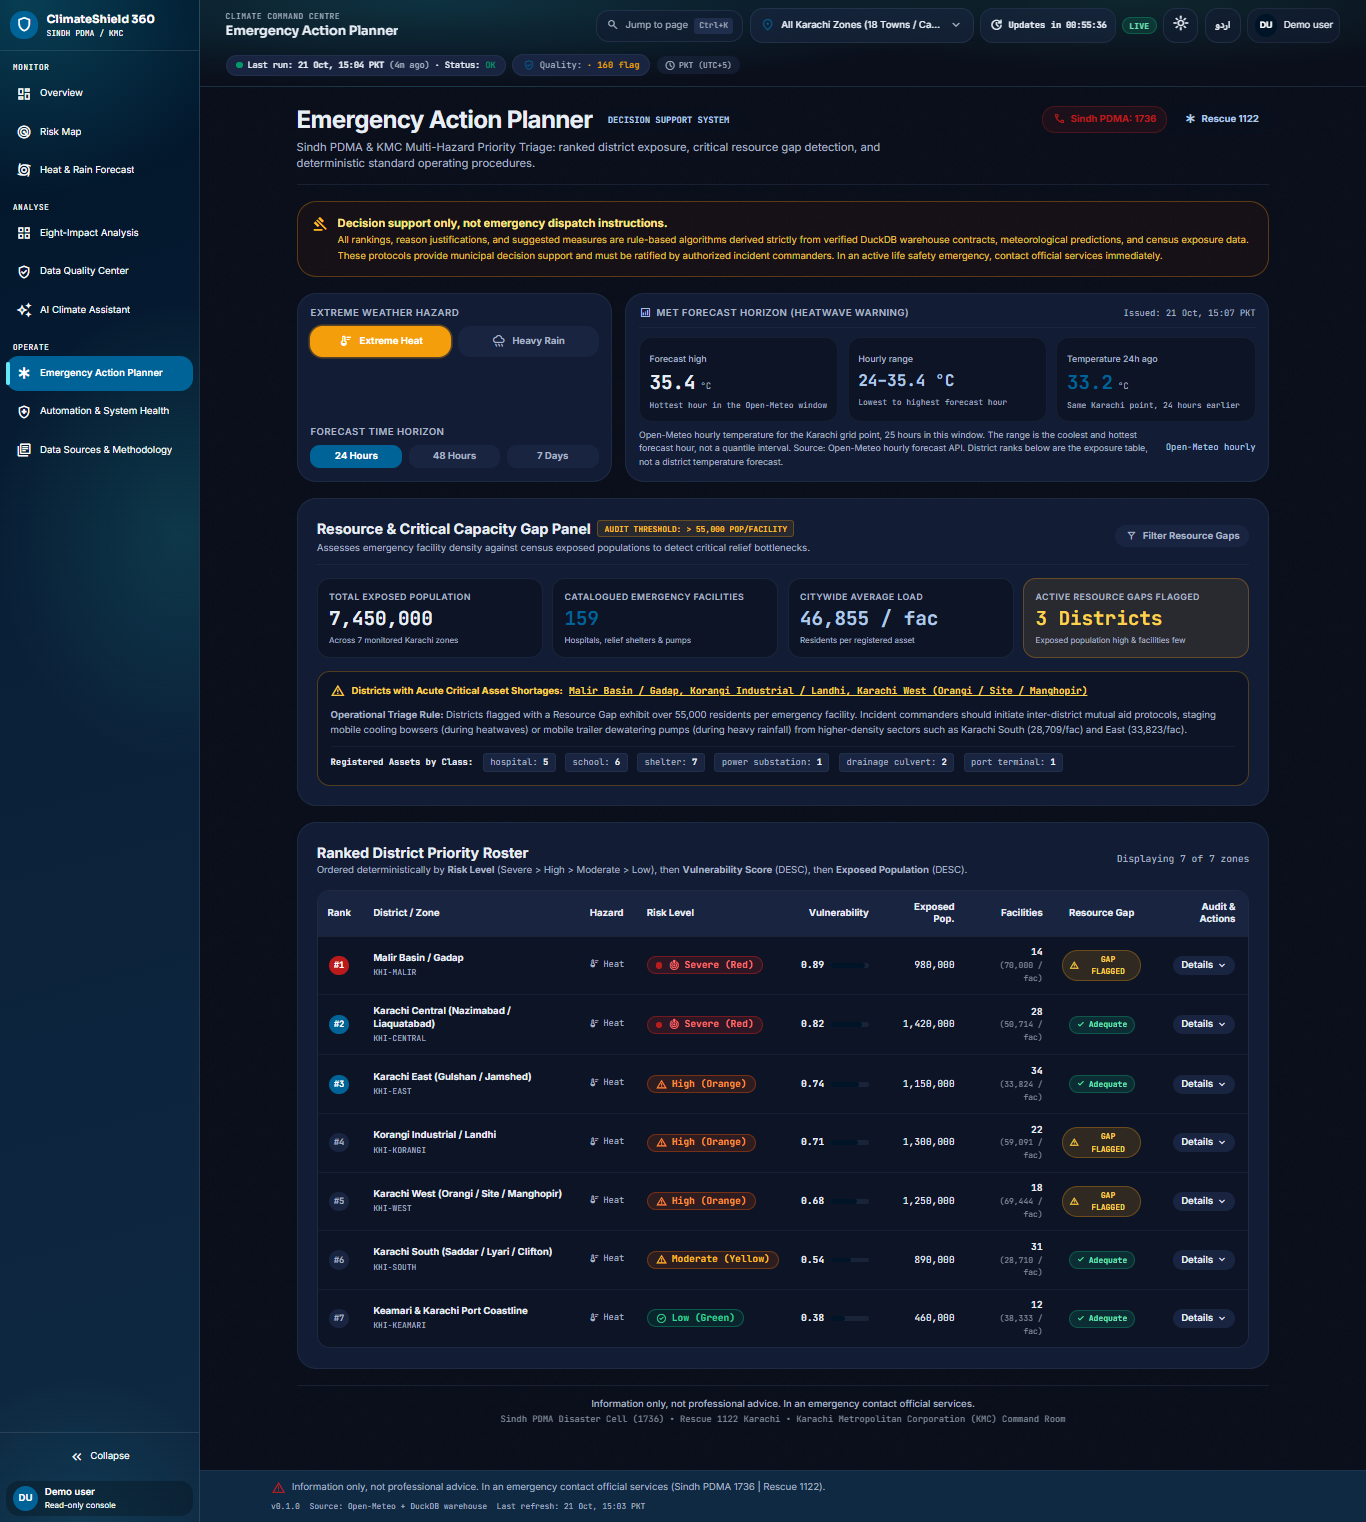
We wanted a system that closes that data-to-decision gap for Sindh PDMA / KMC-style operations: not another pretty dashboard of static charts, but a live command centre that turns verified weather, flood, demographics, and infrastructure data into clear hazard levels, maps, and action guidance—honest about what is observed vs predicted.
What it does
ClimateShield 360 is an extreme-weather decision-support platform for Karachi that:
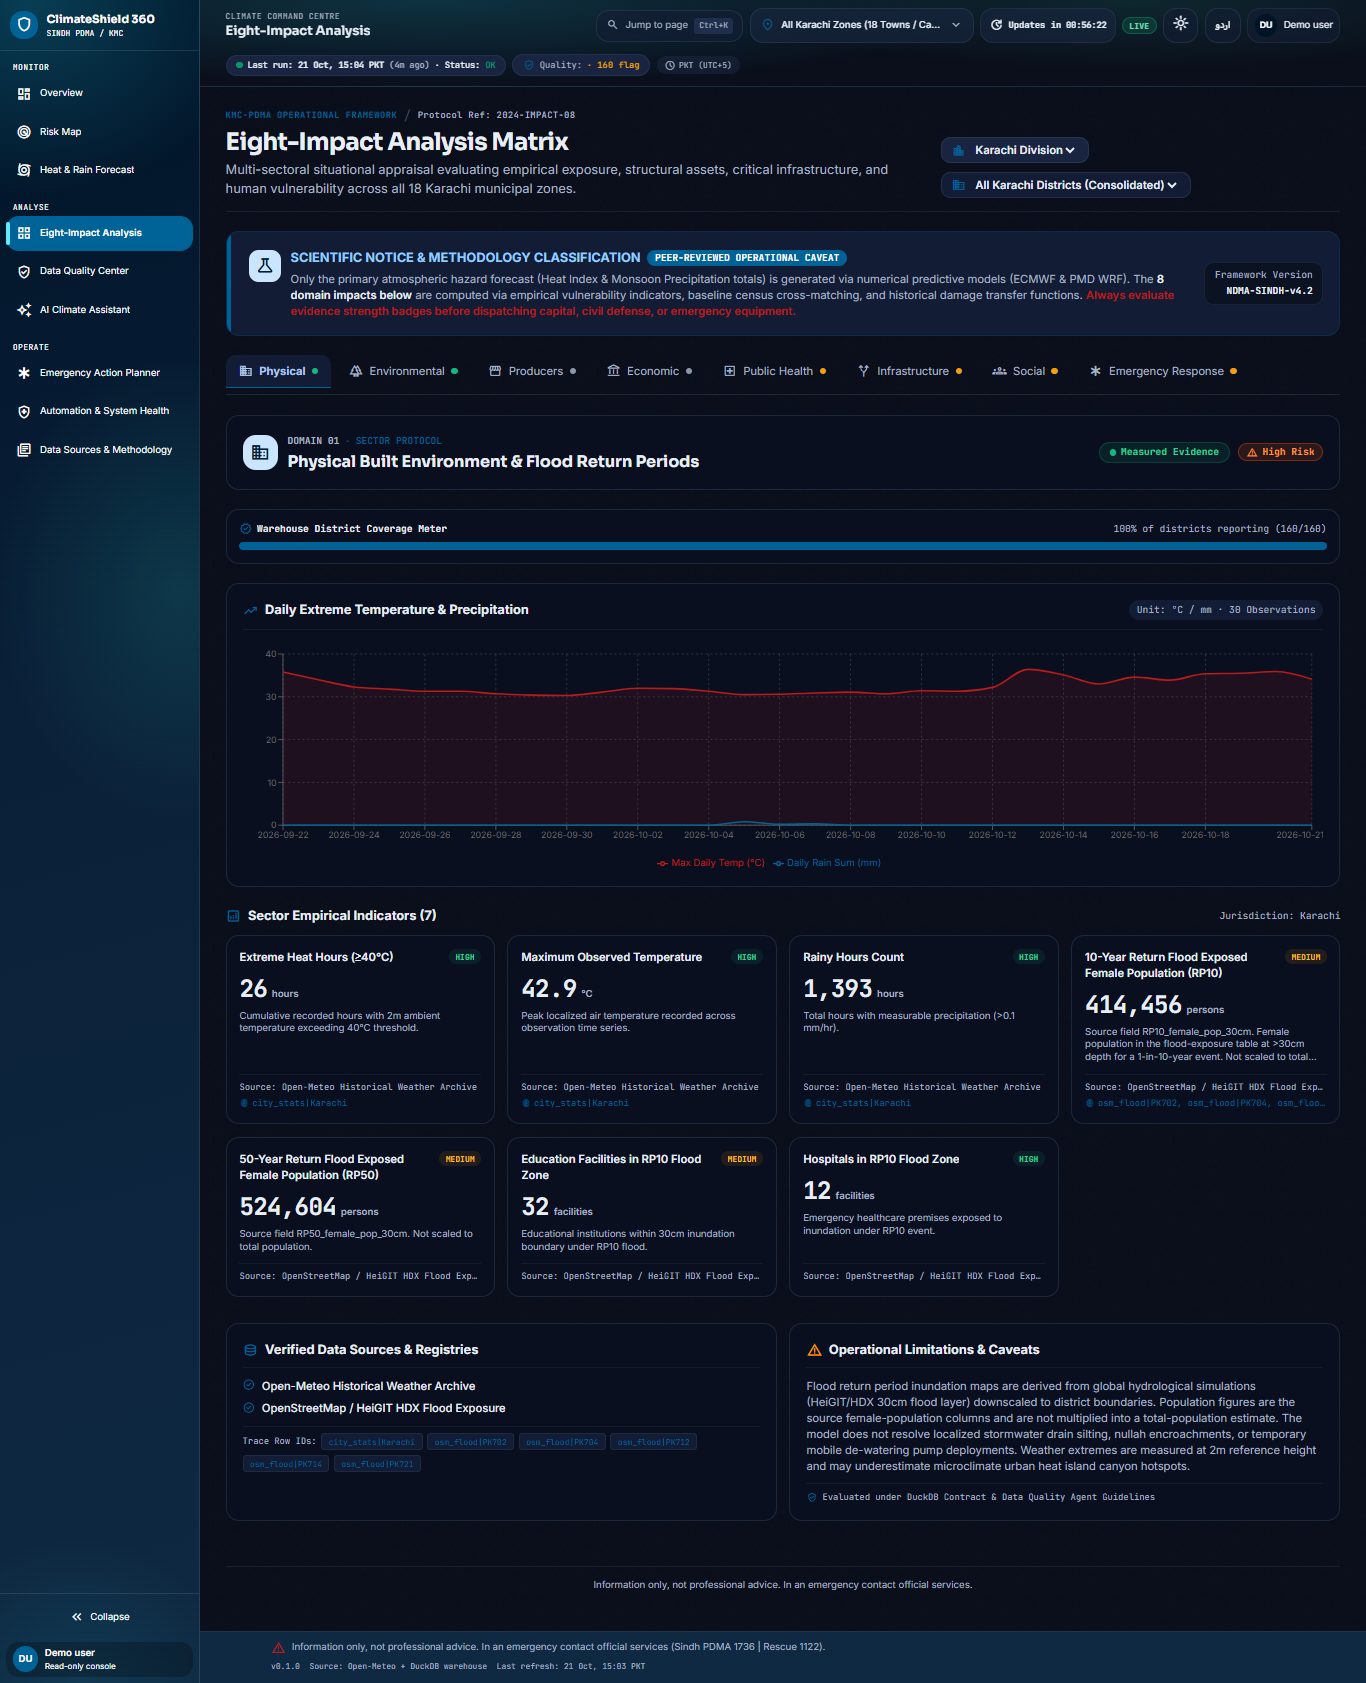
- Ingests hourly Open-Meteo weather (and related flood/GloFAS signals), plus official/web snapshots (NDMA, PMD, PBS) and OpenStreetMap-derived facilities
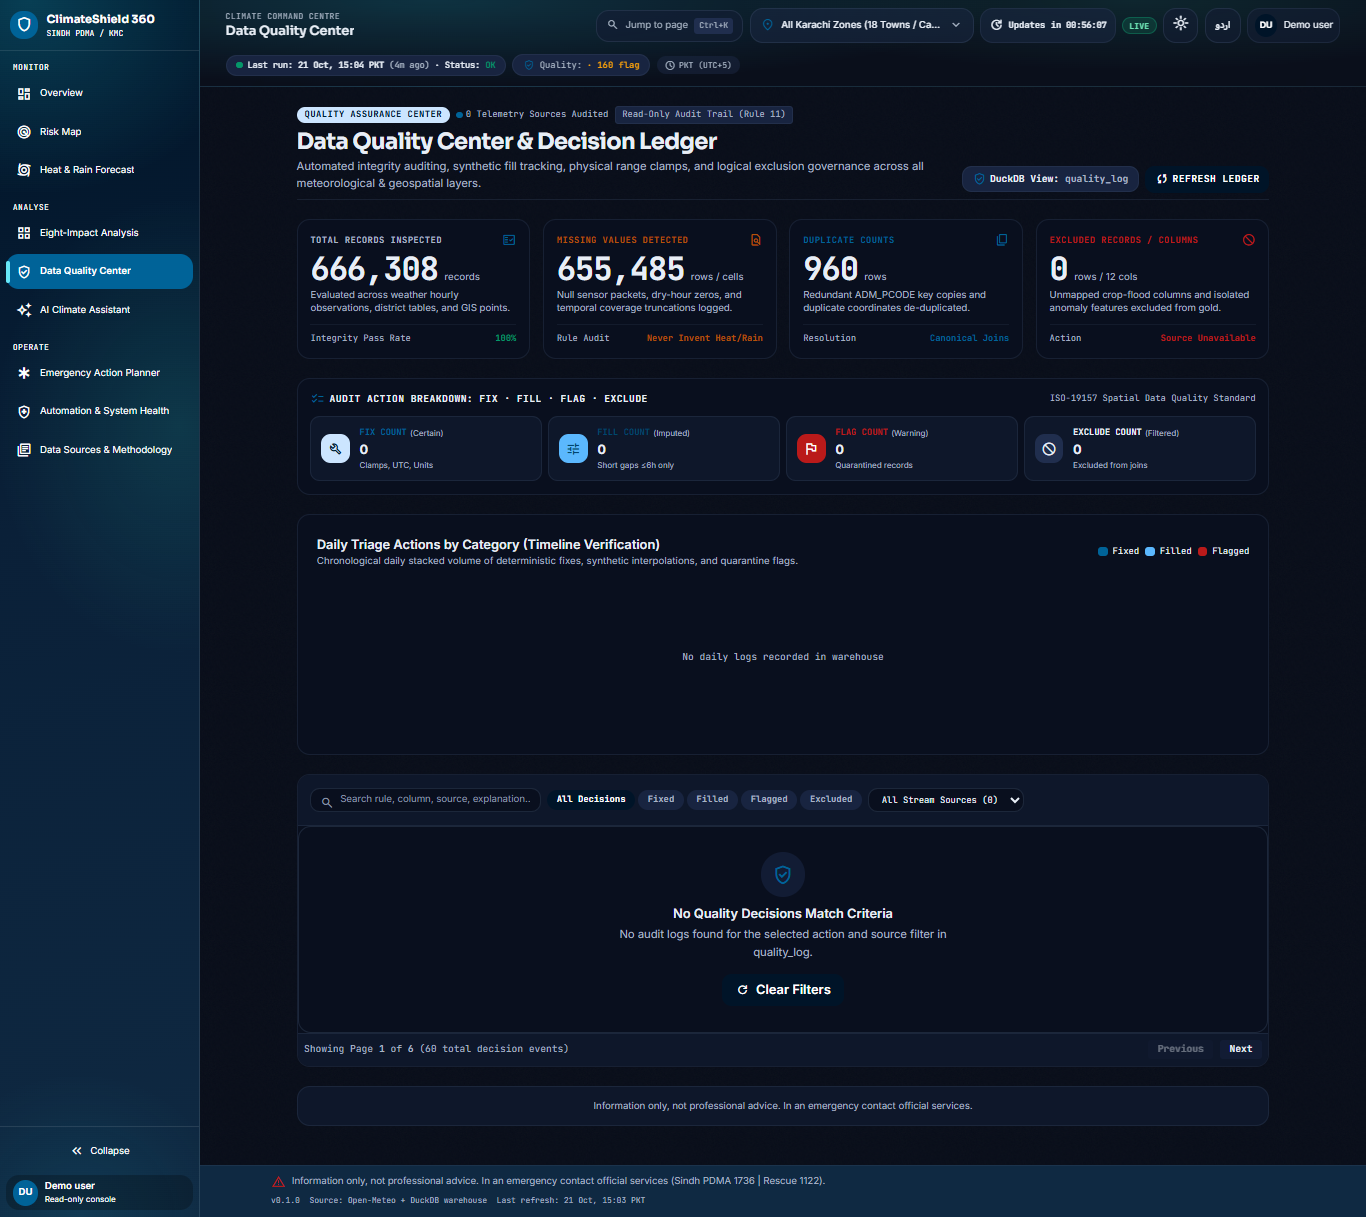
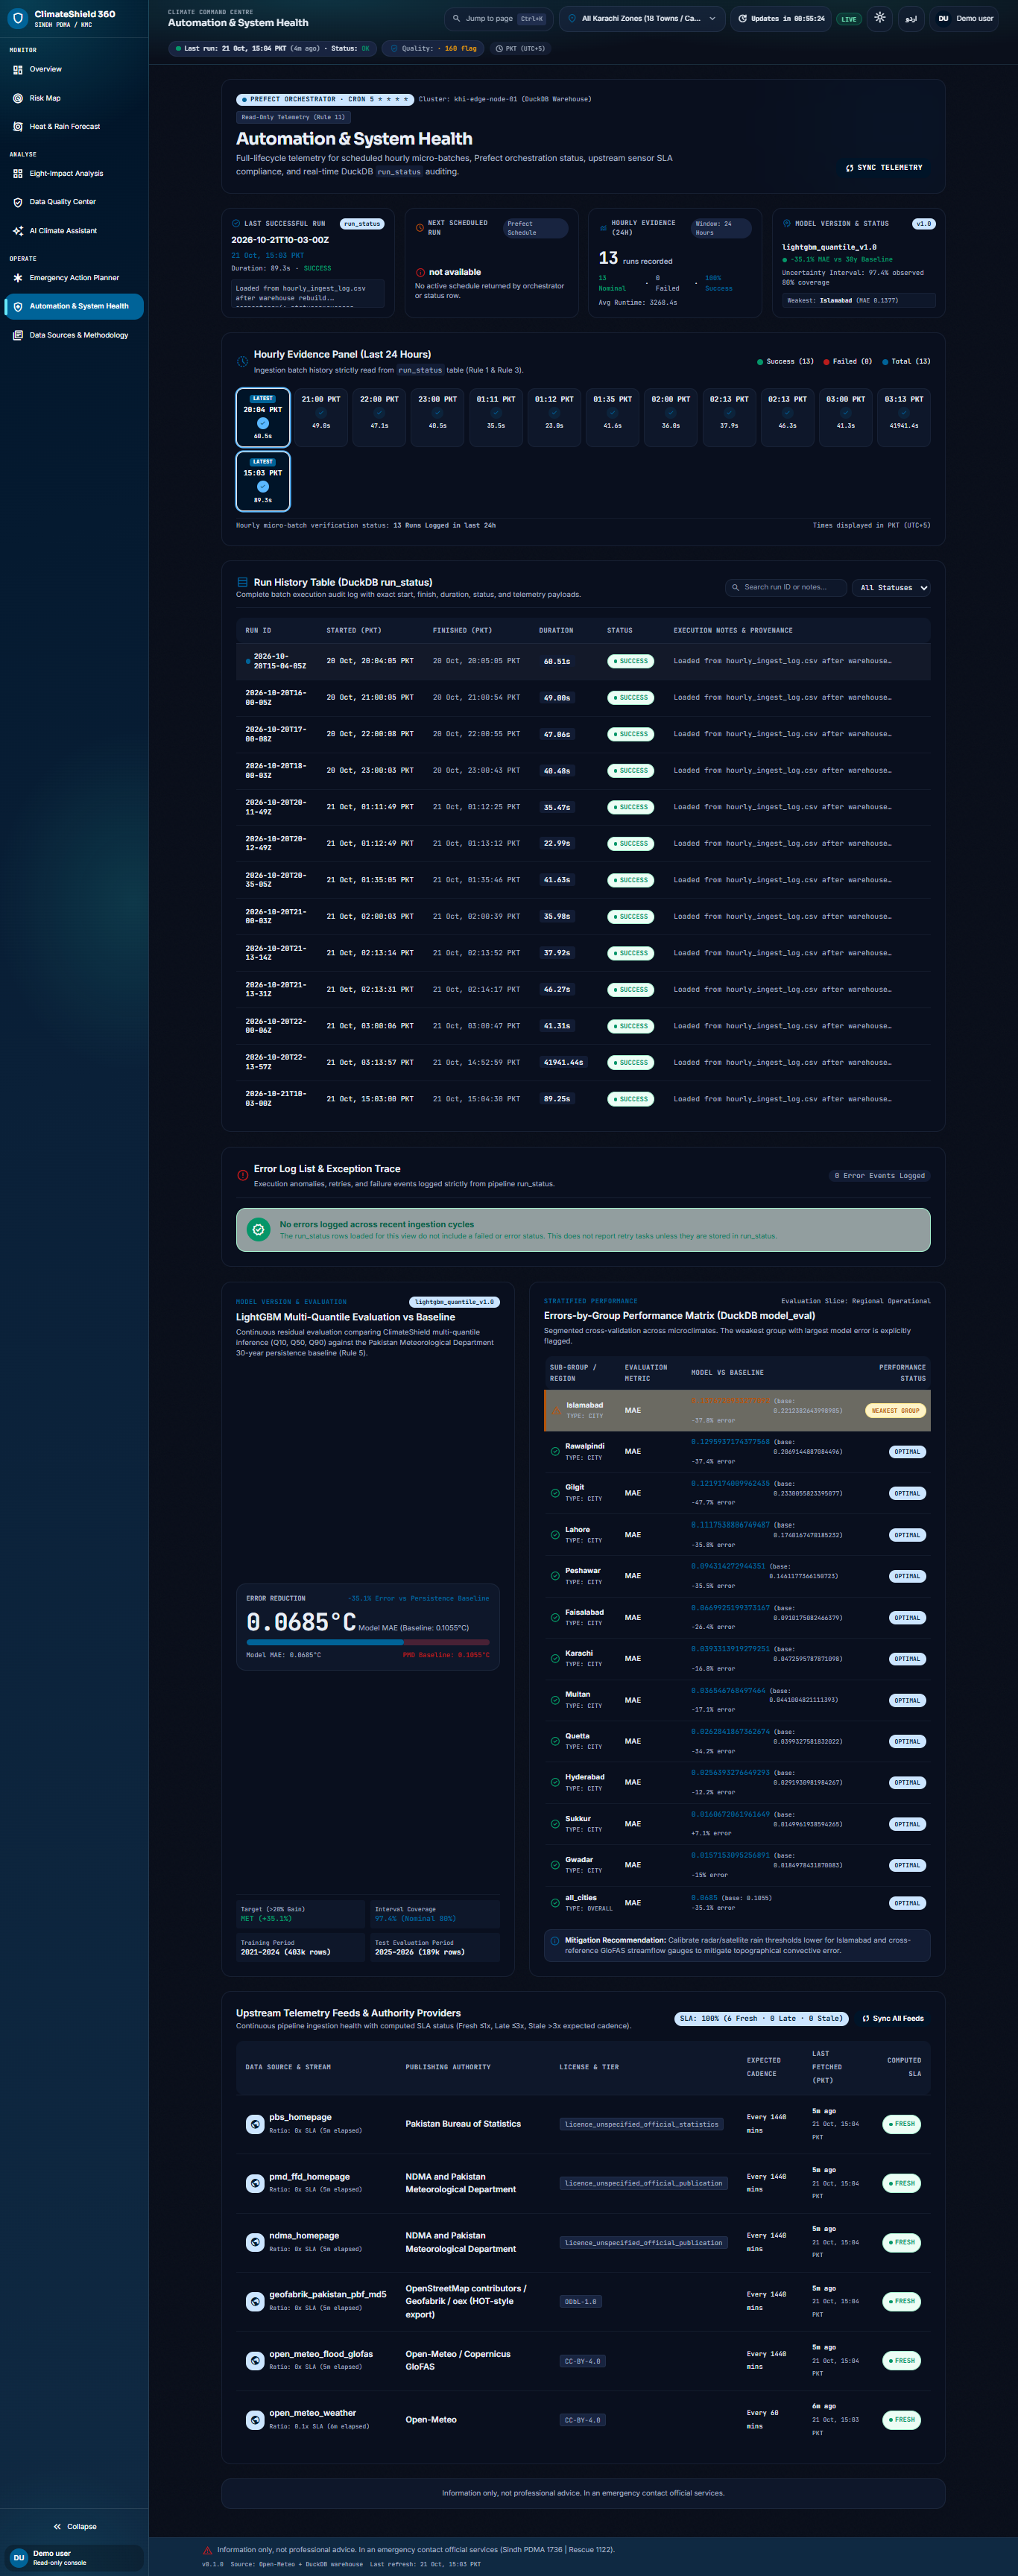
- Stores everything in a DuckDB warehouse with quality checks and freshness tracking
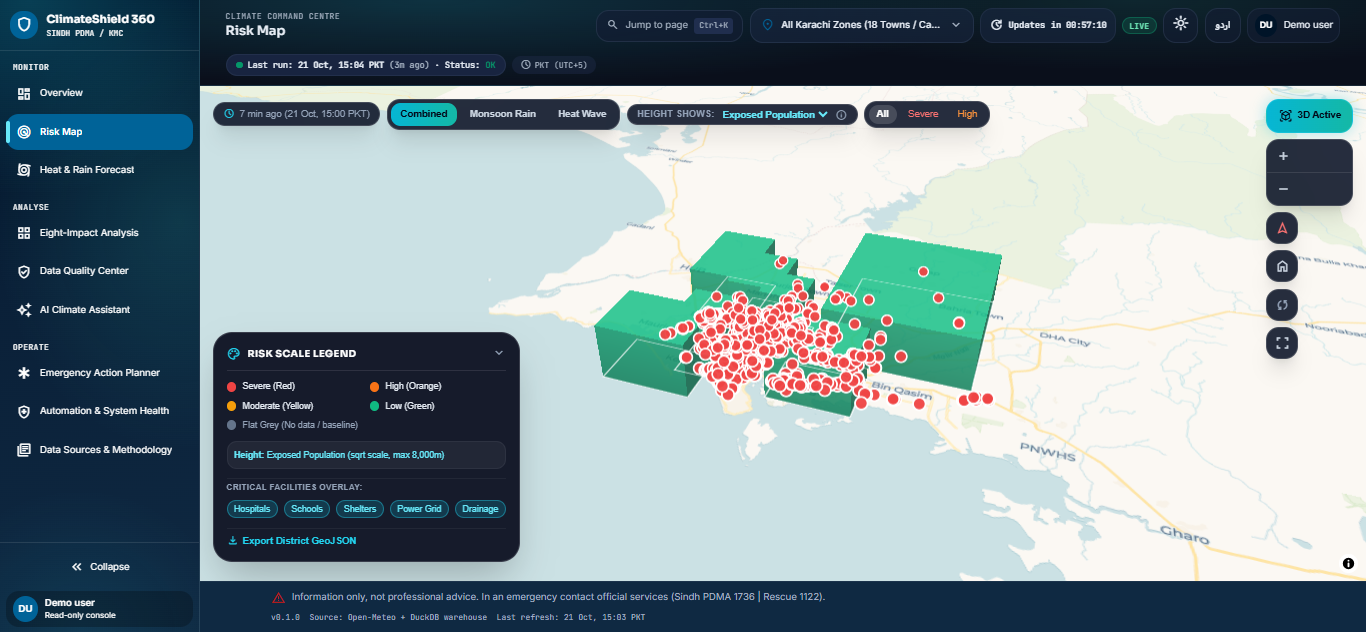
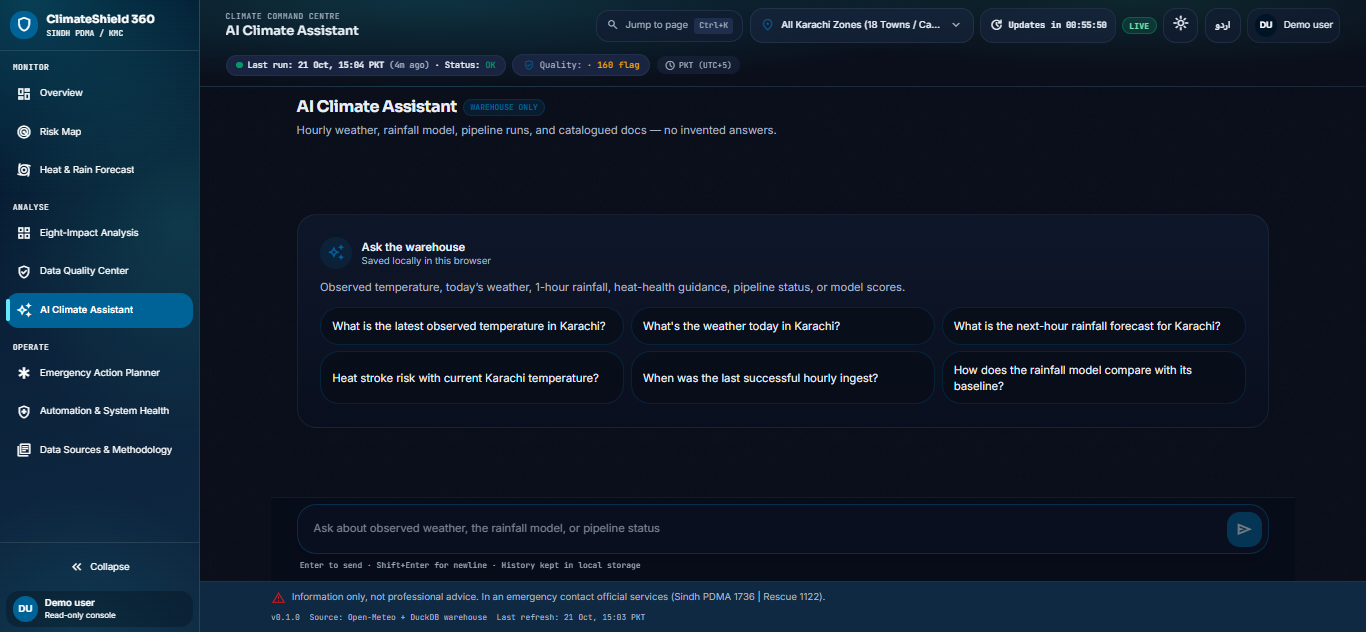
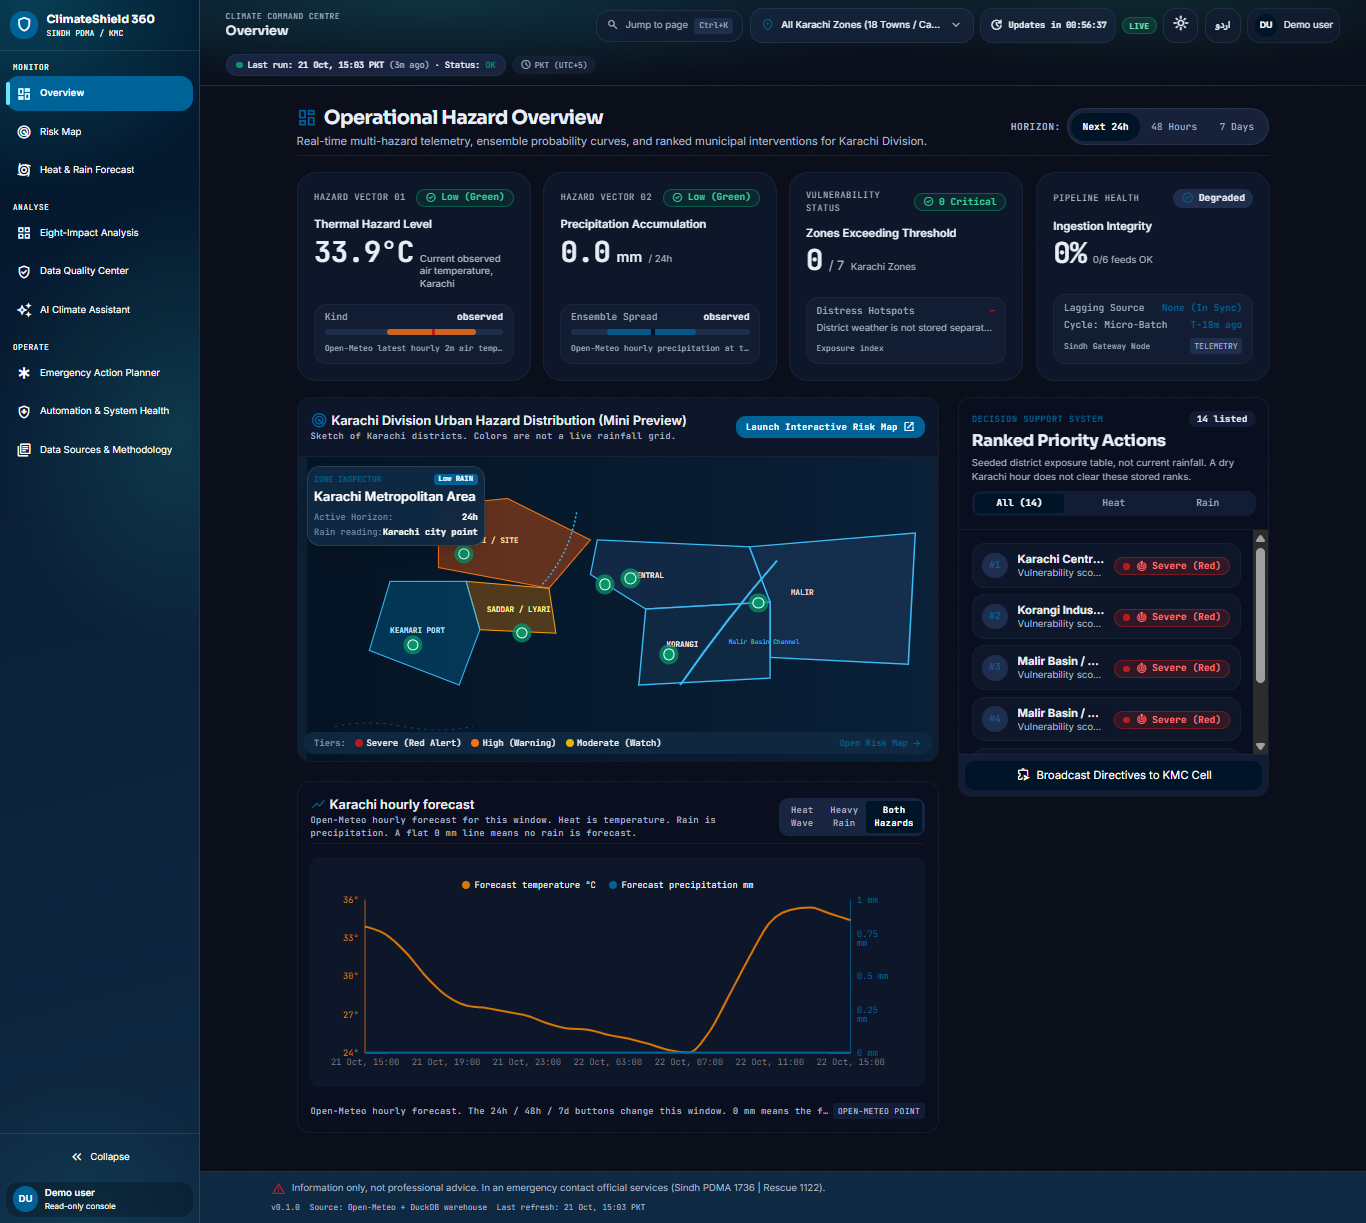
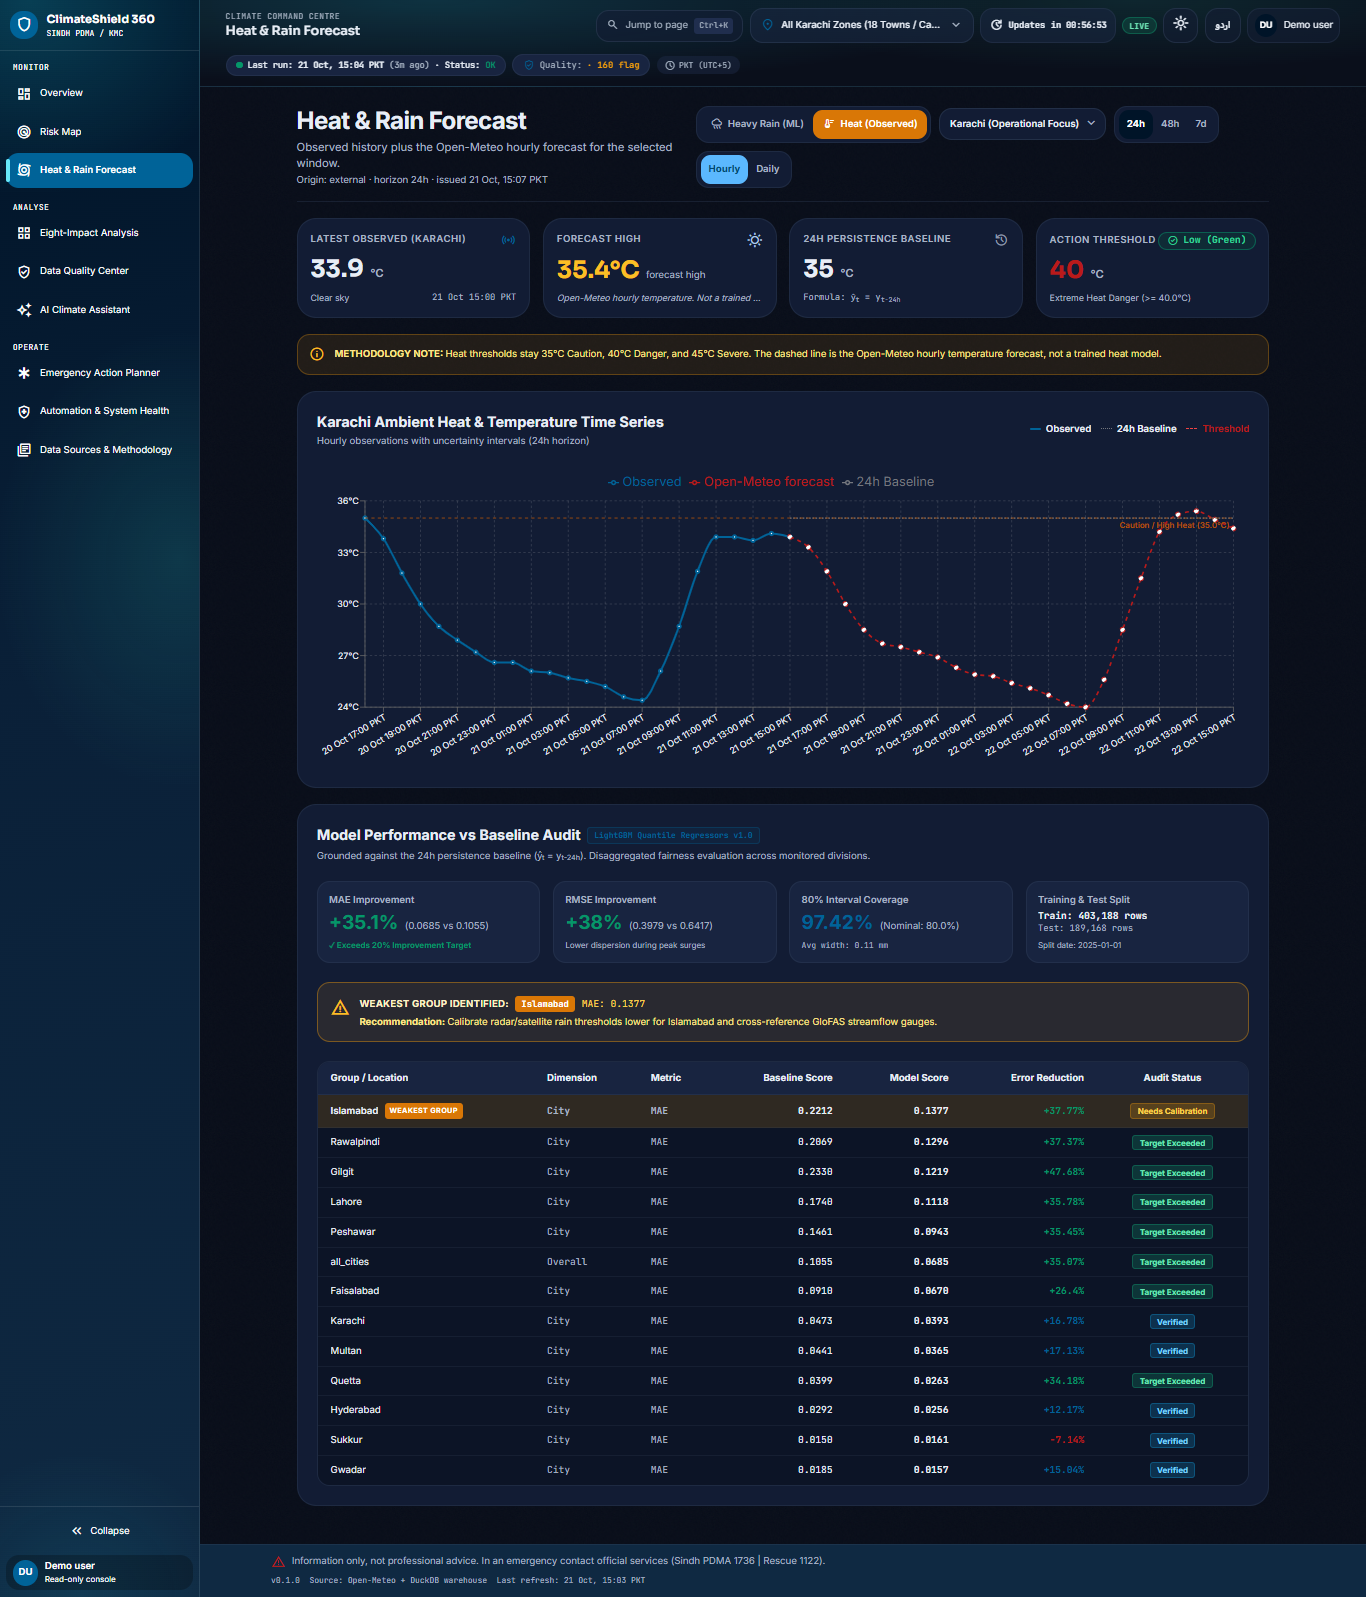
- Serves a FastAPI backend and a dark tactical React UI (Overview, Risk Map, Forecast, impacts, AI Climate Assistant, emergency planner)
- Shows live heat/rain hazard from the latest hourly observations—not seeded static “Severe” tables when the city is dry
- Benchmarks LightGBM quantile forecasts against a declared 24h persistence baseline
- Stays “truth-in-data”: empty or late feeds show FAILED/late instead of inventing numbers
How we built it
- Pipeline – Python ingest (
ingest-hourly) pulls multi-source feeds, writes provenance, and rebuilds/updates the DuckDB warehouse on a schedule (and via an API-tied hourly supervisor so restarts catch up). - Warehouse – DuckDB holds weather_hourly, facilities, exposure/impact tables, run_status, and source_freshness (~590k+ weather observations in our build).
- API – FastAPI read-only access to DuckDB with envelopes for overview, map, forecast, status/freshness, insight agent, and planner routes.
- Frontend – Vite + React SPA with MapLibre/CARTO basemap, live status bar, and same-origin
/apiin production. - ML – LightGBM quantile models vs 24h baseline, with evaluation and fairness notes across cities.
- Deploy – Docker/Render-ready single service; free public host via GitHub Actions + tunnel, branded entry at the ClimateShield-360 GitHub Pages URL.
Challenges we ran into
- Honesty vs drama – Early map views could show Severe/High from seeded exposure indexes even with no rain; we had to wire hazards to live hourly Open-Meteo and fix proxy/port mix-ups so the UI hit the correct API.
- “Current” vs “day’s peak” heat – Using the day’s max temperature made night Overview look Severe while outdoor air was ~26–34°C; we switched the Overview heat card to the latest hour.
- Laptop sleep kills ingest – Hourly jobs stopped when the machine slept; we added an API lifespan hourly supervisor so opening the app resumes catch-up.
- Deploy without inventing data – Free hosting had empty/stale DuckDB and ingest disabled, so the live site showed FAILED and
— °Cuntil we shipped the filled warehouse and ran ingest on host start. - Branded free URL – Named subdomains on tunnels are flaky; we kept a stable ClimateShield-360 Pages entry that opens the live app.
What we learned
- Operational climate tools need freshness and status as first-class UX (ok / late / failed), not just charts.
- Separating observed hazards from model forecasts and static exposure layers prevents false alarms.
- Read-only APIs + a write-side ingest process force clean boundaries (and careful deploy order).
- Judges and operators trust systems that refuse to fake data when feeds fail.
What's next
- Stable always-on free host with a fixed
climateshield-360hostname (e.g. Render) - Stronger district-level rainfall grids (beyond the Karachi city point)
- Deeper coupling of GloFAS discharge to road-inundation risk for the 2–4 hour tactical window
- Broader multi-city rollout using the same warehouse + fairness audit path
Built With
- carto
- css
- docker
- duckdb
- fastapi
- framer
- gl
- lightgbm
- maplibre
- motion
- open-meteo
- openstreetmap
- pandas
- pandera
- python
- query
- react
- recharts
- scikit-learn
- tailwind
- typescript
- uvicorn
- vite
- zod


Log in or sign up for Devpost to join the conversation.