-
-
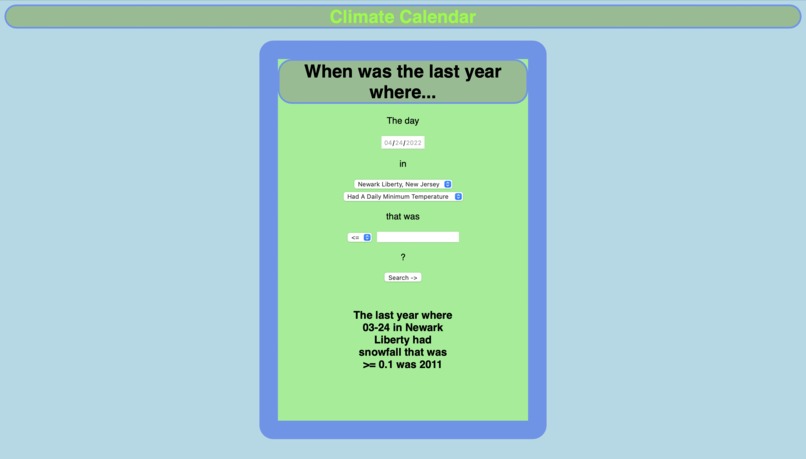
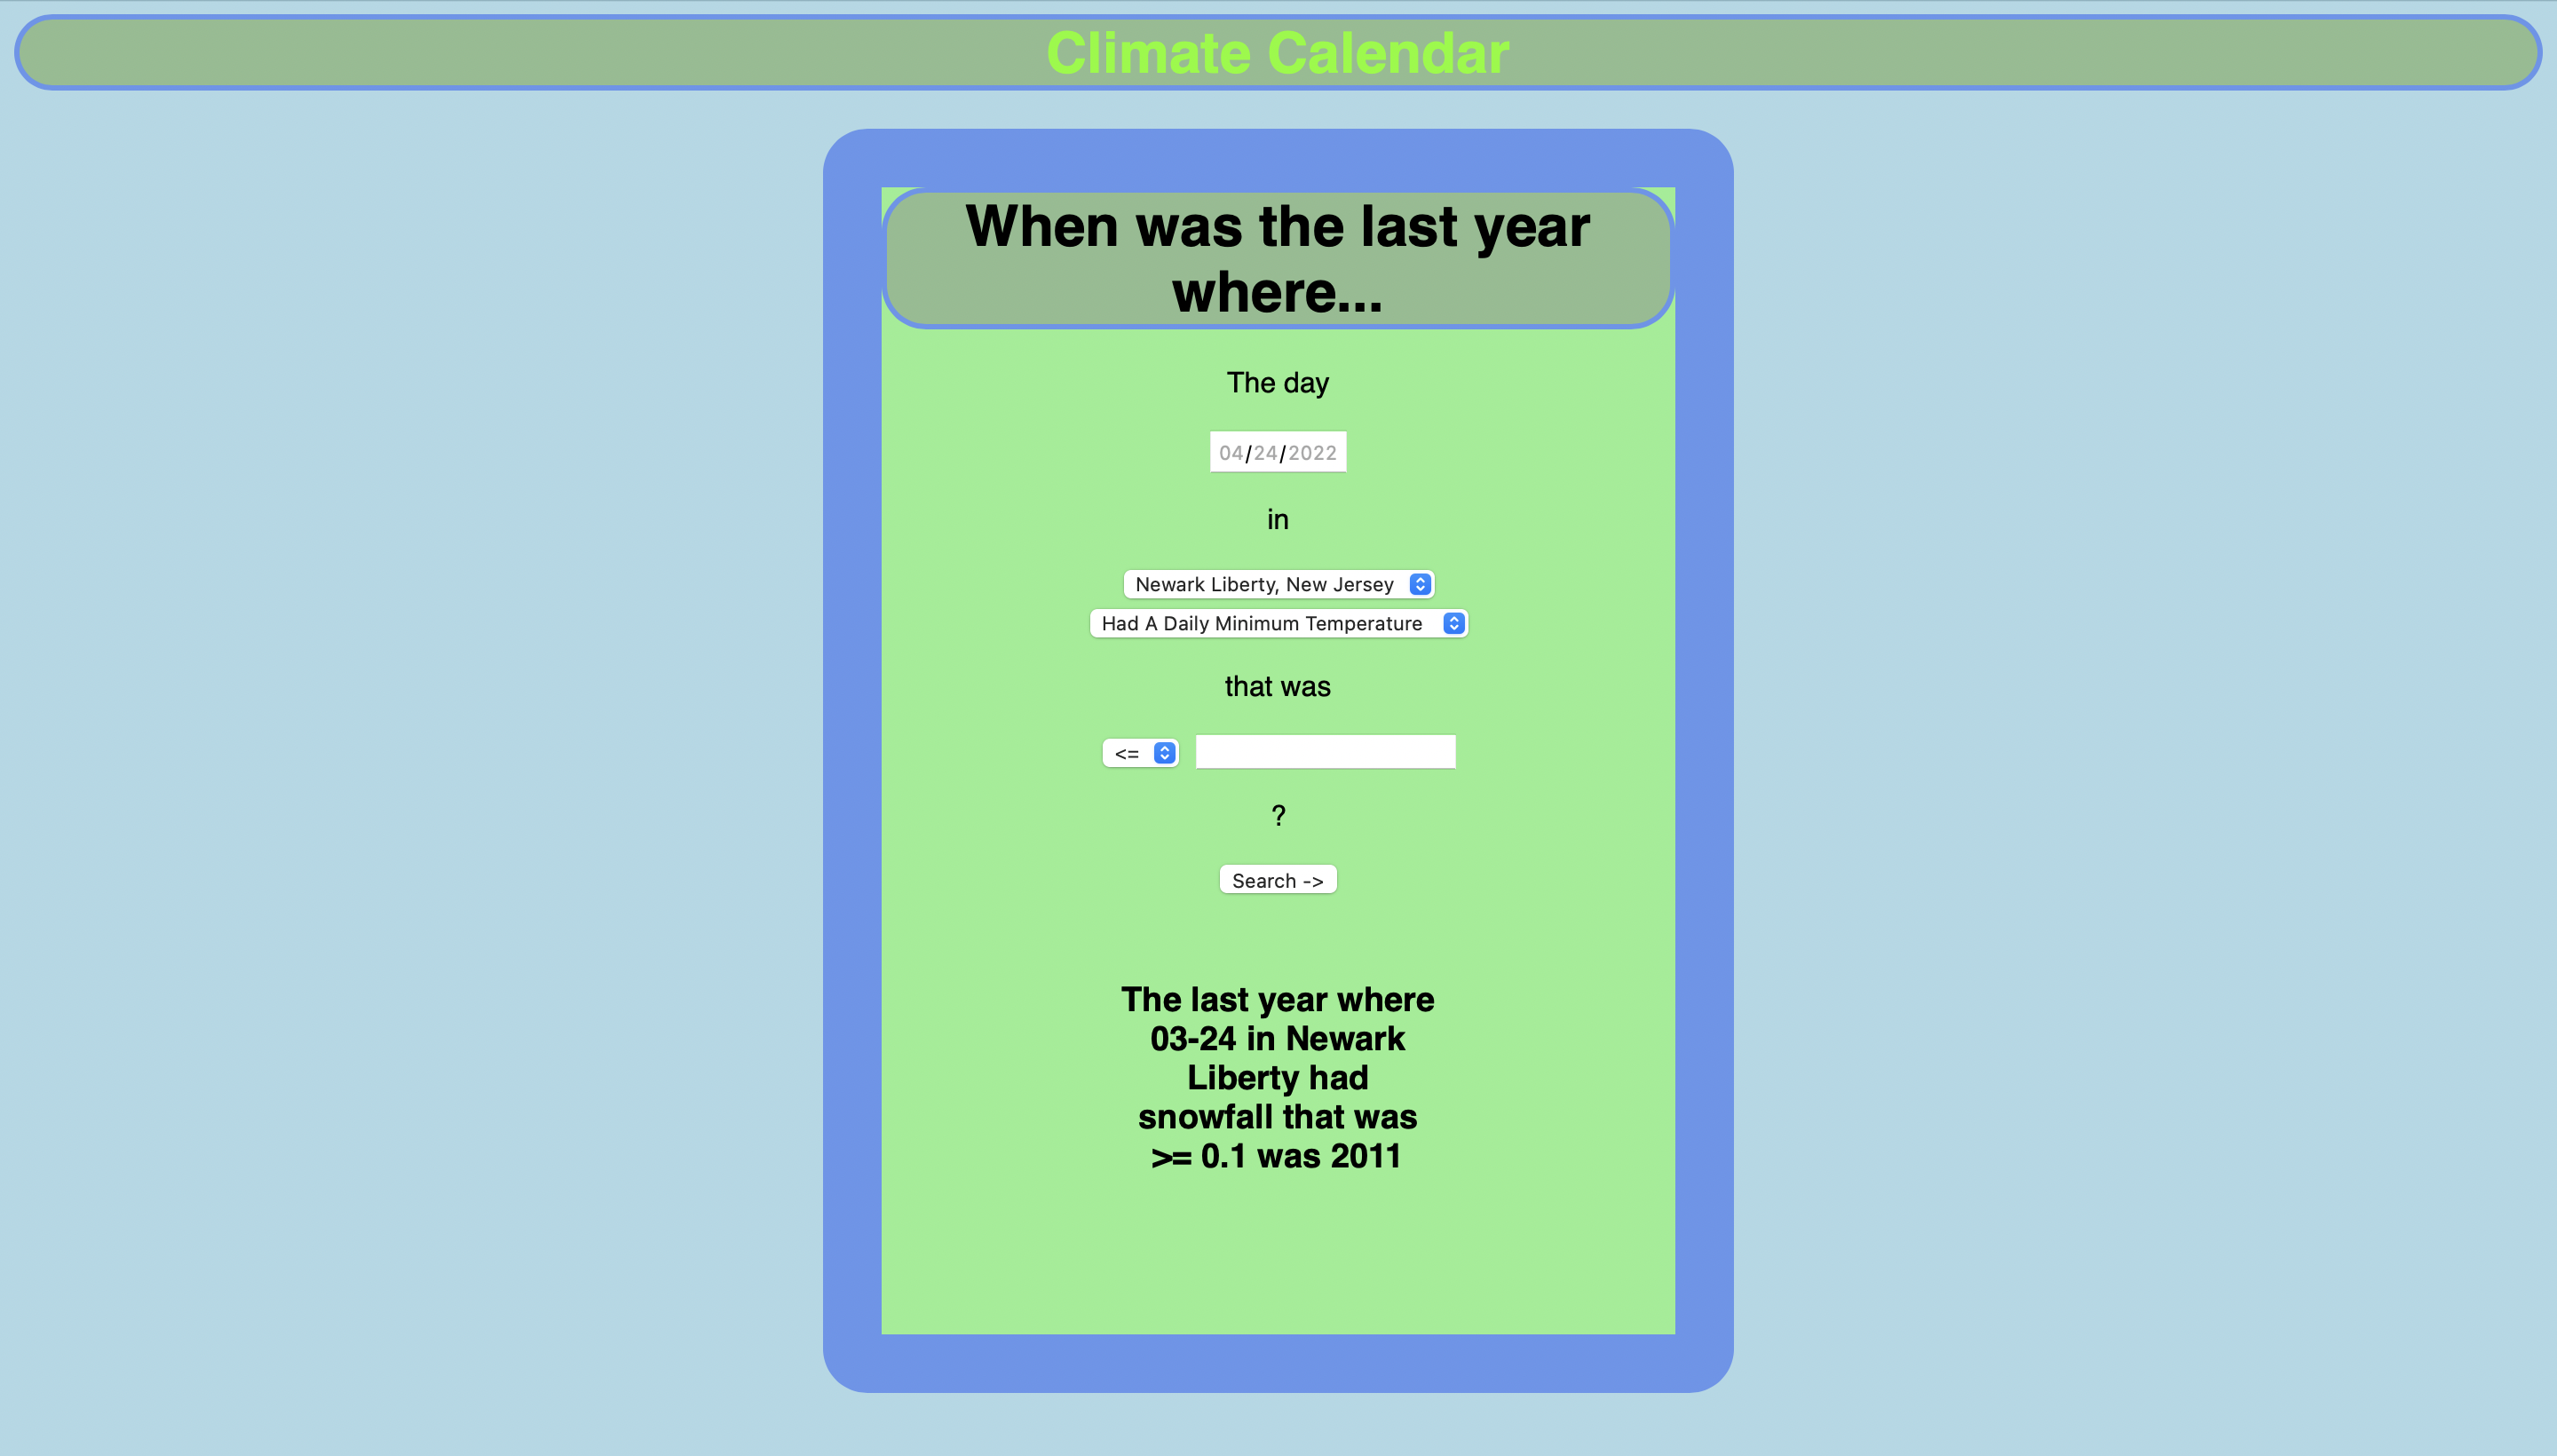
Climate Calendar
Inspiration
Sometimes unusual weather for a particular time and place can make us curious about the last time something like this happened. Recently, in mid-April, there was slight snow on Vassar campus, making our team wonder if and when similar events had happened in the past, as well as if historical data could provide insights into climate trends.
What it does
The web application allows users to enter several fields such as a particular date, location, and weather condition, and find out the last year that matches those parameters. For example, using this application a user could find out when it last snowed on April 4th at particular location, allowing them to compare their own experiences with past events.
How we built it
The web application utilized data provided by the NOAA climate data API, which provided historical weather data from various different locations across the United States. We used Python and Flask to make requests to this API and to obtain form data. We also used the render template with HTML and CSS to design the web app.
Challenges we ran into
Finding a reliable and large data set was initially challenging as many other APIs were premium products. In addition, we also had trouble using Javascript to make requests to this API, which caused us to switch to Python even though none of the members of our team had significant prior experience.
Accomplishments that we're proud of
We were proud that we were able to learn how to use a new framework and language to build this application in the given timeframe. We were also proud that we continued to work through the difficult decision to try a new approach even after we had already spent a significant amount of time.
What we learned
We learned about Python and the various frameworks that were needed to make it suitable for the project. We were also able to get more hands-on experience with external APIs
What's next for Climate Calendar
We hope to optimize the application's search process to increase performance as well as include more options for data analysis and visualization, like an average function or data graphs. We also hope to improve the overall user experience and add more data locations as well.

Log in or sign up for Devpost to join the conversation.