-
-
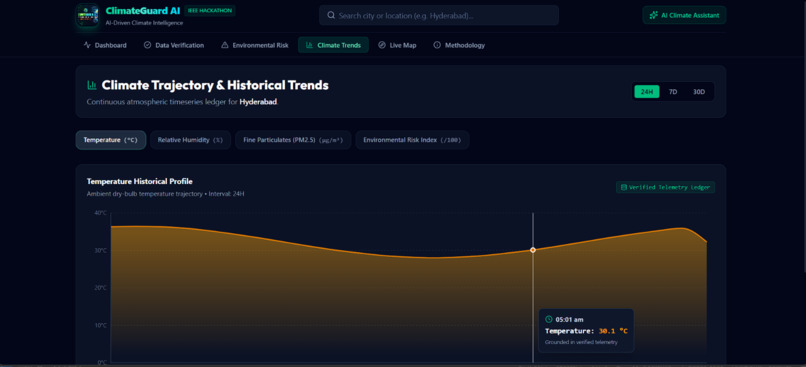
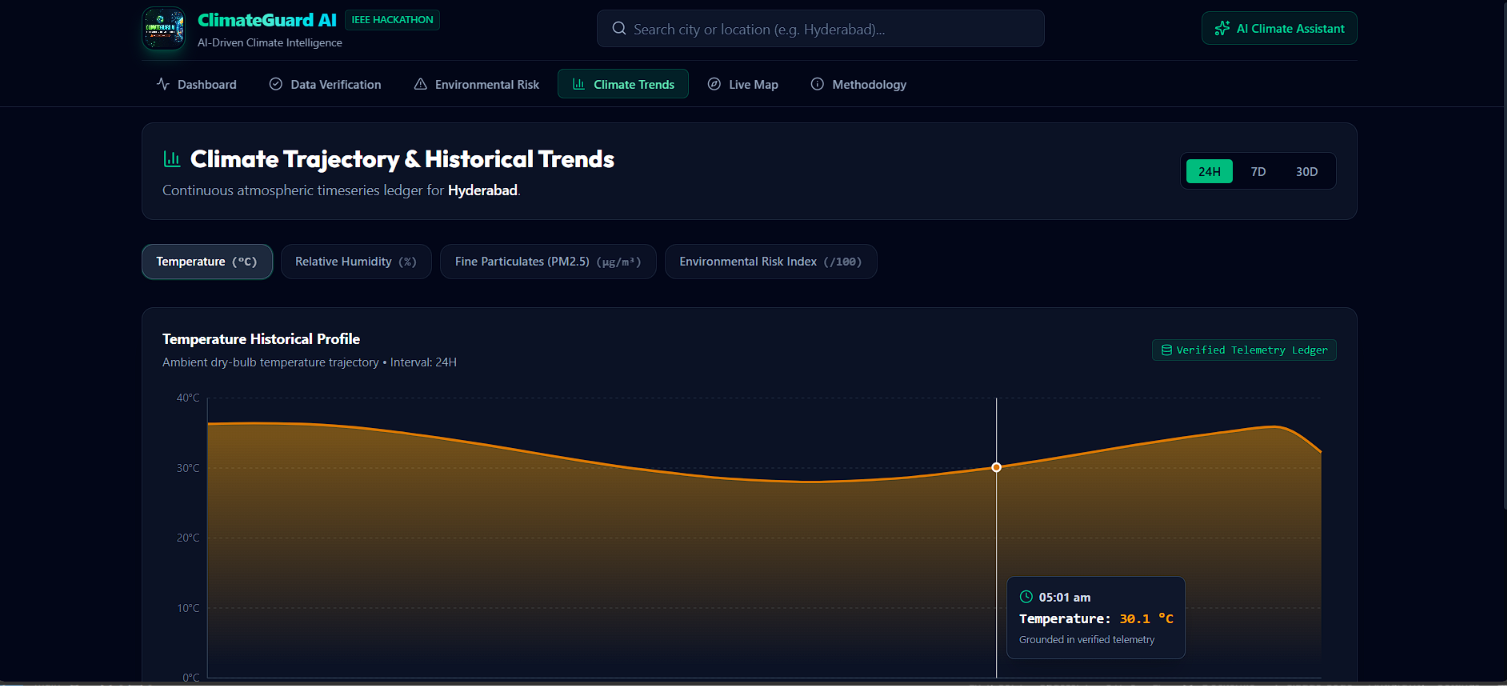
Climate Trends
-
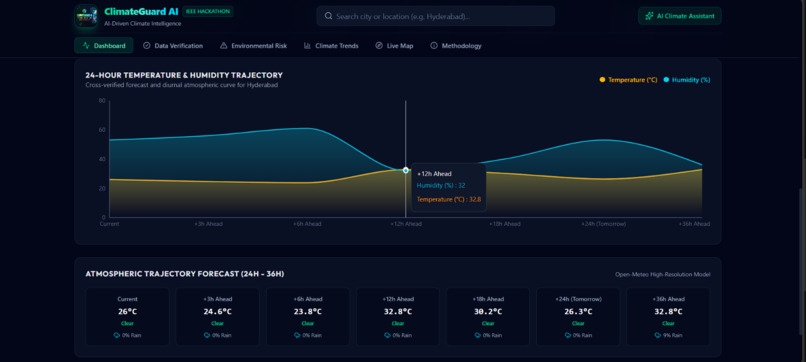
-
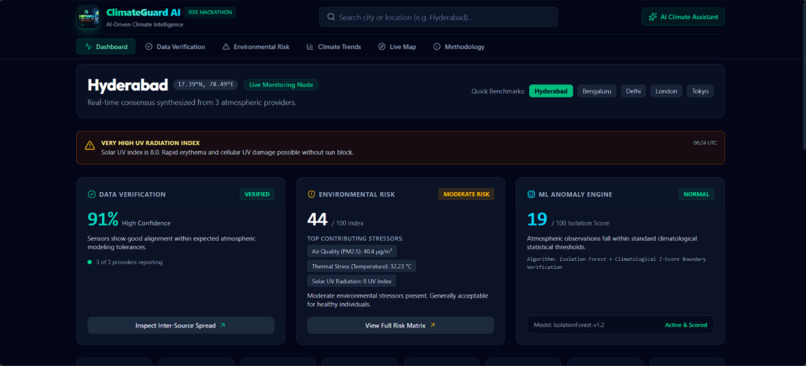
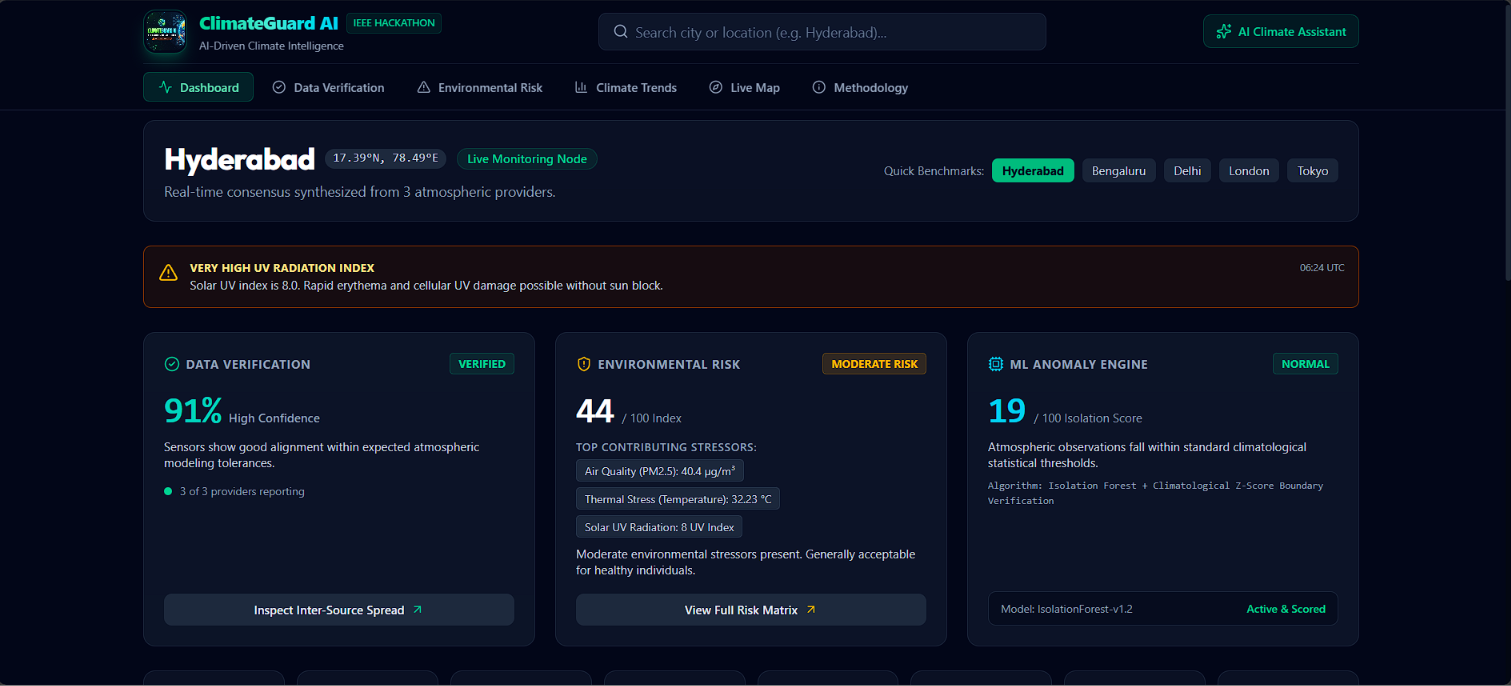
Dashboard
-
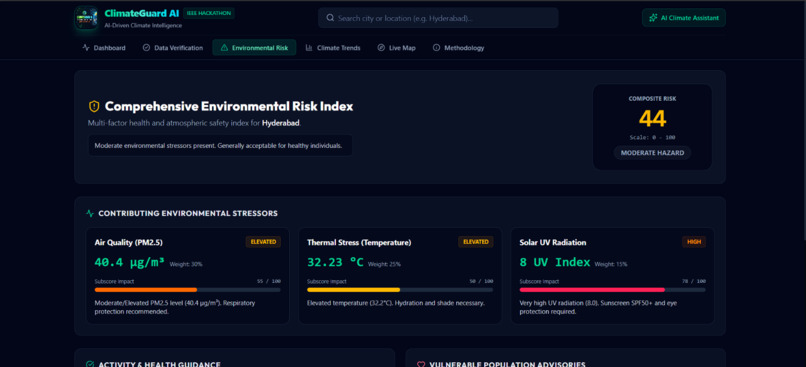
Environmental Risk
-
Data Verification
-
-
-
-
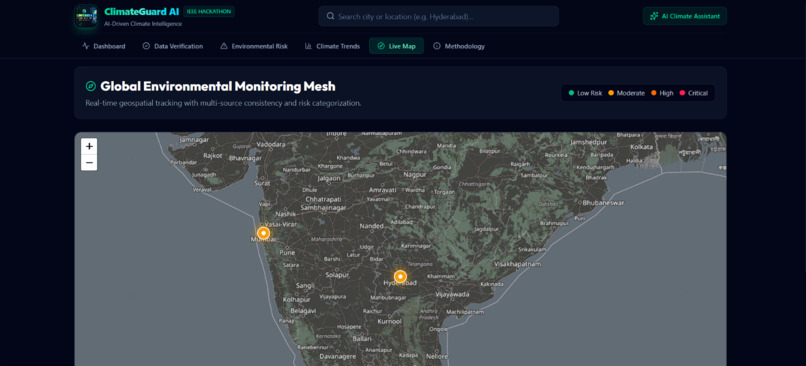
Live Map
Inspiration
Climate and environmental information is becoming increasingly important in our daily lives. Weather conditions, air quality, temperature, humidity, rainfall, UV levels, and other environmental factors can directly affect people's health, agriculture, transportation, education, and day-to-day decisions.
While a large amount of environmental data is already available through different weather services and APIs, we noticed that the information is scattered across multiple platforms. Different sources may provide slightly different values for the same location, and it is not always easy for a normal user to understand which information is reliable. Most existing applications mainly display weather information, but they do not focus on comparing different data sources, identifying inconsistencies, or converting the collected information into meaningful environmental insights.
This motivated us to build ClimateGuard AI, a software-based climate data and environmental monitoring platform. Our idea was to bring data from multiple sources into one system and use data processing and AI techniques to make the information more reliable, understandable, and useful.
We wanted to go beyond building another weather application. Our goal was to create a system that can collect environmental data, compare information from different sources, identify unusual or inconsistent values, estimate environmental risk, and present the results through a simple and interactive dashboard.
What it does
ClimateGuard AI is a software-only platform for climate data collection, verification, analysis, and environmental monitoring.
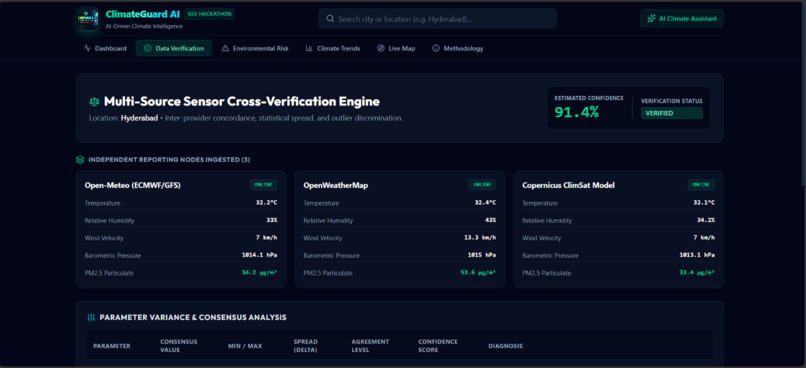
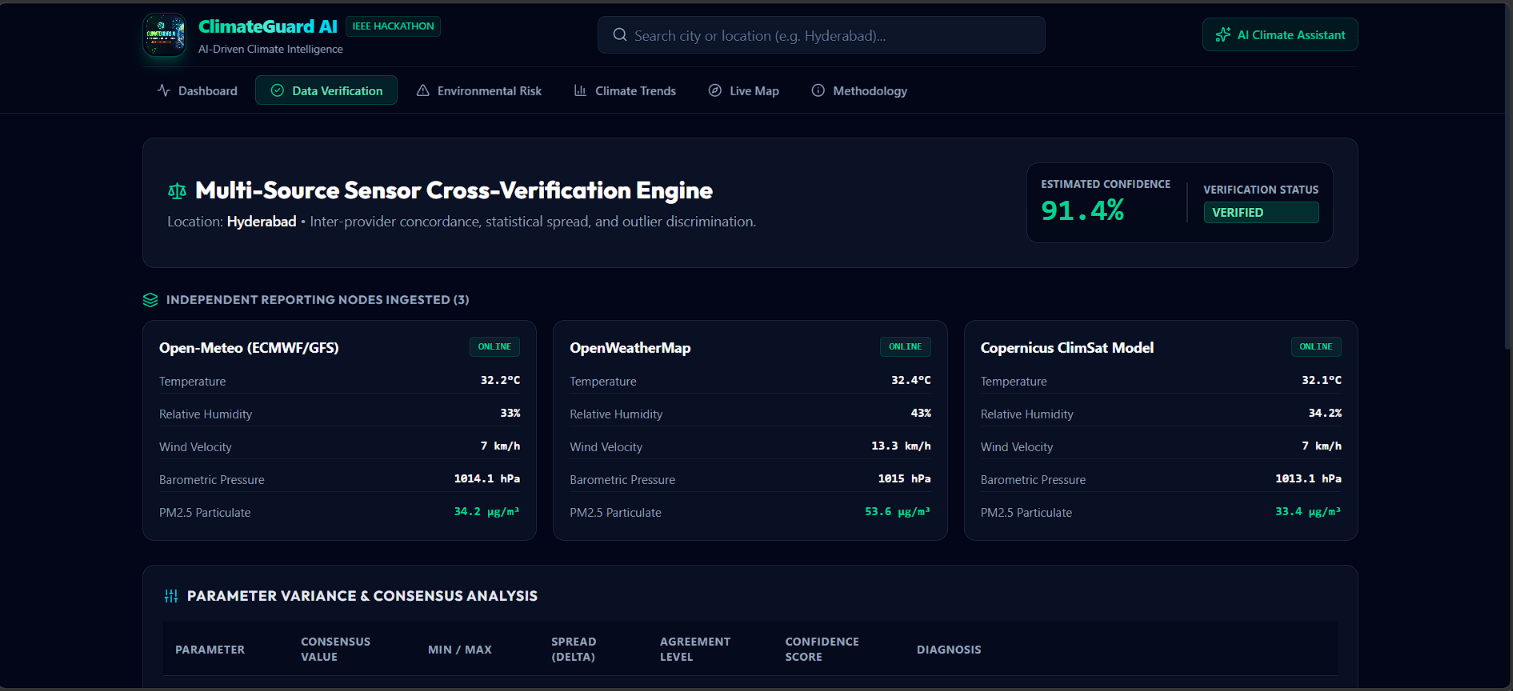
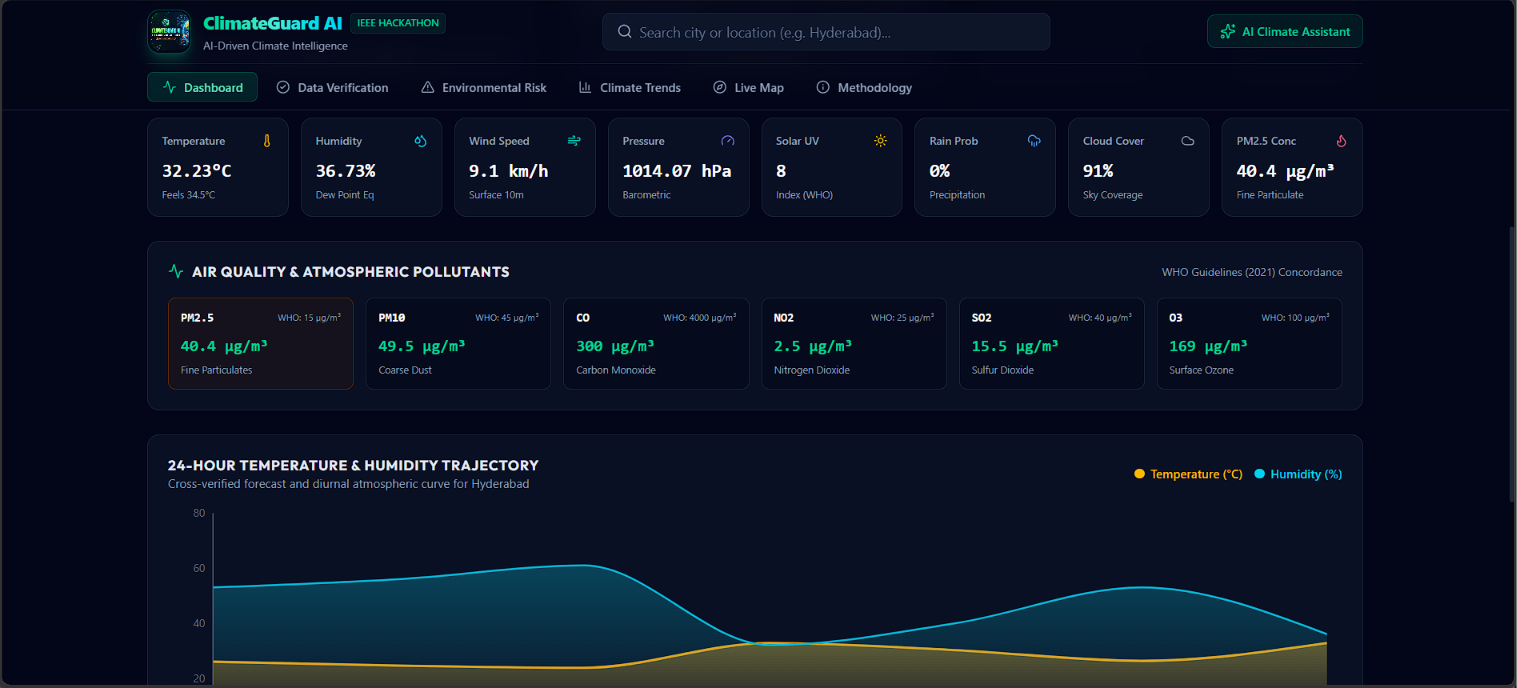
The platform allows users to search for a location and view its current environmental conditions. Instead of depending on a single data source, ClimateGuard can collect information from multiple weather and environmental APIs and compare the results.
The system can monitor parameters such as:
- Temperature
- Feels-like temperature
- Humidity
- Wind speed
- Atmospheric pressure
- Rain probability
- Cloud cover
- UV index
- Air quality
- PM2.5
- PM10
- CO
- NO₂
- SO₂
- O₃
- Other available environmental parameters
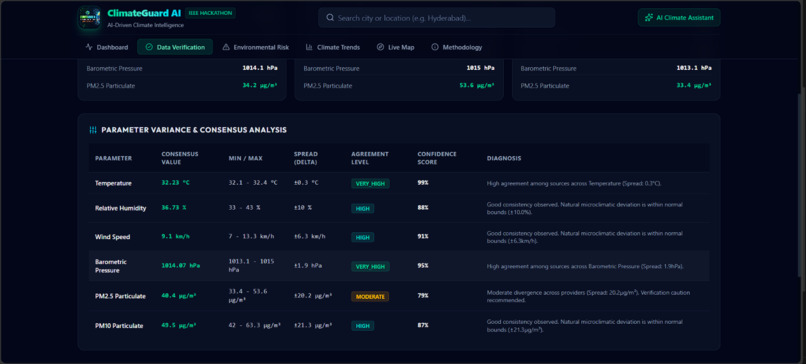
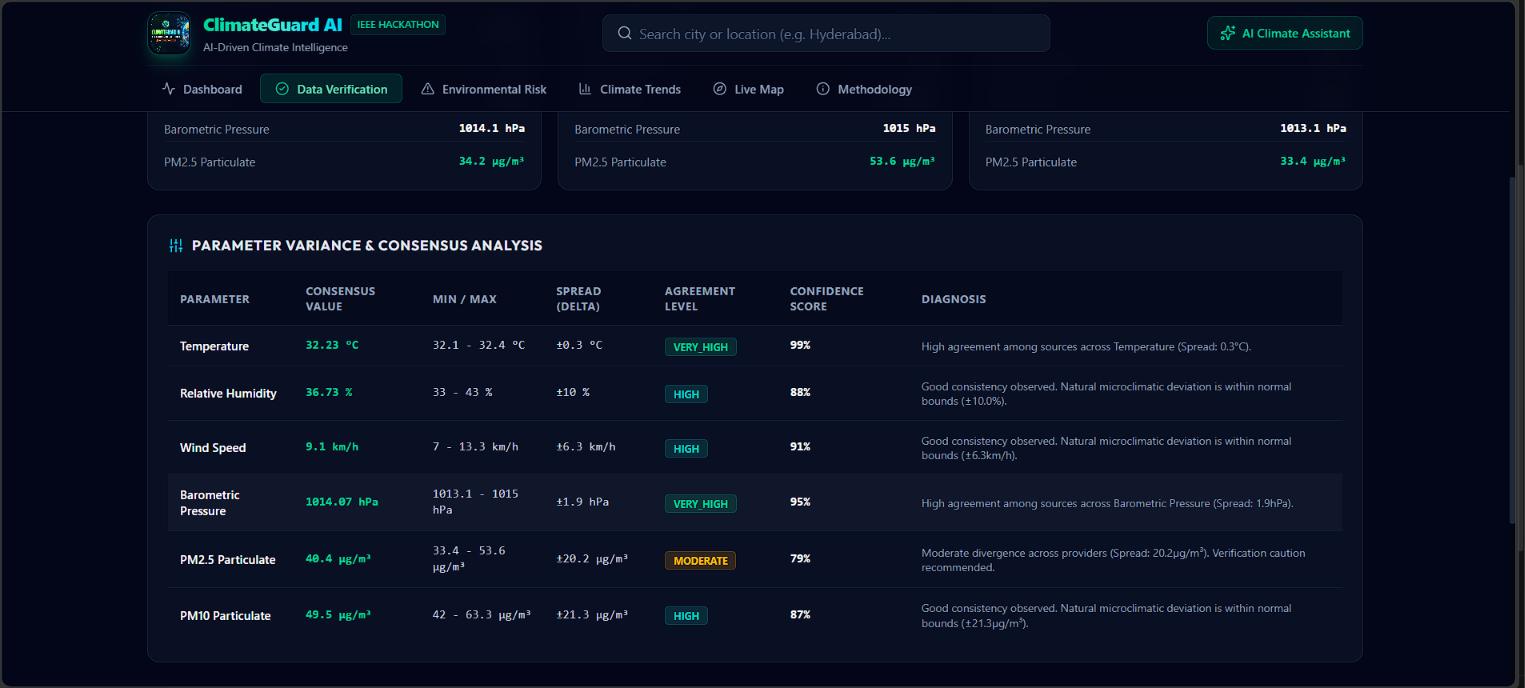
One of the main features of ClimateGuard is multi-source data verification. For example, if three different sources provide temperature values of 29.2°C, 29.5°C, and 29.1°C, the system identifies that the values are close to each other and can consider the reading highly consistent. If one source suddenly reports a significantly different value, the system can flag it as a possible inconsistency.
The platform also generates a data confidence score based on the consistency of the collected information. This helps users understand not only the environmental condition but also how consistent the available data is.
Another important feature is AI-based anomaly detection. ClimateGuard analyzes collected and historical environmental data to identify unusual patterns. For example, if the temperature for a particular location normally remains within a certain range but a sudden abnormal value is received, the system can flag it as an anomaly and provide possible explanations such as an extreme environmental event or a potentially unreliable data reading.
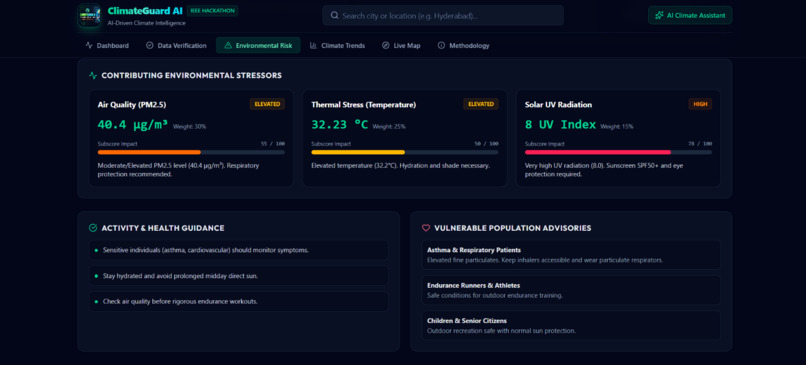
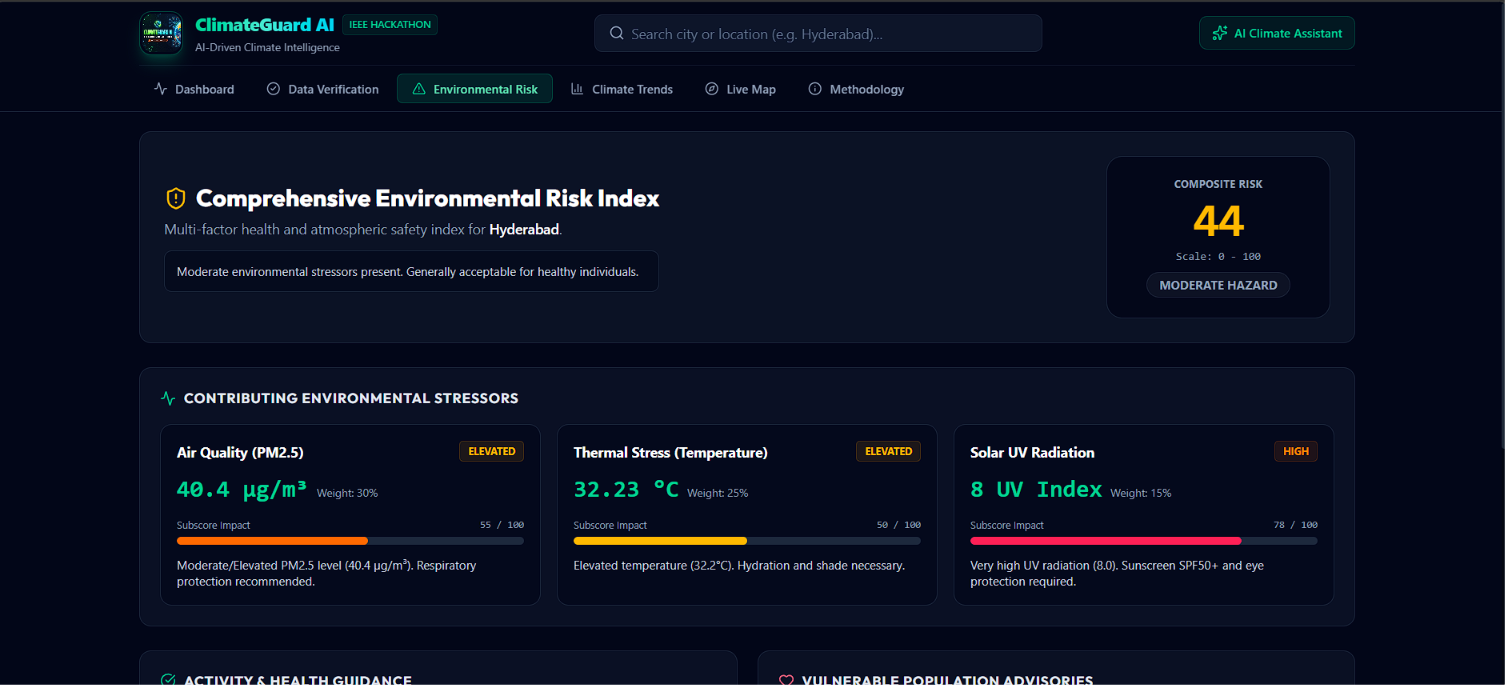
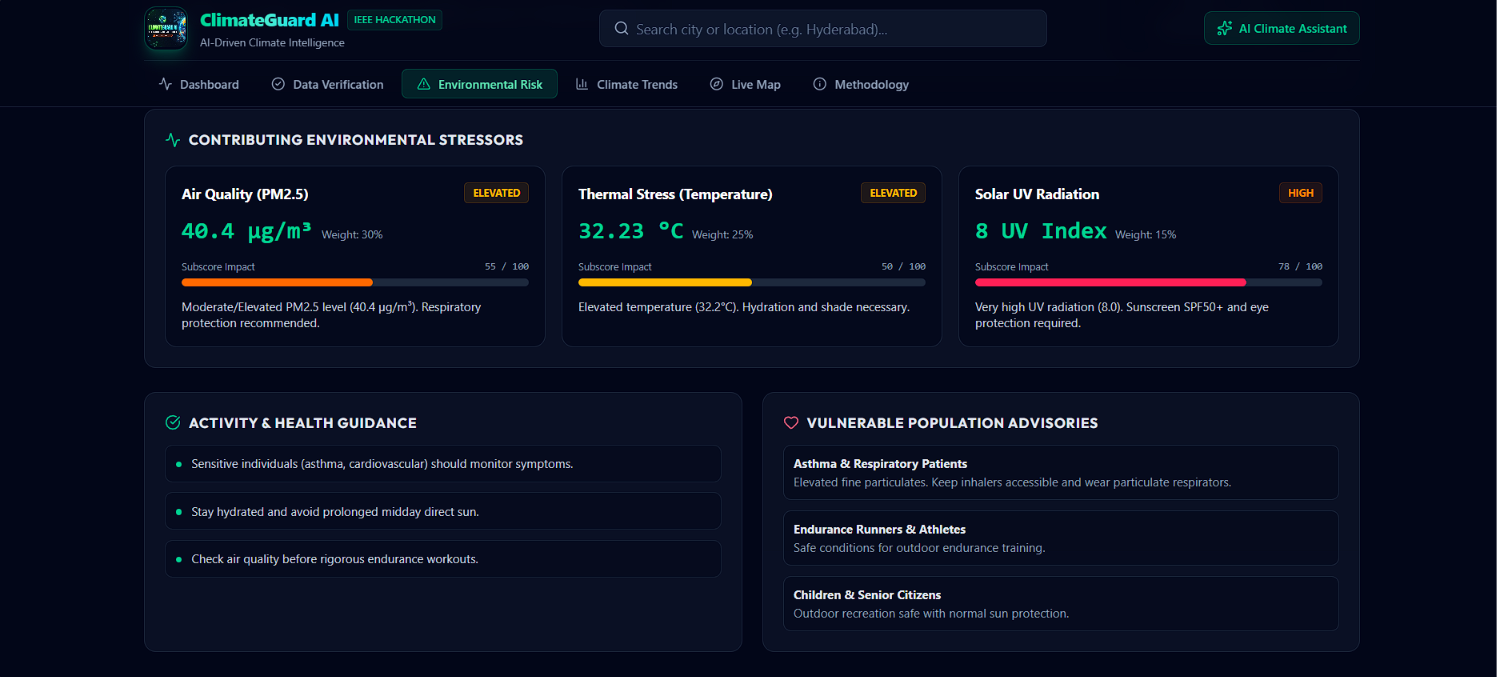
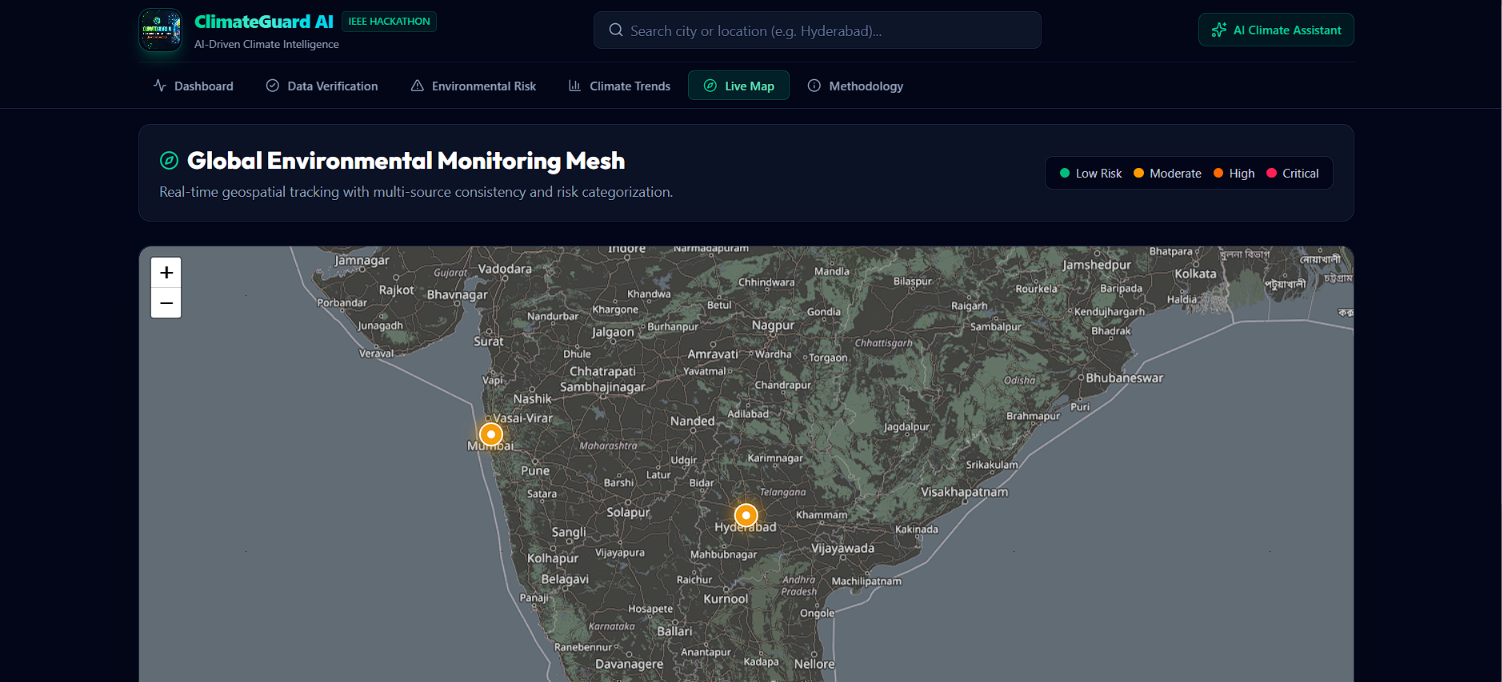
ClimateGuard also converts multiple environmental parameters into an Environmental Risk Score. Instead of forcing users to interpret several different measurements themselves, the system provides a simple overall indication such as Low, Moderate, High, or Critical risk.
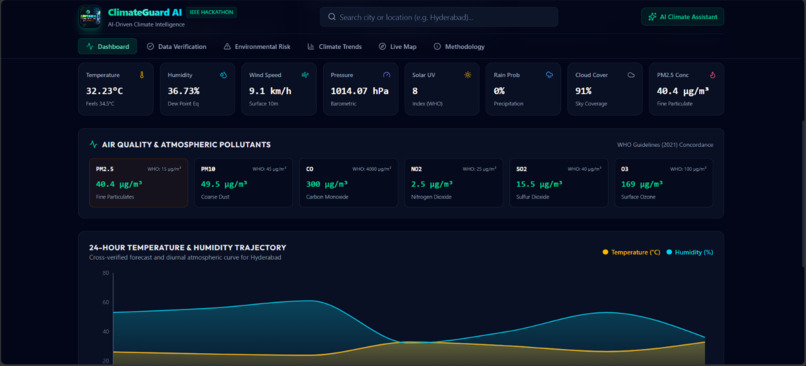
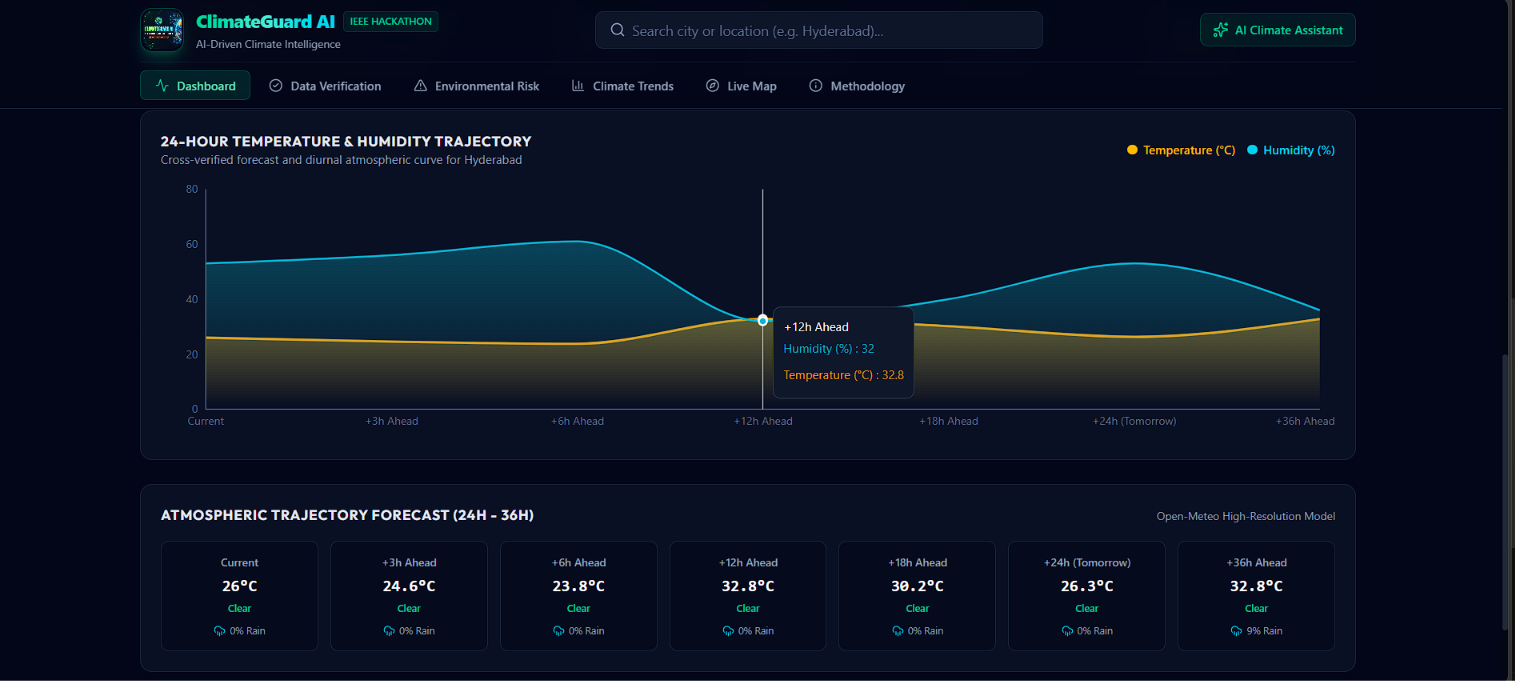
The information is presented through an interactive dashboard containing charts, statistics, location-based information, historical trends, alerts, and environmental insights.
How we built it
We decided to build ClimateGuard as a purely software-based solution, so that the platform does not depend on physical sensors or additional hardware. This makes the system easier to deploy across different locations and allows us to demonstrate the complete solution using real-world environmental APIs.
The frontend is designed as an interactive web application where users can search for locations, view current conditions, analyze historical information, compare environmental parameters, and understand the generated risk levels.
For the backend, we use Python with FastAPI to create APIs and manage communication between the frontend, external data sources, database, and AI/ML components.
The system follows a modular architecture:
- The user selects or searches for a location.
- The backend identifies the required location information.
- Weather and environmental APIs are queried.
- Data from different sources is collected.
- The collected data is normalized into a common format.
- The system compares the values received from different sources.
- Data consistency and confidence are calculated.
- Historical information is stored for further analysis.
- AI/ML models analyze the collected data.
- Anomalies and unusual patterns are identified.
- Environmental risk is calculated.
- The processed information is sent to the frontend.
- The dashboard presents the results through charts, indicators, maps, and alerts.
For weather information, we plan to integrate services such as Google Weather API along with other independent weather or environmental data sources. Google Cloud services are also used where required for location-based services and API management.
We are also designing the system so that API credentials and service-account credentials remain on the backend instead of being exposed to the frontend. This improves the security of the application and follows a proper client-server architecture.
For data storage, we use a database to maintain historical environmental information. Storing historical data allows the system to compare current conditions with previous observations and provides a foundation for future prediction and trend analysis.
For the AI/ML layer, we use Python-based data processing and machine learning techniques. The initial focus is on anomaly detection and environmental risk analysis. As the project develops, historical data can be used to improve forecasting and prediction models.
For visualization, the dashboard contains interactive charts that allow users to understand changes in temperature, air quality, humidity, rainfall probability, and other parameters over time.
Challenges we ran into
One of the biggest challenges we faced was that different APIs do not always provide information in exactly the same format. Different services may use different units, field names, update frequencies, or methods of calculating certain environmental parameters.
To solve this, we designed a common data-processing layer that converts the incoming information into a standardized structure before it is analyzed.
Another challenge was deciding how to determine whether data is reliable. Simply selecting one API as the correct source would not solve the problem of data verification. Therefore, we decided to compare values from multiple sources and calculate how closely they agree with each other.
For example, if most sources report similar values but one source provides an extreme value, the system should not blindly accept or reject it. Instead, it should identify the inconsistency and assign an appropriate confidence level.
Another challenge was handling missing data. Not every API provides every environmental parameter for every location. Our system therefore needs to handle missing values without causing the entire analysis to fail.
API limitations were another important challenge. External APIs may have request limits, authentication requirements, response-time differences, and different availability depending on the service. We had to design the backend so that these limitations would not negatively affect the user experience.
We also faced the challenge of making the platform understandable to non-technical users. Environmental data contains many numbers and measurements, but displaying too many values can make the application confusing. We therefore focused on converting raw measurements into meaningful indicators, graphs, confidence scores, risk levels, and simple explanations.
Building the AI component was another challenge. We did not want to simply add AI to the project without a real purpose. We focused on using AI where it can provide practical value, especially in identifying unusual environmental patterns and supporting environmental risk analysis.
Accomplishments that we're proud of
One of our biggest accomplishments is that we developed the concept as a purely software-based environmental monitoring platform, without depending on physical IoT sensors.
This makes the system easier to demonstrate, deploy, and scale. Any location with available environmental data can potentially be monitored through the platform.
We are particularly proud of the multi-source data verification concept. Instead of displaying information from a single weather API, ClimateGuard is designed to compare information from multiple sources and provide an indication of data consistency.
Another accomplishment is the development of the Environmental Risk Score. Environmental conditions are represented using multiple parameters, and the platform attempts to convert these measurements into a simpler risk indicator. This allows users to understand the overall environmental situation without having to interpret every individual parameter.
We are also proud of integrating AI into the project in a meaningful way. Rather than using AI only as a chatbot, we use it as part of the environmental analysis pipeline for anomaly detection and future prediction.
The project also helped us bring together several technologies into a single working architecture, including:
- Web development
- REST APIs
- Python
- FastAPI
- Cloud services
- Databases
- Data processing
- Data visualization
- Machine learning
- Location-based services
Another accomplishment is that the architecture is designed to be expandable. New APIs, environmental parameters, machine learning models, and monitoring locations can be added without completely redesigning the system.
What we learned
Working on ClimateGuard AI helped us understand how real-world software systems are built beyond simply writing code.
One of the major things we learned was how to work with external APIs. We learned how to authenticate requests, handle API responses, process JSON data, deal with errors, and convert information from different sources into a common format.
We also learned that real-world data is not always clean or consistent. Data can contain missing values, unexpected readings, different units, delays, or conflicting information. This made us understand why data preprocessing and validation are important before applying machine learning models.
We learned how backend systems can act as a bridge between a frontend application and multiple external services. Using FastAPI helped us understand how REST APIs can be created and how the frontend can communicate with the backend.
We also gained experience with cloud services and secure API management. In particular, we learned why API keys and service-account credentials should not be exposed in frontend code and why sensitive credentials should be handled on the server side.
Another important learning was related to machine learning. We understood that adding an ML model is not enough; the model must solve an actual problem. In our case, anomaly detection has a clear purpose because environmental data can contain unusual or inconsistent readings.
We also learned about data visualization and user experience. Environmental information can become difficult to understand when too many numbers are displayed together. Good visualization is therefore important for converting technical data into useful information.
Most importantly, this project taught us how different areas of technology can work together. Climate monitoring is not only about collecting weather data. It involves data collection, verification, processing, analysis, visualization, AI, cloud services, and user interaction.
What's next for ClimateGuard
Our current version focuses on collecting, comparing, verifying, and analyzing weather and environmental information. However, there are several ways in which we can extend ClimateGuard in the future.
The first improvement will be to increase the number of reliable environmental data sources. More independent sources can improve the reliability of the verification system and allow us to provide better confidence estimates.
We also plan to improve the AI models used for anomaly detection. As more historical data becomes available, the system can learn the normal environmental patterns of different locations and identify unusual changes more accurately.
Another important future feature is environmental forecasting. Instead of only showing the current condition, ClimateGuard can predict how environmental parameters may change over the next few hours or days.
For example:
Current PM2.5: 42

Predicted:
6 hours → 48
12 hours → 55
24 hours → 63
Built With
- api
- apis
- artificial
- climate
- cloud
- css
- fastapi
- gps
- intelligence
- javascript
- learning
- machine
- maps
- monitoring
- numpy
- open-meteo
- openweather
- pandas
- python
- react
- rest
- scikit-learn
- supabase
- tailwind
- weather

Log in or sign up for Devpost to join the conversation.