-

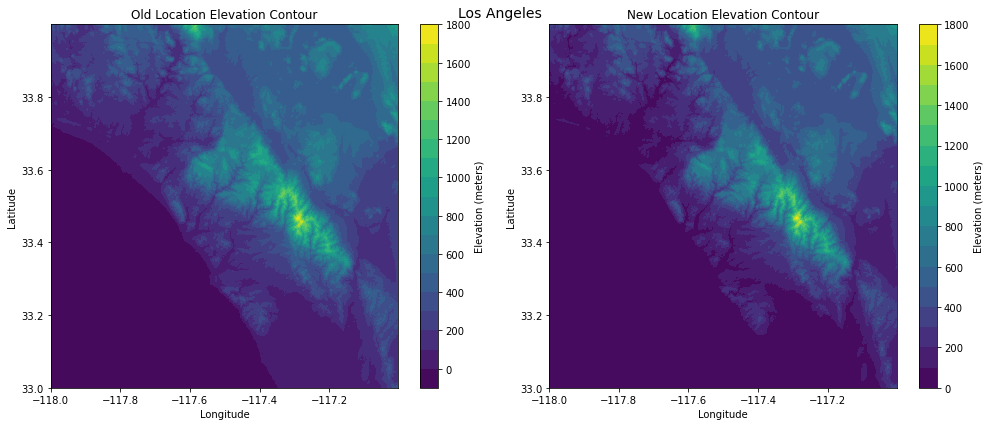
Elevation map of LA with 10 meter sea rise
-
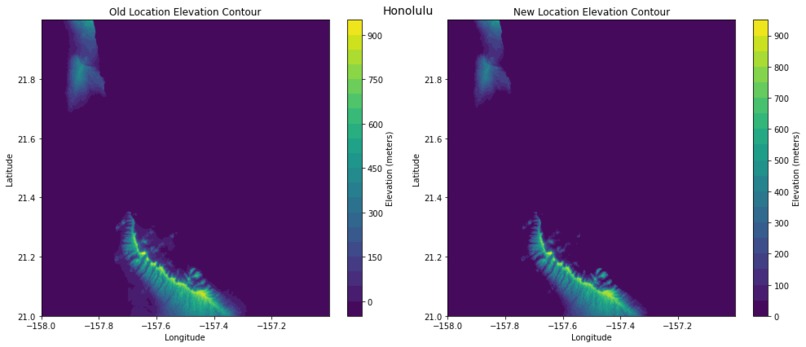
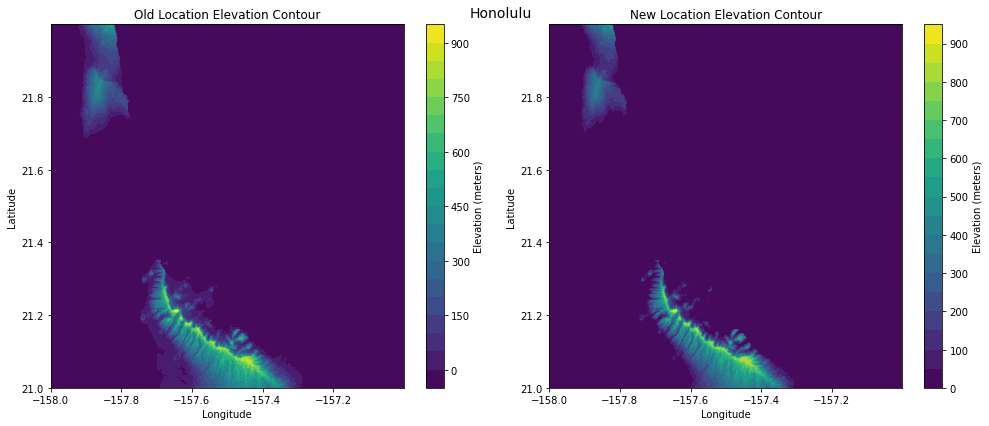
Elevation map of Honolulu with 10 meter sea rise
-
-
Inspiration
As climate change continues to impact our daily lives, it is important to provide easily accessible visuals on how our planet will change and help spread awareness.
What it does
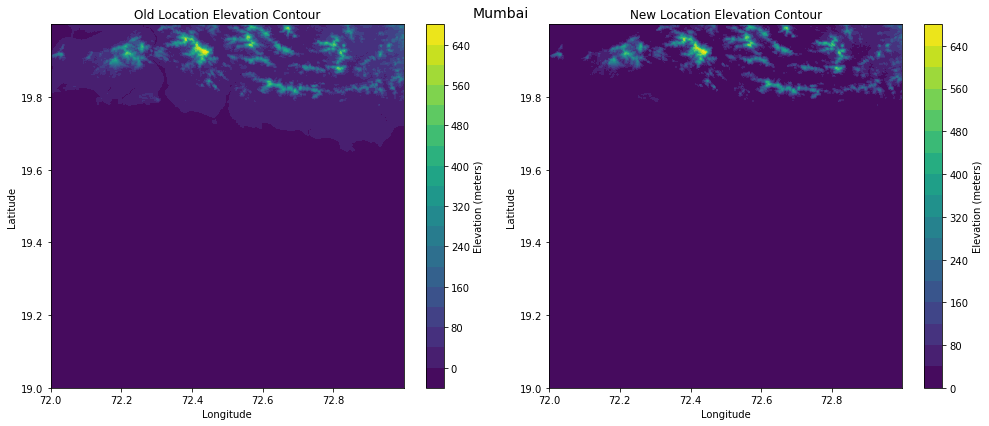
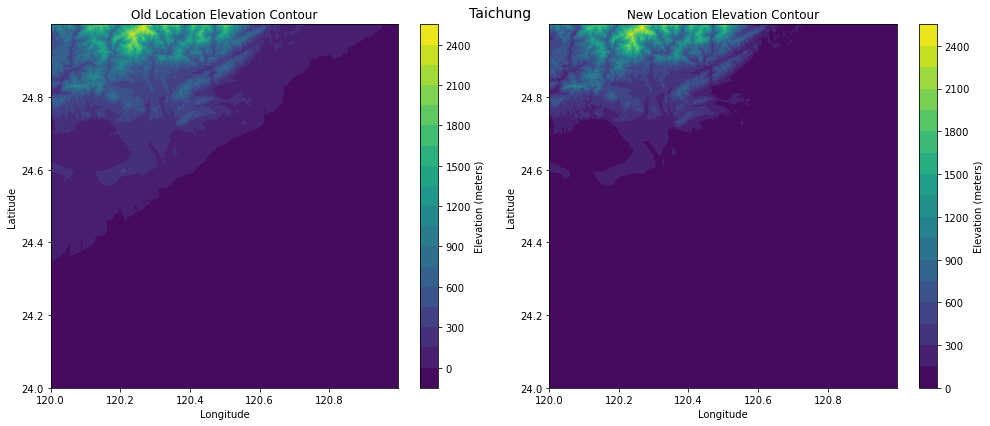
This tool accepts an elevation map that includes a coastline and a sea level rise and generates side-by-side images of the original elevation and the new coastline in order to help show which regions will be underwater.
How we built it
We prototype'd this tool in Python using USGS SRTM elevation map data.
Challenges we ran into
We struggled at first both with the file format of digital terrain elevation data (DTED) as well as generating good contour maps. Python was a new language for some of the team and learning it on the fly was a challenge.
Accomplishments that we're proud of
Figuring out how to read and manipulate digital terrain elevation data (DTED) using python packages and generating elevation contour maps.
What we learned
We learned about the USGS SRTM DTED maps, how to manipulate DTED files, and how to generate contour maps in python.
What's next for Climate Change Coastline Tool (CCCT)
Given more time, we would love to add a front-end interface such as a gui to help make it easier for users to use. As well as a way to determine more automatically what region the inputted database corresponds to.

Log in or sign up for Devpost to join the conversation.