-
-

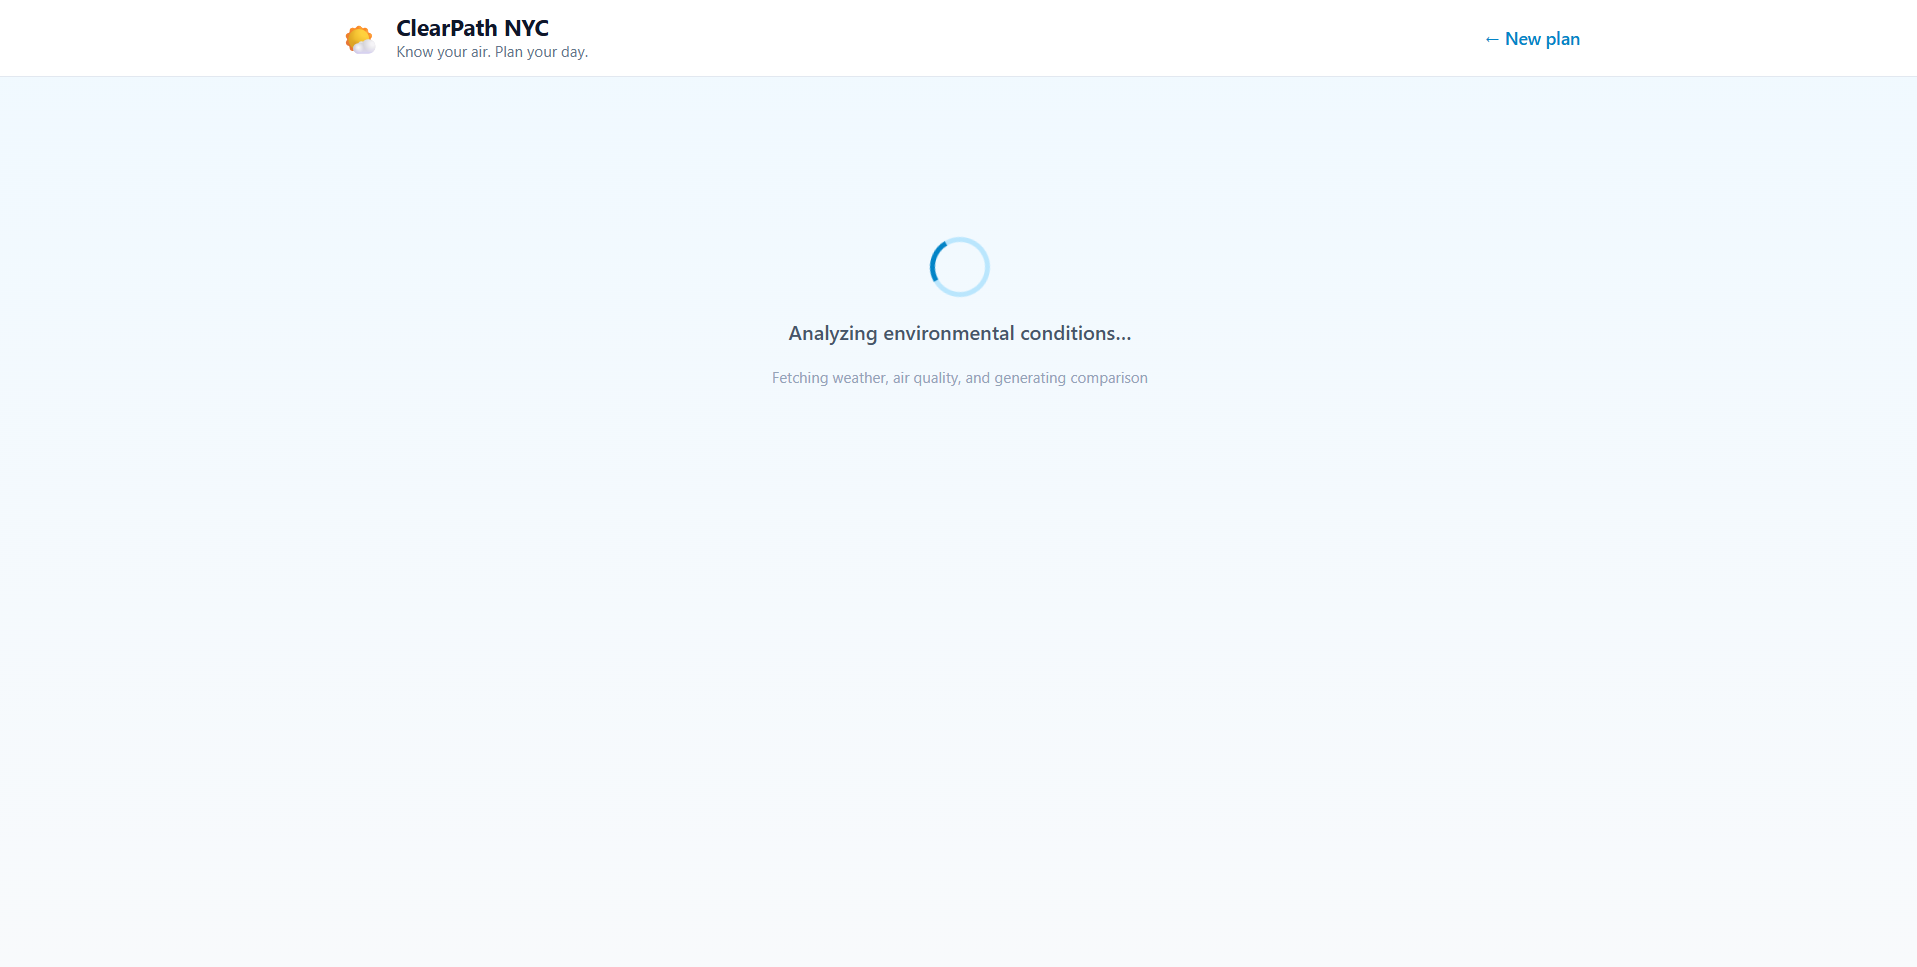
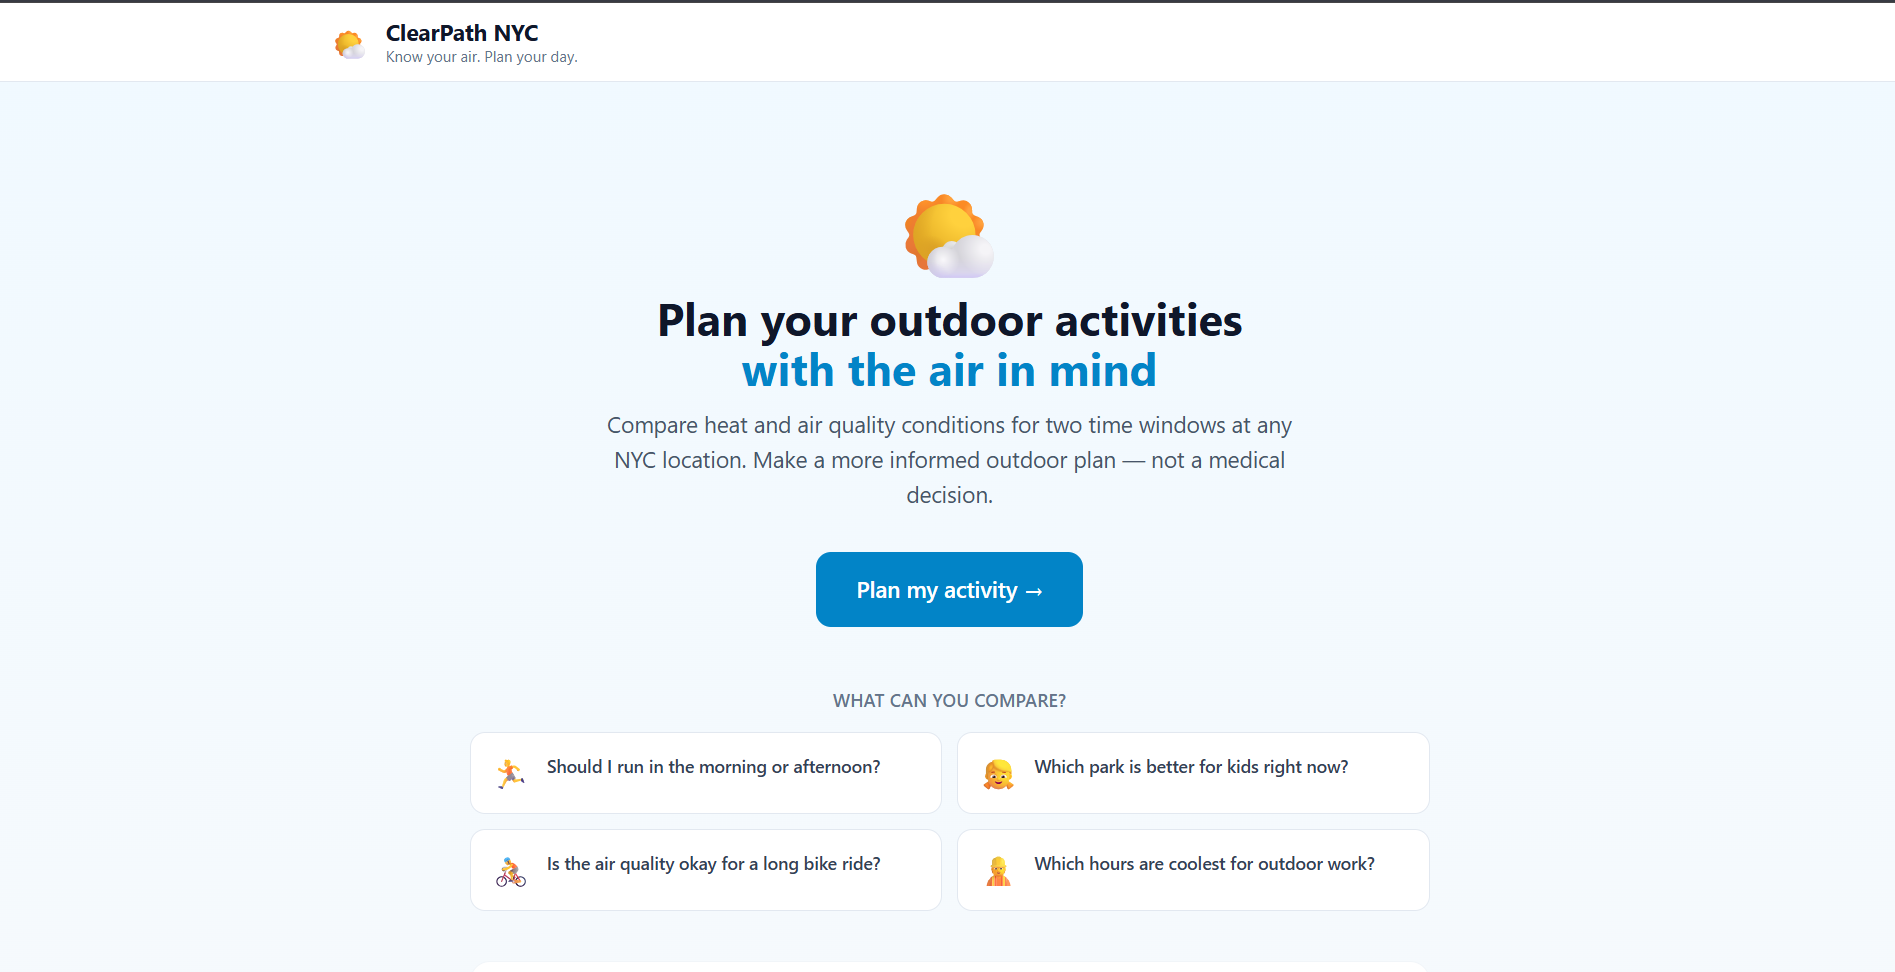
Loading Screen
-
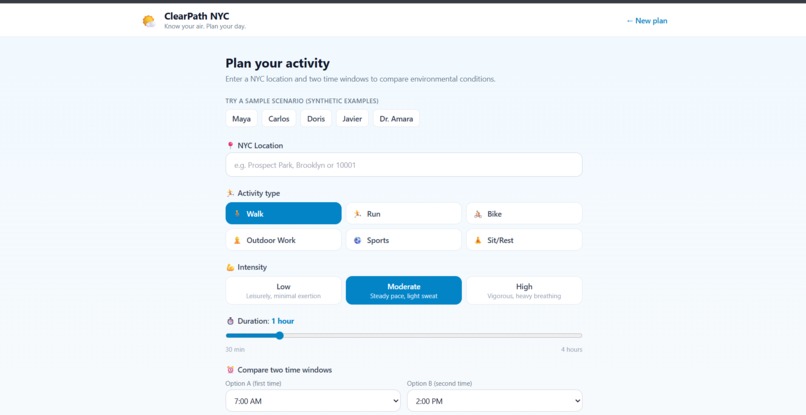
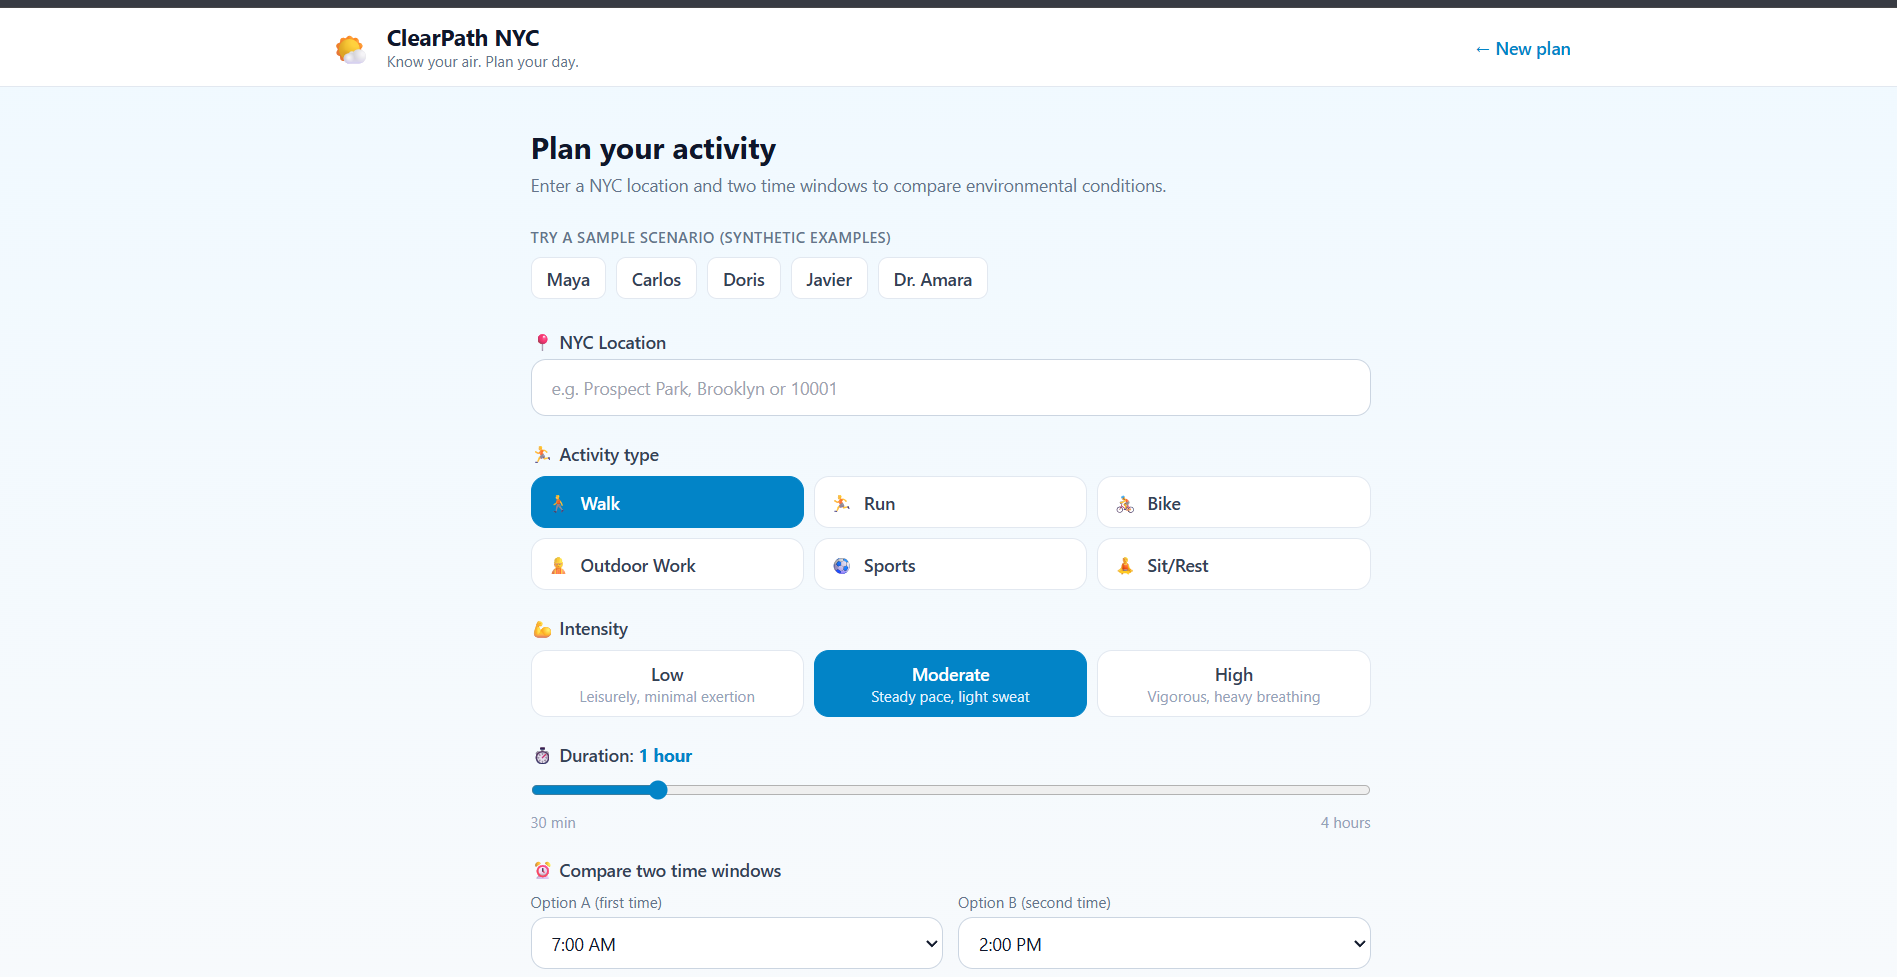
Interface
-
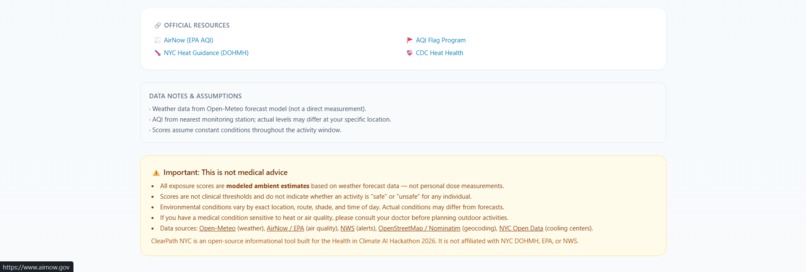
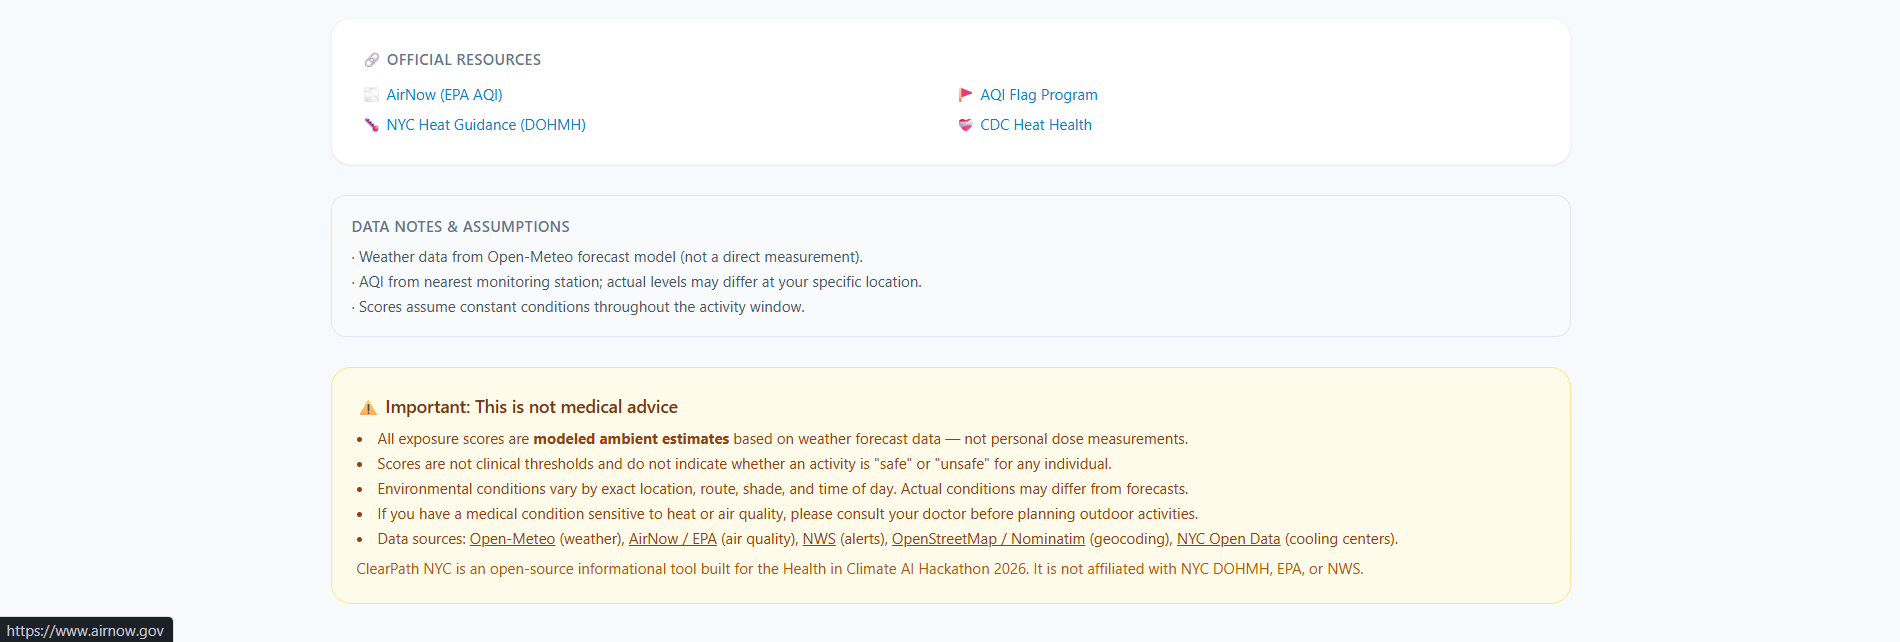
Warning that it can be wrong
-
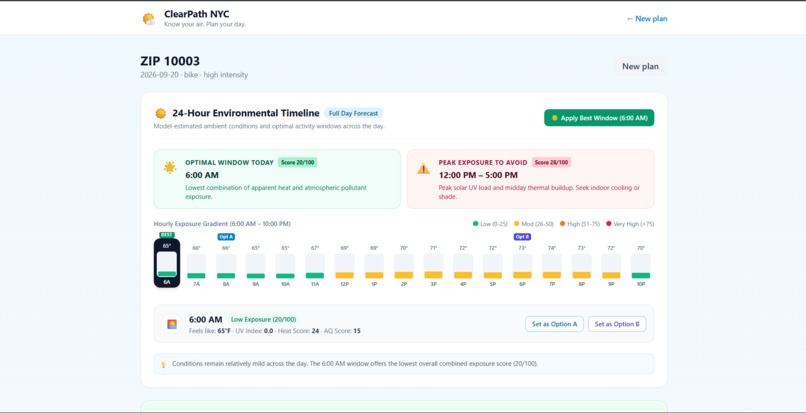
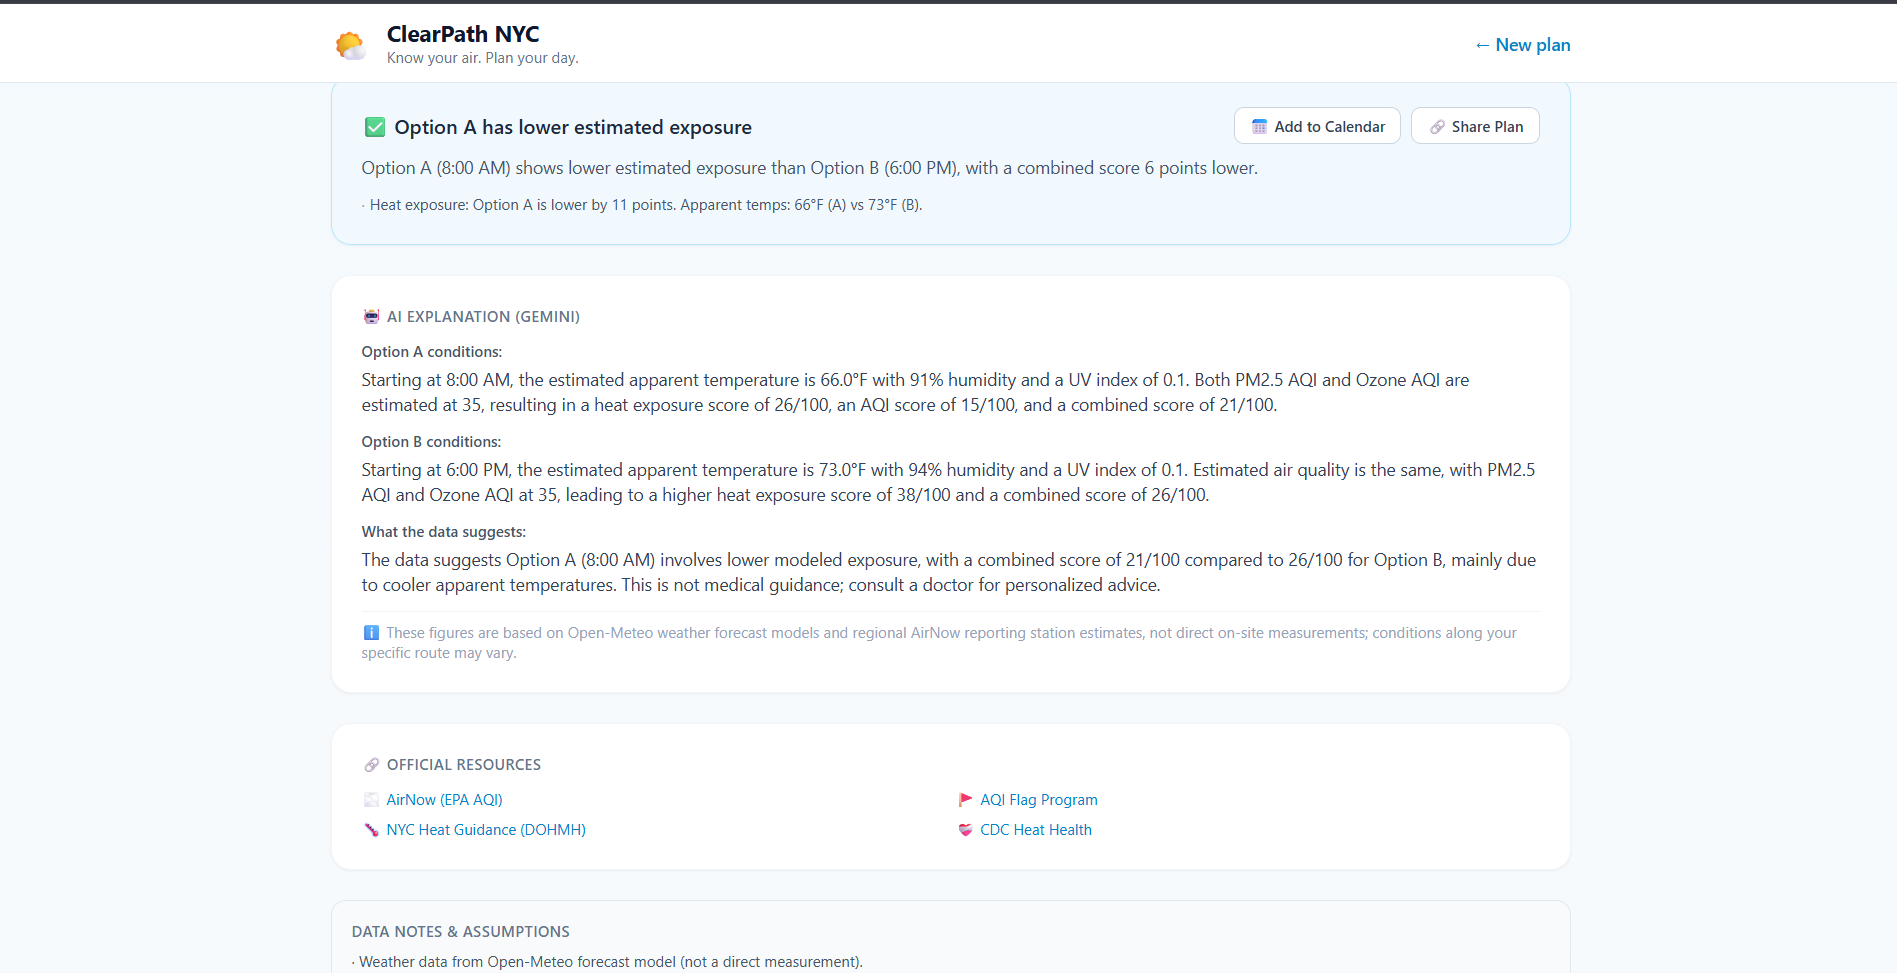
Output1
-
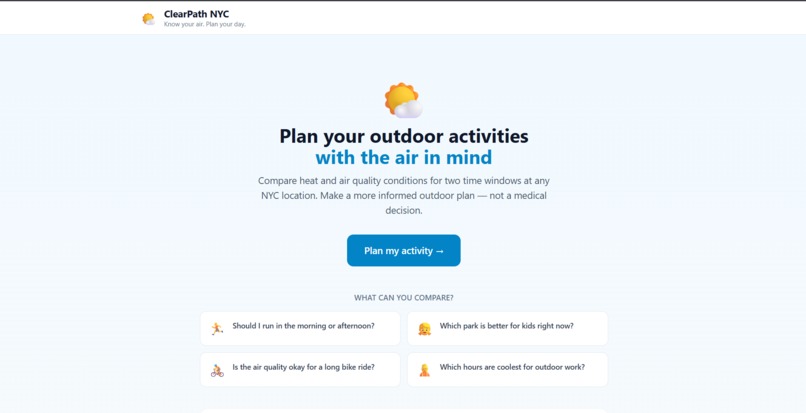
Interface
-
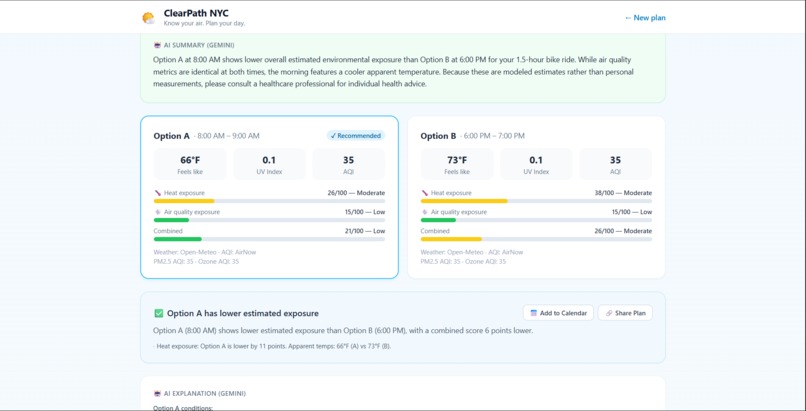
Output2
-
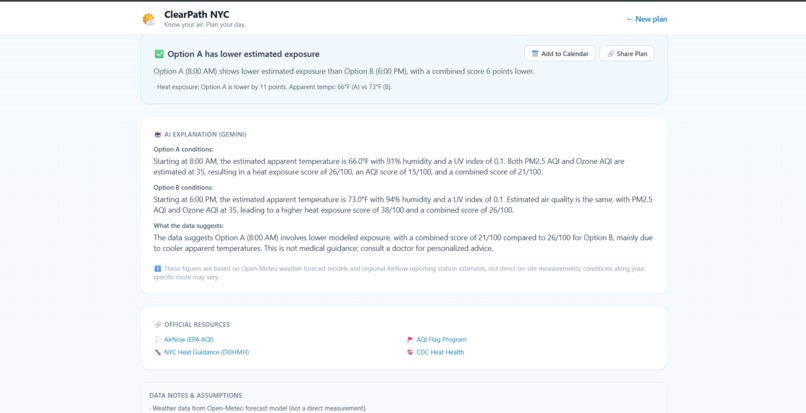
Output3
Inspiration During a New York City summer, stepping onto the pavement at 2:00 PM is an intense physical experience. Dense urban canyons and asphalt surfaces trap radiant heat—elevating temperatures through the Urban Heat Island (UHI) effect—while ground-level ozone ( O 3 O 3 ) and fine particulate matter ( PM 2.5 PM 2.5 ) concentrate along busy traffic corridors.
The NYU Department of Mental Health identified a critical public health reality: extreme heat and poor air quality are not just acute cardiovascular and respiratory threats; they are potent drivers of cognitive fatigue, irritability, mood disruption, anxiety, and sleep fragmentation. When environmental conditions worsen, vulnerable New Yorkers—an older adult walking to the subway in the South Bronx, a parent with young children in Queens, an outdoor worker on Staten Island, or an active runner in Brooklyn—face compounding health hazards.
Yet, while government bodies publish vast amounts of raw data through the National Weather Service (NWS), the EPA (AirNow), and NYC Open Data, this information is fragmented, highly technical, and completely detached from daily routines. When an everyday resident asks:
"Should I take my kids to the park at 9:30 AM or 3:30 PM?" "When is the safest time for my afternoon jog?"
they are left guessing. We were inspired to build ClearPath NYC: an open-source, community-centered digital resilience tool that turns complex climate data into proactive, personalized, and actionable outdoor planning decisions.
What it does ClearPath NYC transforms weather and air quality forecasts into an intelligent, everyday outdoor activity planner. Rather than presenting static gauges, it helps users optimize when, where, and how to carry out their plans.
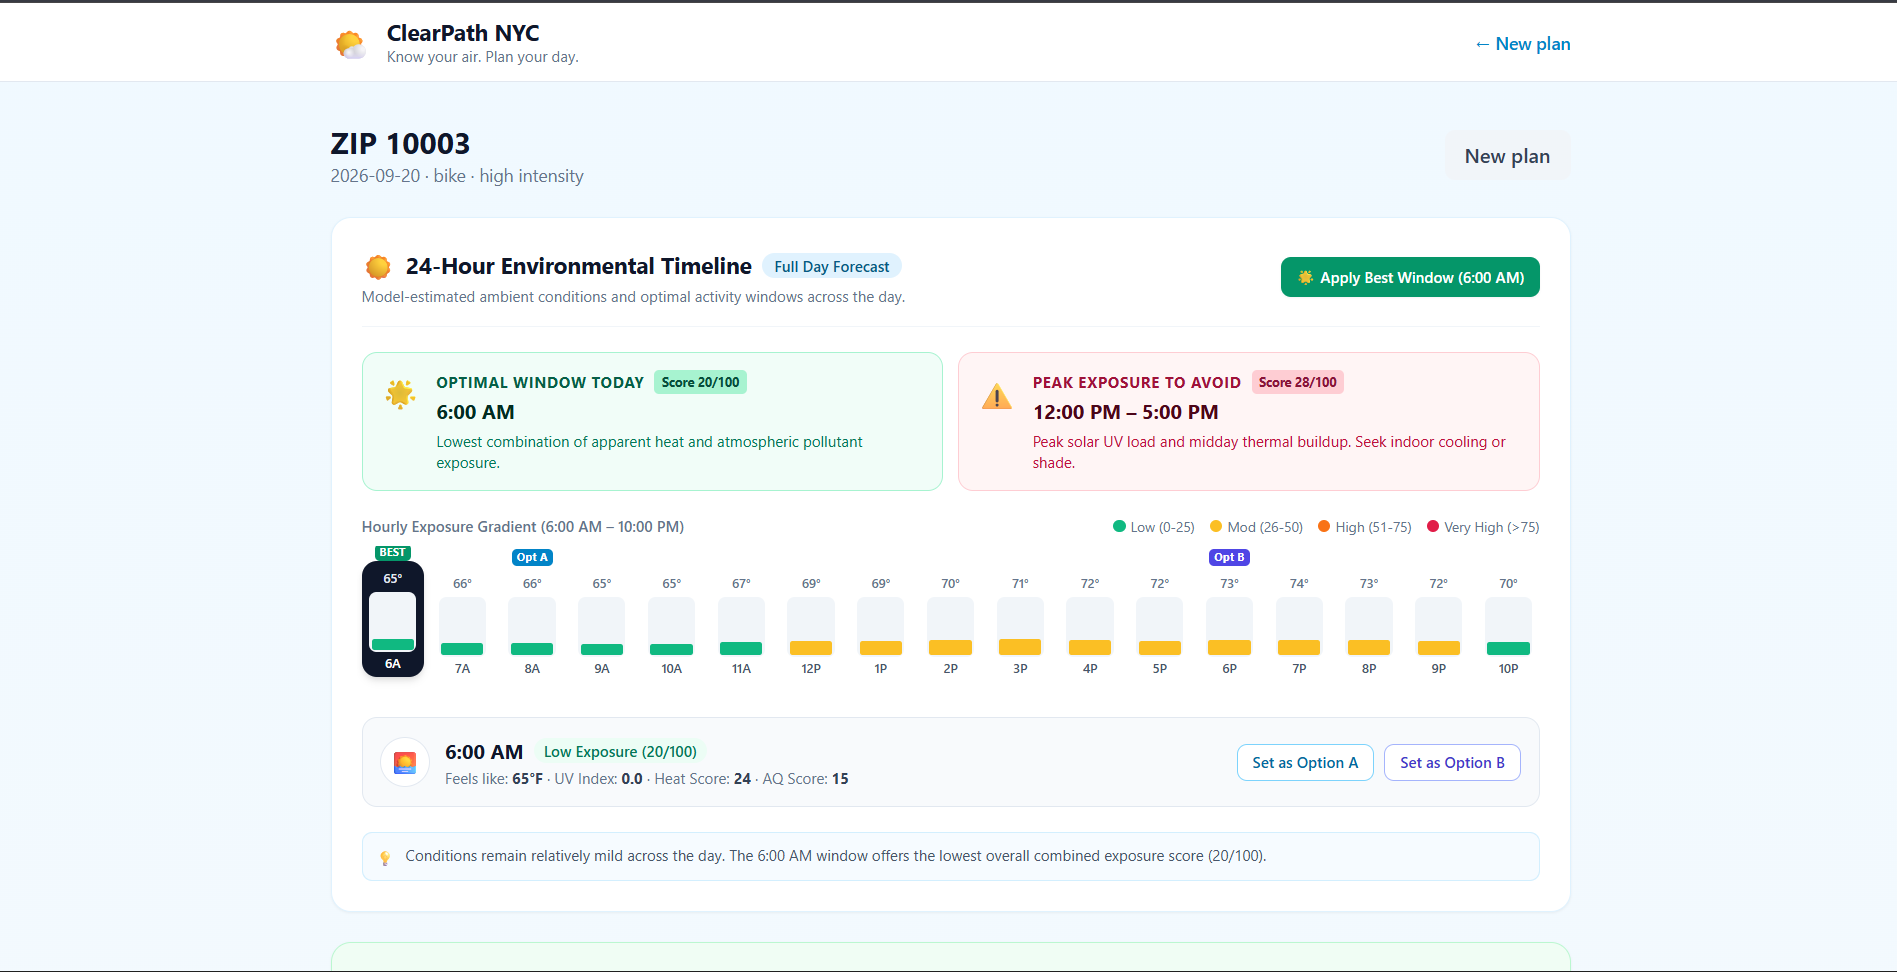
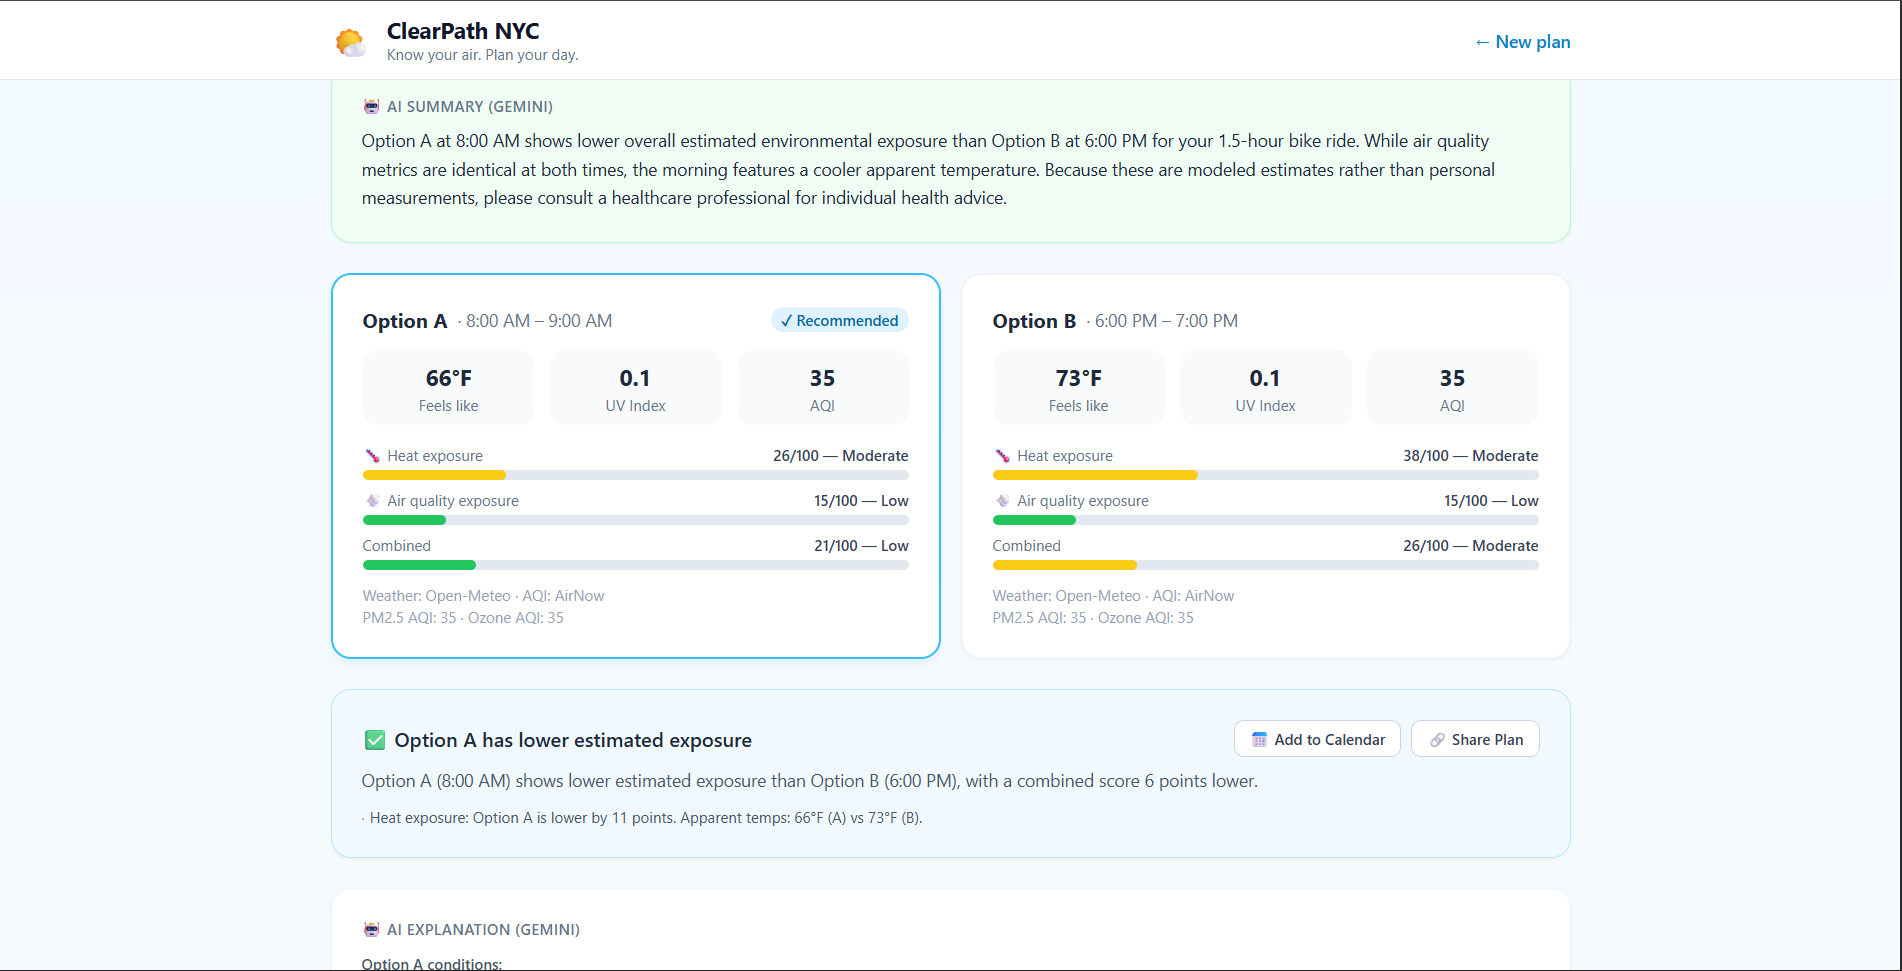
📍 Multi-Borough NYC Geocoding: Enter any street address, park, neighborhood, or NYC ZIP code (e.g., 10001, Prospect Park, Harlem). Includes an offline centroid database ensuring instant results even if third-party geocoders are unavailable. 🌟 24-Hour Timeline & Optimal Window Finder: In < 2 ms <2 ms, the engine scans the full day's forecast and automatically pinpoints the optimal activity window (lowest combined heat and pollutant exposure) while flagging peak hours to avoid (e.g., 12 : 00 PM– 4 : 00 PM 12:00 PM–4:00 PM). ⚖️ Side-by-Side Schedule Comparison: Compares two candidate time windows (e.g., Option A at 7:00 AM vs. Option B at 2:00 PM) with delta breakdowns across feels-like temperature, UV radiation, and PM 2.5 / Ozone PM 2.5 /Ozone metrics. 🏢 Civic Cooling Centers Integration: Uses Haversine calculations against the official NYC Open Data registry to locate and surface the nearest open NYC Cooling Centers when heat or air quality flags are triggered. 🤖 Grounded AI Explanations: Powered by Gemini 3.8 Flash, translating complex environmental tables into plain, empathetic language with zero hallucinations in numbers and strict guardrails against medical claims. 📅 Actionable Utility: Includes one-click "Add to Google Calendar" (with hydration and weather reminders pre-filled) and "Share Plan" clipboard exporting for family or workout partners. 👥 5 Synthetic User Personas: One-click demo presets (Maya the Runner, Carlos the Parent, Doris the Senior, Javier the Worker, Dr. Amara the Researcher) showcasing diverse vulnerability profiles. How we built it We designed ClearPath NYC with a non-negotiable architectural boundary: all mathematical modeling and threshold determinations are 100 % 100% deterministic and rule-based, while Generative AI is deployed strictly for natural language synthesis.
- Data Pipeline & Backend Architecture Built with Python and FastAPI, backed by a resilient in-memory TTL cache with graceful fallback mechanisms:
Weather Service: Ingests 7-day hourly forecasts from Open-Meteo (temperature, apparent temperature, relative humidity, wind velocity, UV index) and heat advisories from the National Weather Service API. Air Quality Service: Dual-provider client querying official EPA AirNow station forecasts, automatically falling back to the Open-Meteo CAMS (Copernicus) atmospheric model if station feeds are offline. Civic Resources Service: Ingests the NYC Open Data Cooling Center Directory ( 500 + 500+ facilities) and dynamically filters the closest open sites by geographic coordinates.
- The Deterministic Exposure Model (The Math) All exposure calculations are normalized onto a transparent [ 0 , 100 ] [0,100] scale where 0 0 is minimal exposure and 100 100 represents acute ambient stress.
Heat Exposure Score ( Score heat Score heat ): Norm ( x , x min , x max
)
max ( 0 , min ( 1 , x − x min x max − x min ) ) Norm(x,x min ,x max )=max(0,min(1, x max −x min
x−x min
)) Base
temp
Norm ( T apparent , 50 , 115 ) × 70 Base temp =Norm(T apparent ,50,115)×70 Base
UV
Norm ( U V , 0 , 10 ) × 20 Base UV =Norm(UV,0,10)×20 Score
heat
min ( 100 , ( Base temp + Base UV ) ⋅ f peak ( h ) ⋅ f duration ( D ) ⋅ μ activity ⋅ μ intensity ) Score heat =min(100,(Base temp +Base UV )⋅f peak (h)⋅f duration (D)⋅μ activity ⋅μ intensity ) Where T apparent T apparent is the Steadman apparent temperature ( ∘ F ∘ F), U V UV is solar irradiance ( 0 – 11 + 0–11+), f peak ( h
)
1.15 f peak (h)=1.15 for midday hours ( 12 : 00 – 16 : 00 12:00–16:00), and μ intensity ∈ { 1.0 , 1.25 , 1.55 } μ intensity ∈{1.0,1.25,1.55}.
Air Quality Exposure Score ( Score AQI Score AQI ): AQI
dominant
max ( AQI PM2.5 , AQI O 3 ) AQI dominant =max(AQI PM2.5 ,AQI O 3
) Score
AQI
min ( 100 , Norm ( AQI dominant , 0 , 300 ) × 75 ⋅ f duration ( D ) ⋅ μ ventilation ⋅ μ intensity ) Score AQI =min(100,Norm(AQI dominant ,0,300)×75⋅f duration (D)⋅μ ventilation ⋅μ intensity ) Score
combined
Score heat + Score AQI 2 Score combined = 2 Score heat +Score AQI
- The Frontend Experience Developed in React 18, Vite, TypeScript, and Tailwind CSS. It provides a fully reactive 24-hour visual gradient bar, interactive hour chips, color-coded score gauges, and persistent medical non-advice disclaimers.
Challenges we ran into Eliminating AI Hallucinations in Environmental Science: Early prototypes that asked LLMs to estimate temperatures or judge exposure resulted in plausible-sounding but physically fabricated numbers. We solved this by enforcing strict architectural isolation: all scores are computed deterministically in Python, and Gemini receives only structured calculation outputs with a system prompt forbidding data invention. Harmonizing Disparate Environmental Units: Different meteorological providers report atmospheric data in mismatched units ( μ g/m 3 μg/m 3 vs. ppb ppb vs. AQI index) and temporal resolutions (24-hour rolling averages vs. hourly forecasts). We implemented piecewise EPA NowCast breakpoint formulas to unify disparate data streams into a single coherent standard. Geocoding Resilience & Third-Party Rate Limits: Public geocoders like OpenStreetMap Nominatim enforce strict usage policies and occasionally return 403 or rate-limit rapid typing. We engineered an offline multi-tiered fallback table indexing all 5 NYC boroughs, landmark parks, and dozens of NYC ZIP codes (e.g., 10001) to guarantee zero-downtime resolution. Navigating Ethical & Medical Boundaries: Providing health-adjacent advice requires extreme caution. We ensured the application explicitly labels all metrics as modeled ambient exposure estimates, provides continuous medical non-advice notices, and avoids declaring any condition clinically "safe" or "unsafe." Accomplishments that we're proud of 19/19 Passing Automated Unit Tests: Rigorous test suite validating EPA AQI breakpoints, heat calibration extremes (sub-zero to 115 ∘ F 115 ∘ F), boundary constraints, and temporal comparison algorithms. Sub-2 Millisecond 24-Hour Evaluation: Built an ultra-fast temporal scanner that computes exposure scores for every hour of the day in memory without adding network latency. Civic Open Data Alignment: Successfully integrated the live NYC Open Data Cooling Center registry, sorting 500 + 500+ city facilities by real-time Haversine distance. Resilient Fallback Mode: If external API keys (AirNow, Gemini) are omitted, the application degrades gracefully—using Copernicus CAMS for AQI and intelligent structured templates for plain-language summaries without crashing. Production-Ready End-to-End Build: Fully containerized with Docker Compose, cleanly compiled TypeScript with Vite, and responsive across desktop and mobile devices. What we learned Small Shifts in Time Yield Massive Reductions in Exposure: Across New York City, shifting an outdoor activity from 2:00 PM to 7:00 AM on the same day can reduce modeled physiological exposure by 40 – 50 points 40–50 points. Empowering residents with proactive temporal visibility gives them agency without disrupting their active lifestyles. Civic Datasets Need Contextual Triggers: New York City's public data registries (such as cooling centers) deliver maximal real-world value when paired with geographic sorting and threshold triggers, rather than remaining static spreadsheets. The True Power of Purposeful GenAI: Generative AI delivers the highest impact not as a mathematical calculator, but as a plain-language bridge that de-jargonizes biometeorological data for non-technical residents, parents, and seniors. What's next for ClearPath NYC Hyperlocal Route Shading via 2015 Tree Census & LiDAR: Incorporating NYC's decadal Street Tree Census to calculate sidewalk canopy density, suggesting tree-lined, shade-optimized routes. Multilingual Accessibility: Adding full native Spanish and Traditional Chinese localization to ensure accessibility across New York's diverse immigrant communities. Automated Community SMS Alerts: Introducing proactive morning SMS/WhatsApp notifications via Twilio, alerting heat-sensitive seniors and caregivers when neighborhood heat or ozone thresholds are breached. Expansion to Other Dense Metros: Generalizing the architecture to other major cities facing compound climate risks (e.g., Chicago, Philadelphia, Los Angeles).
Built With
- airnow-api
- docker
- docker-compose
- fastapi
- google-gemini
- html5
- national-weather-service-api
- nominatim
- nyc-open-data
- open-meteo
- openstreetmap
- postcss
- pydantic
- pytest
- python
- react
- tailwind-css
- typescript
- uvicorn
- vite


Log in or sign up for Devpost to join the conversation.