Interactive Map : https://jeanromainroy.com/dataviz_armed_conflict.html
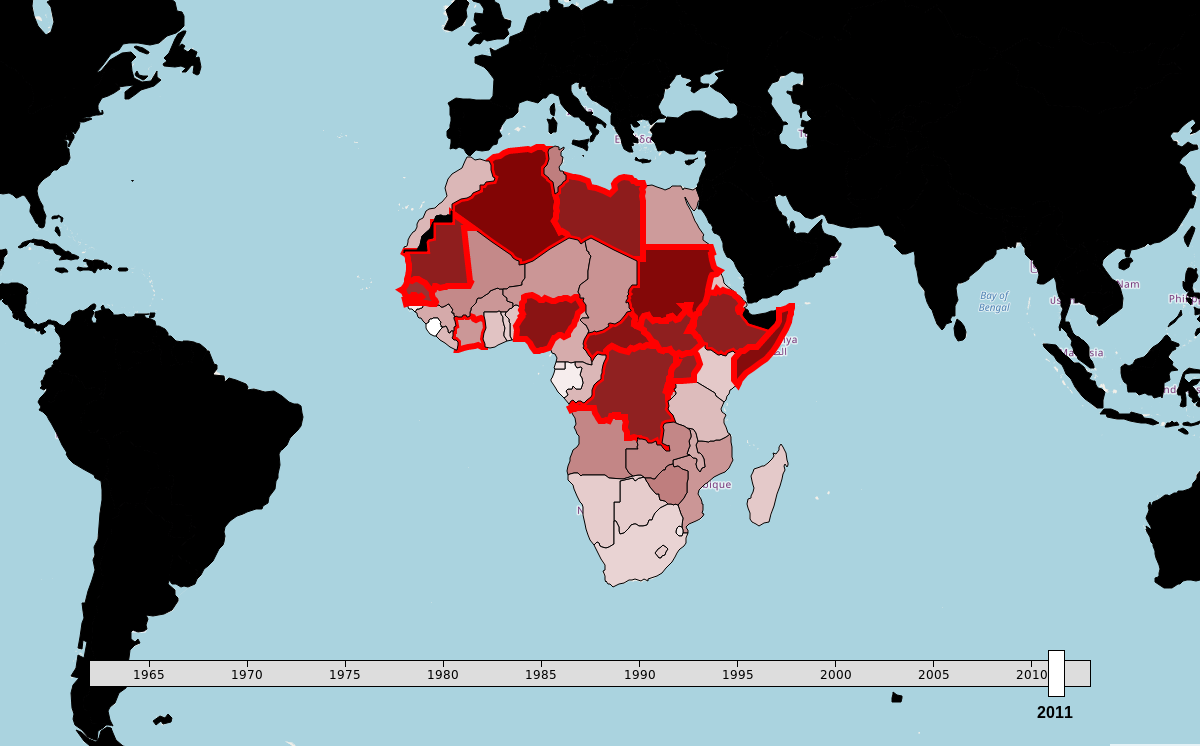
The red gradient represents how likely an armed conflict is to occur for that particular country at that time. When the boundaries of a country become bright red it means that the country actually went through an armed conflict.
The slider at the bottom can be pressed and moved to navigate through time.
A logistic regression, a SVM and a random forest were trained using multiple datasets related to military activity (military expenditures as a fraction of GDP, fraction of population in the army, trades, etc).
Inspiration
I read the news, I travel, I see that peace is ephemeral. Knowing what leads to chaos makes us more cautious and helps us make better decisions. I had bookmarked one of these datasets a while back and told myself I would do something with it when I have the opportunity.
What it does
Making a model tells us a lot about the societal mechanics that lead to conflict. Hopefully, we can use models like this one to preemptively spot rising instabilities and take necessary action through diplomacy and investments to prevent deaths and tyranny.
How I built it
Lots of research, lots of scraping, preprocessing using pandas, comparing different models and then having fun making the interactive map with d3.js
Challenges I ran into
I took as much time aggregating the small and medium arms imports dataset than all the others combined. I had to look at 7 different sources and it took me some time to understand all the jargon surrounding this industry.
Accomplishments that I'm proud of
The data wrangling was not easy on this project. It's very hard to find curated datasets about this topic and this region of the world. Very proud to have made it to the end and produced something.
What I learned
I haven't done a lot of time-series problems. Was very happy to try it out during this hackathon.
What's next for Civil Wars: Visualization & Forecasting
More features! Ethnic diversity, governance structure, how long the government as been in power, neighboring turmoil, colonial history, etc.
Log in or sign up for Devpost to join the conversation.