Inspiration
It's a warm September day in South LA, and even while building indoors at The Beehive we could feel the heat outside. It made us curious what residents here do during a real heat wave, and we learned that the City of Los Angeles opens cooling centers: recreation centers, libraries and senior centers where anyone can go to get out of the heat.
That led to the question behind CivicSim. A cooling center only helps the people who can actually get there, on foot, in the heat, within a reasonable time. So "where should the next one go?" isn't just about finding an empty building. It's about who can reach it and who gets left behind: an older neighbor, someone with a disability, someone without a car.
Today, decisions like that show up in PDFs and public hearings, and residents are asked to react after the options are already chosen. We wanted a tool where anyone can try a decision on a model of their own neighborhood before money is spent. We also wanted residents to be able to point their phone at a street and say what needs to change.
The idea
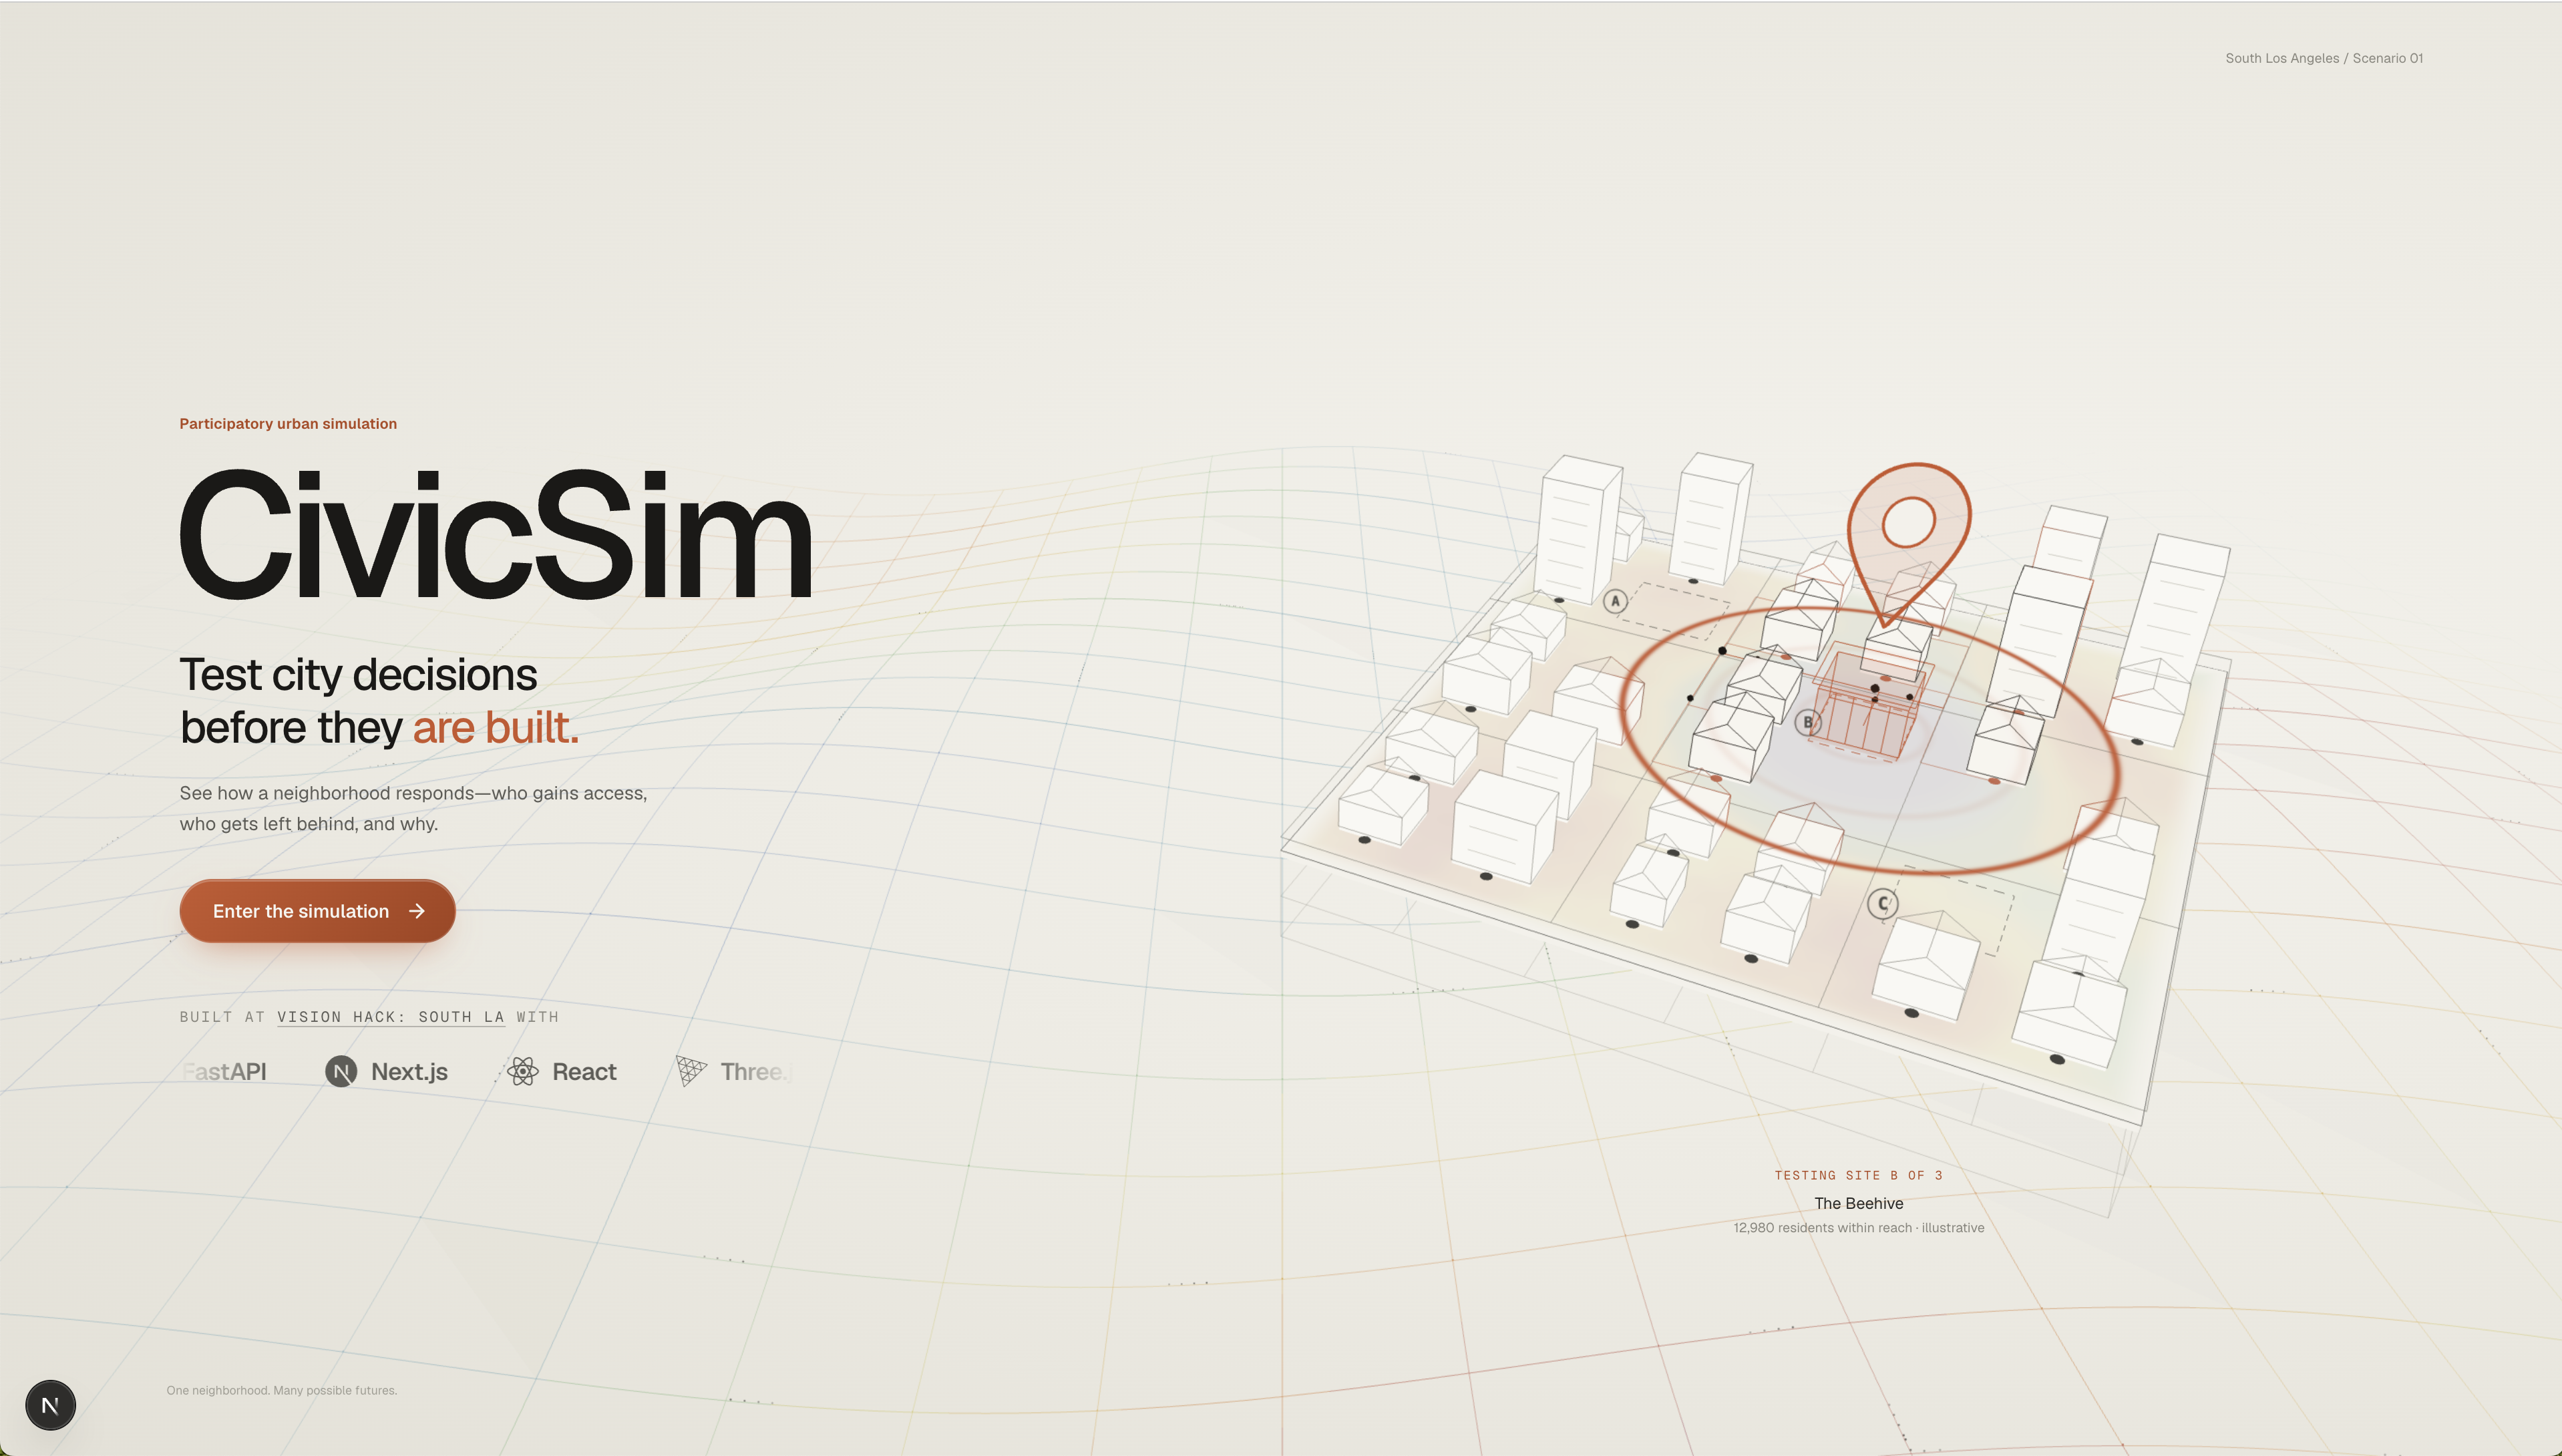
CivicSim is a participatory urban digital twin: a shared, testable model of a real neighborhood where residents, community groups and planners can propose a change, run it through simulated resident journeys, and see who gains and who is burdened before anything is built.
The full vision is a loop:
observe the neighborhood → update a shared model → propose an intervention → simulate resident journeys → compare outcomes by group → revise and submit
It is designed to grow across heat and shade, pedestrian safety, transit access, bike infrastructure and public space. It pairs an AI planning assistant, which may propose changes but must run them through the simulator, with resident photo sensing that brings local knowledge into the model. Every metric carries its assumptions. The goal isn't prediction. It's structured public imagination: giving a community a way to test its own future.
What we built today
In one day we built the first working slice of that loop, end to end, for the blocks around The Beehive in South Park (Council District 9).
CivicSim Studio: the flagship scenario
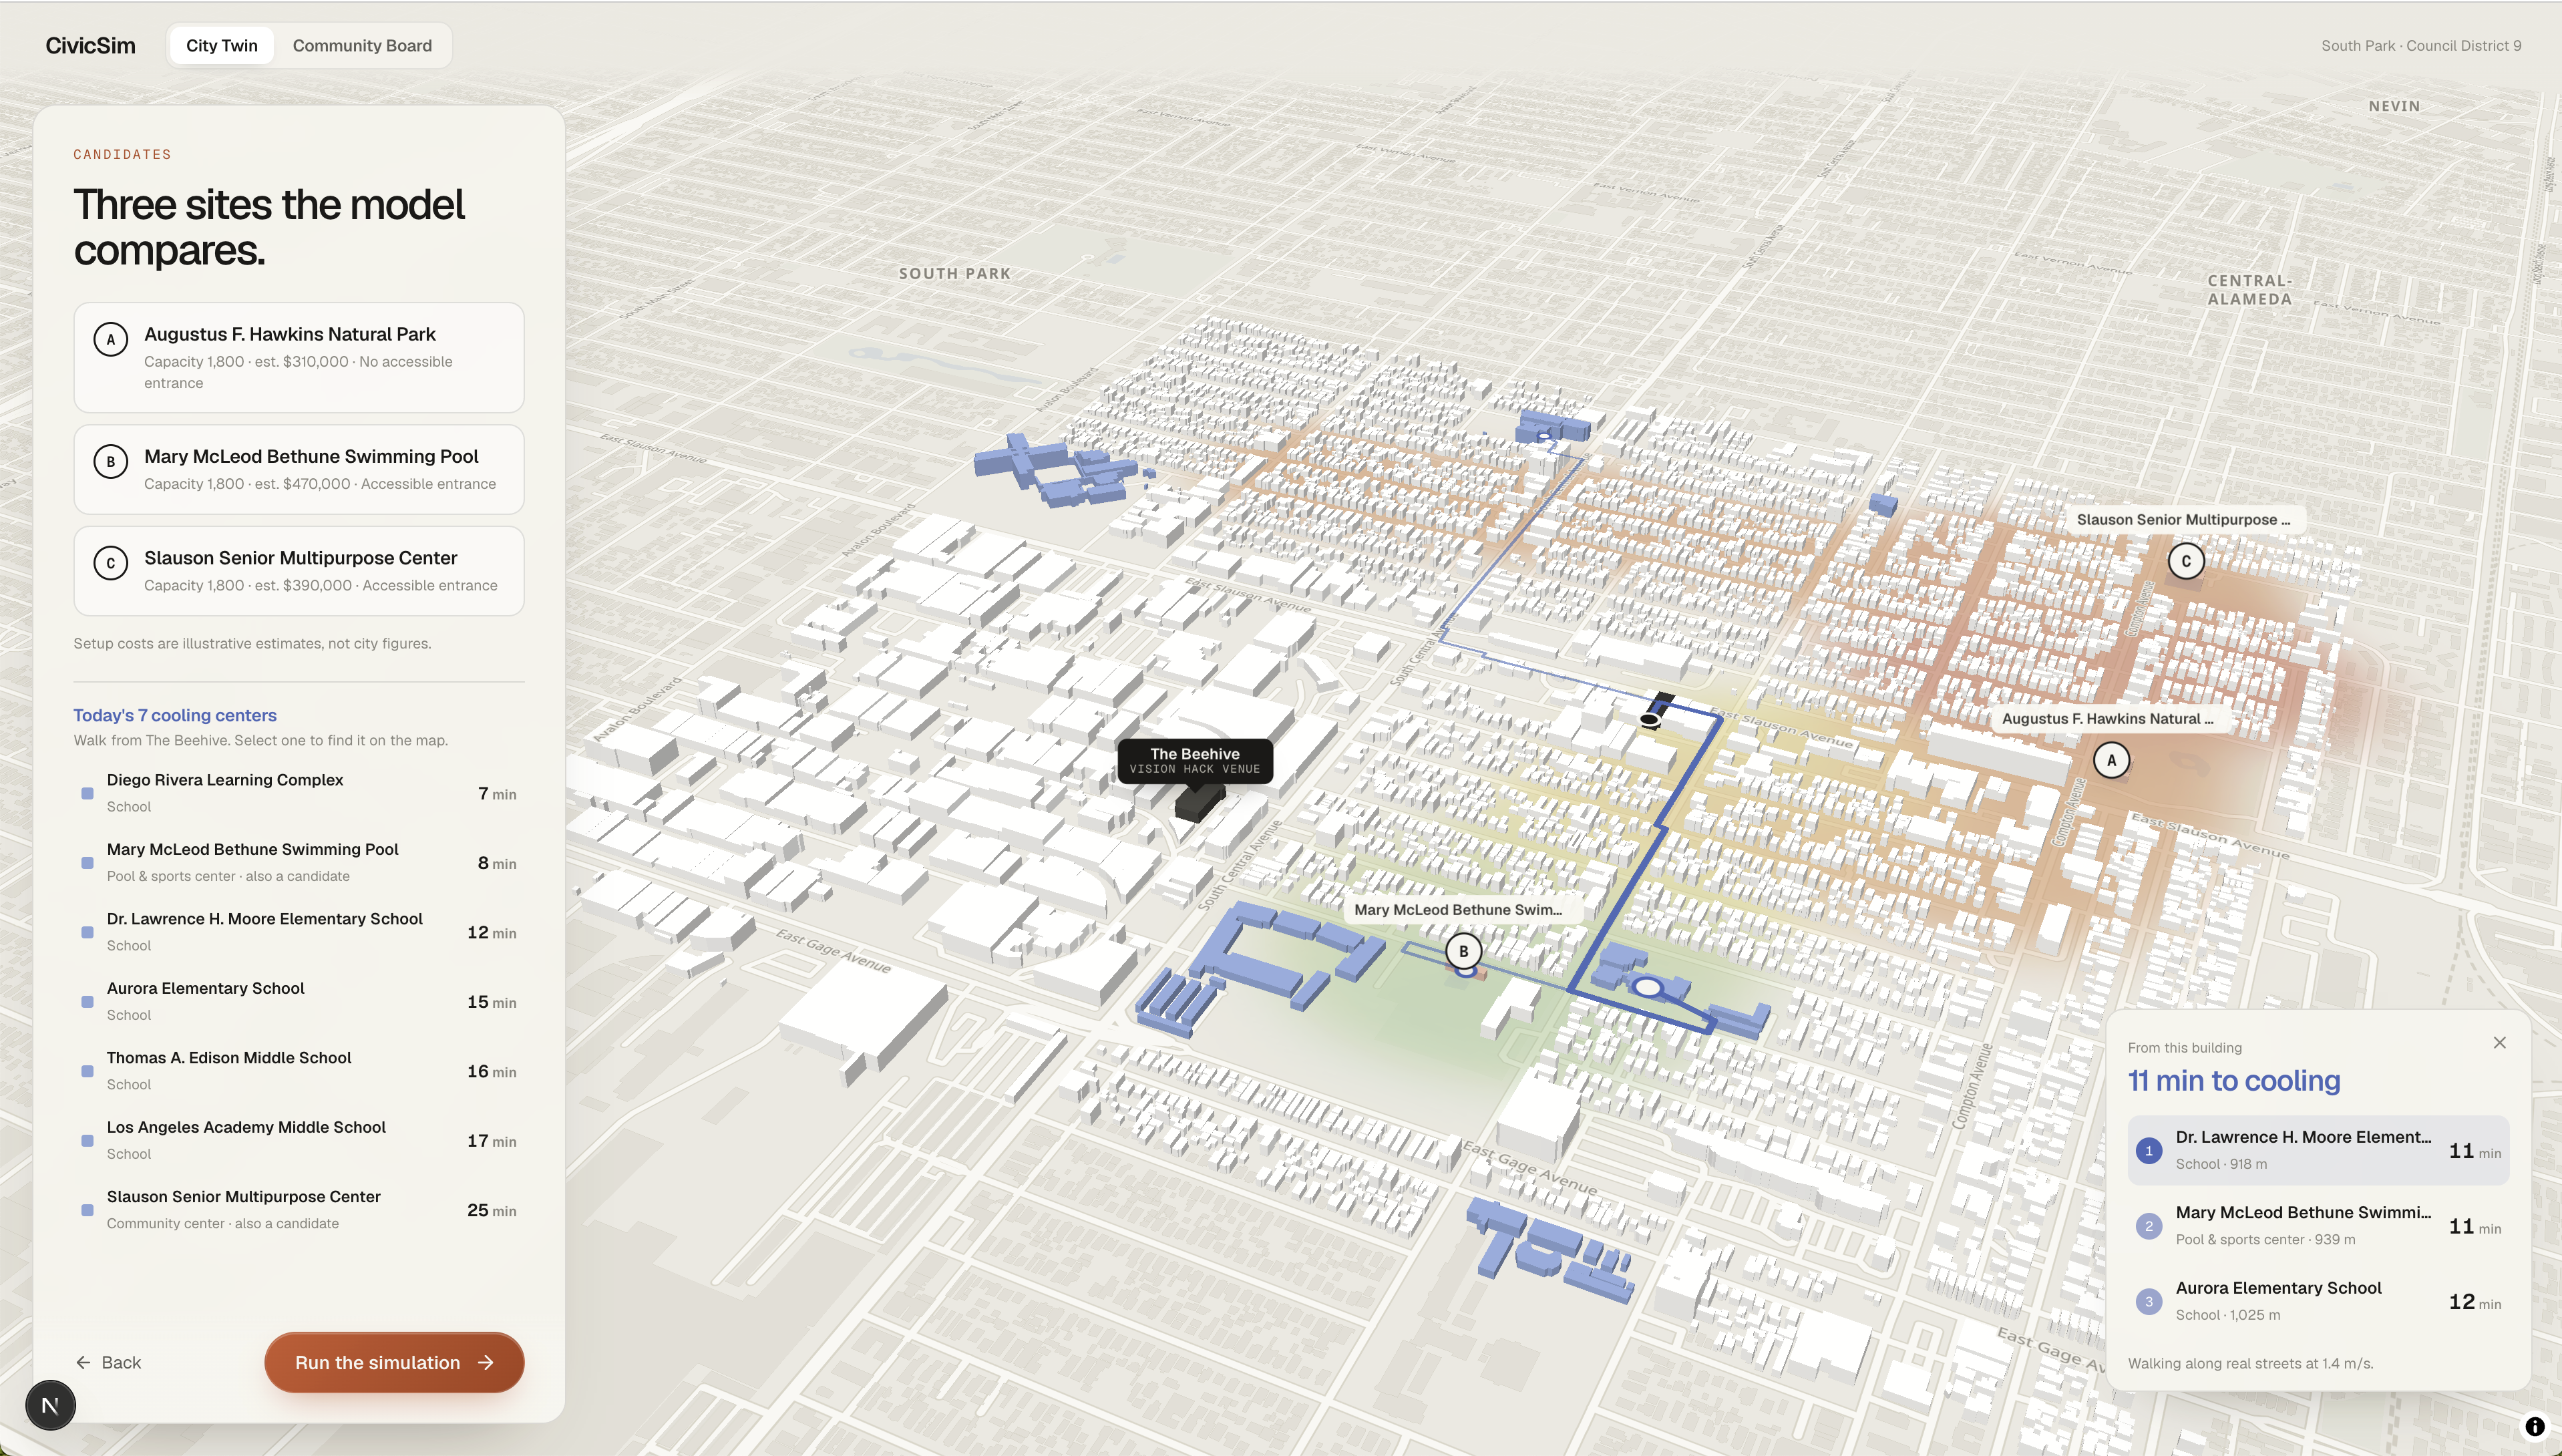
- Brief: a street heat map shows how much of each walk is spent in unshaded heat, plus the 7 places that serve as cooling centers today. Click any building to see the walk to the nearest ones along real streets.
- Compare: three real facilities compete for one new cooling center: Slauson Senior Multipurpose Center, Mary McLeod Bethune Swimming Pool, and Augustus F. Hawkins Natural Park.
- Simulate: synthetic residents walk to every site under a 15-minute limit, with heat exposure and accessibility barriers such as stairs and entrances without ramps.
- The equity reveal: Slauson reaches the most residents (3,240 modeled). Switch the lens to wheelchair users and only 11% of them can reach it, and it runs over capacity. The pool reaches 89%. The recommendation flips depending on whose experience you look at.
- Propose: add shade to the streets leading to the pool and re-run. Modeled heat exposure on the walk drops from 2.5 to 1.0 minutes.
CivicSim Scan: residents feed the model
- On a phone, a resident takes a photo, confirms the location (from photo GPS, the phone's location, or a pin on the map), and picks an issue or a request.
- Gemini classifies visible problems into a fixed list: damaged sidewalk, missing curb ramp, lack of shade, broken streetlight, exposed wiring, and more.
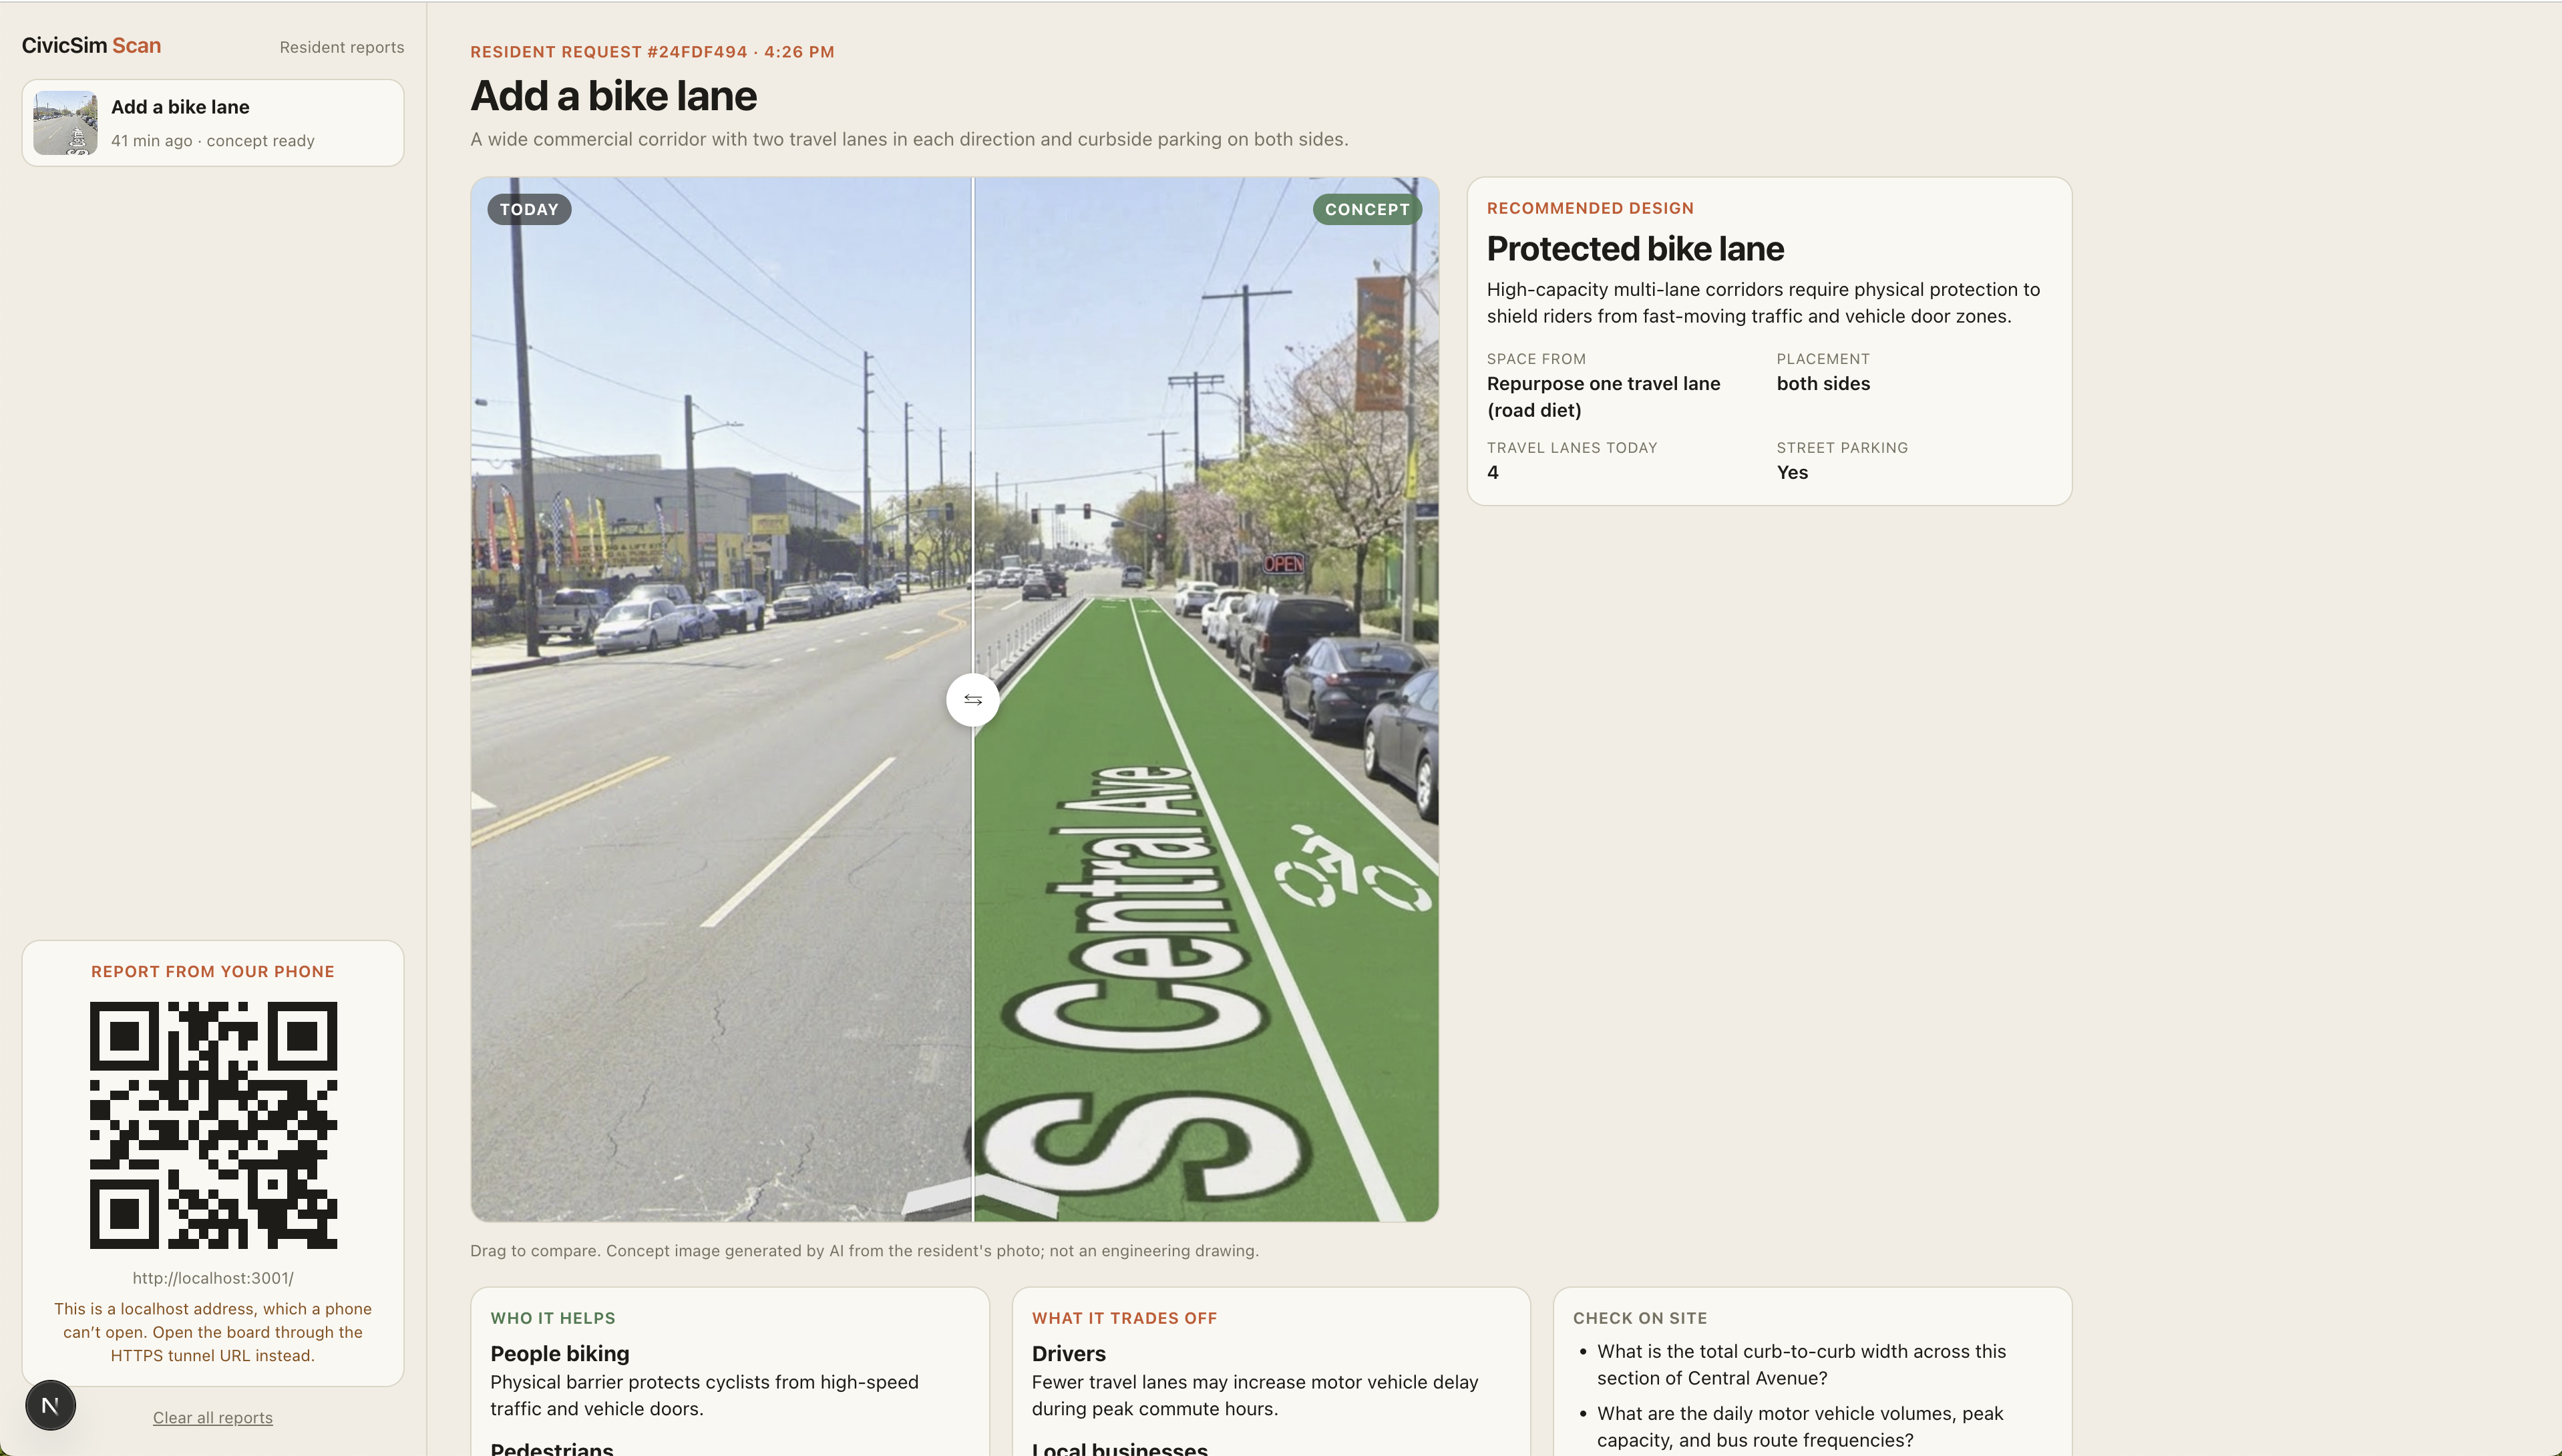
- A planning board on a laptop updates live. Each report shows the recommended fix and the city office that usually handles it.
- When the issue is something the model represents, such as a missing curb ramp or no shade, the fix is applied to the nearest modeled street and every scenario is re-run to show before/after impact.
- For a bike lane request, Gemini reads the street from the photo (lanes, parking, where the space would come from, who gains, what it trades off). It also renders a concept of that street with the bike lane, shown as a draggable before/after comparison.
Real, not staged
We held ourselves to one rule: no hard-coded results.
- Every number is computed live. The Studio and the Scan board show outputs from the simulation engine at request time: graph routing, accessibility-constrained paths for wheelchair users, and metric aggregation by population group. Change the input and the numbers change.
- Proposals are real re-runs. Adding shade, or a curb-ramp repair reported through Scan, edits a copy of the walking graph and re-runs every scenario through the same engine.
- Real map data. 4,883 OpenStreetMap buildings, real facilities as candidate sites, walks drawn along real OSM streets, and nearest-cooling lookups computed as shortest paths over the real street network.
- Live AI, used carefully. Gemini classifies each photo and reads each street when it's submitted, constrained to fixed categories and structured output. Concept images are generated from the resident's own photo.
- What's designed, and said so on screen. The walking graph and its synthetic cohort (representing 4,380 residents) are purpose-built for this demo and small enough to verify by hand. Setup costs are illustrative, concept renderings are labeled AI-generated, and the homepage animation is marked illustrative. When the model can't represent something, we show "not simulated yet" instead of inventing a number.
How we built it
- Frontend: Next.js, React, and TypeScript. The hero is built with React Three Fiber. The map uses MapLibre GL with an interleaved deck.gl overlay, so routes are correctly hidden behind 2.5D buildings.
- Map data: building footprints and heights pulled from OpenStreetMap with Overpass (96% have LiDAR-derived heights), streets from OSM, a paper-style basemap from OpenFreeMap vector tiles, and an offline tile package so the demo survives venue Wi-Fi.
- Simulation: FastAPI with NetworkX. It does deterministic shortest-path routing with an accessibility-filtered view of the graph, aggregates metrics by population group, applies interventions to a per-request copy of the graph, and draws walks along real streets.
- Scan: a FastAPI service and a Next.js phone app. It reads GPS from photo EXIF, uses Gemini structured output for classification and street reading, and uses Gemini image editing for concept renderings. The planning board updates live, and resident-reported fixes run through the same simulation engine.
- Process: a written API contract between frontend and backend so the team could build in parallel, and automated tests on both backends.
Challenges we ran into
- Staying honest. It's easy to make a simulation look authoritative. We labeled every illustrative value and refused to fake numbers for things the model can't represent.
- Real data vs. a model we could explain. Buildings, facilities and streets are real, while the routing graph is small enough to check by hand. Keeping those layers consistent took care.
- Depth on a flat, low-rise neighborhood. Getting routes to sit correctly behind extruded buildings in a WebGL map took work.
- Phones strip GPS from uploaded photos, so location needed fallbacks: the phone's current location or a manual pin.
Accomplishments that we're proud of
- The "recommendation flips" moment. Choosing by total reach alone would have picked a site most wheelchair users can't get to.
- Closing the loop from our concept: physical street → resident photo → shared model → simulation → proposal, in seconds.
- A demo that runs offline on a laptop, with nothing pre-scripted.
What we learned
- Averages hide who gets left out. Equity has to be a view in the tool, not a footnote.
- A contract-first API let us build the frontend, map and backend in parallel on a single hackathon day.
- Constrained AI (fixed categories, structured output, clearly labeled renderings) is far easier to trust than free-form answers.
What's next
- From demo graph to calibrated model: a full OSM walking and transit network, a synthetic population built from Census data, repeated seeded runs with uncertainty ranges, and a model card for every result.
- More modules: pedestrian safety, transit access, bike lanes as a simulated mode, and parks.
- A planning assistant that proposes candidates under a budget and must call the simulator before recommending anything.
- Resident sensing done right: face and license-plate redaction, confirmation and verification states, and verified observations updating the shared model.
- Participation at scale: fork and submit proposals, English and Spanish flows, community workshops, and expansion across Council Districts 8, 9 and 10.
Before we build the future of a neighborhood, the people who live there should be able to test it.
Built With
- deck.gl
- fastapi
- google-gemini
- maplibre-gl
- networkx
- next.js
- openfreemap
- openstreetmap
- overpass-api
- pillow
- pydantic
- python
- react
- react-three-fiber
- three.js
- typescript
- uv


Log in or sign up for Devpost to join the conversation.