Inspiration
Toronto’s street problems are easy to photograph and hard to keep track of. Someone posts a broken sidewalk, a blocked bike lane, or a flooded road. People discuss it, the feed moves on, and the problem can disappear from view without being fixed.
We wanted to make those observations useful beyond the original post. With Toronto’s municipal election approaching, the School of Cities challenge gave us a reason to ask how everyday street photos could help residents understand what needs attention in their neighbourhood.
That became GeoIssue.
What it does
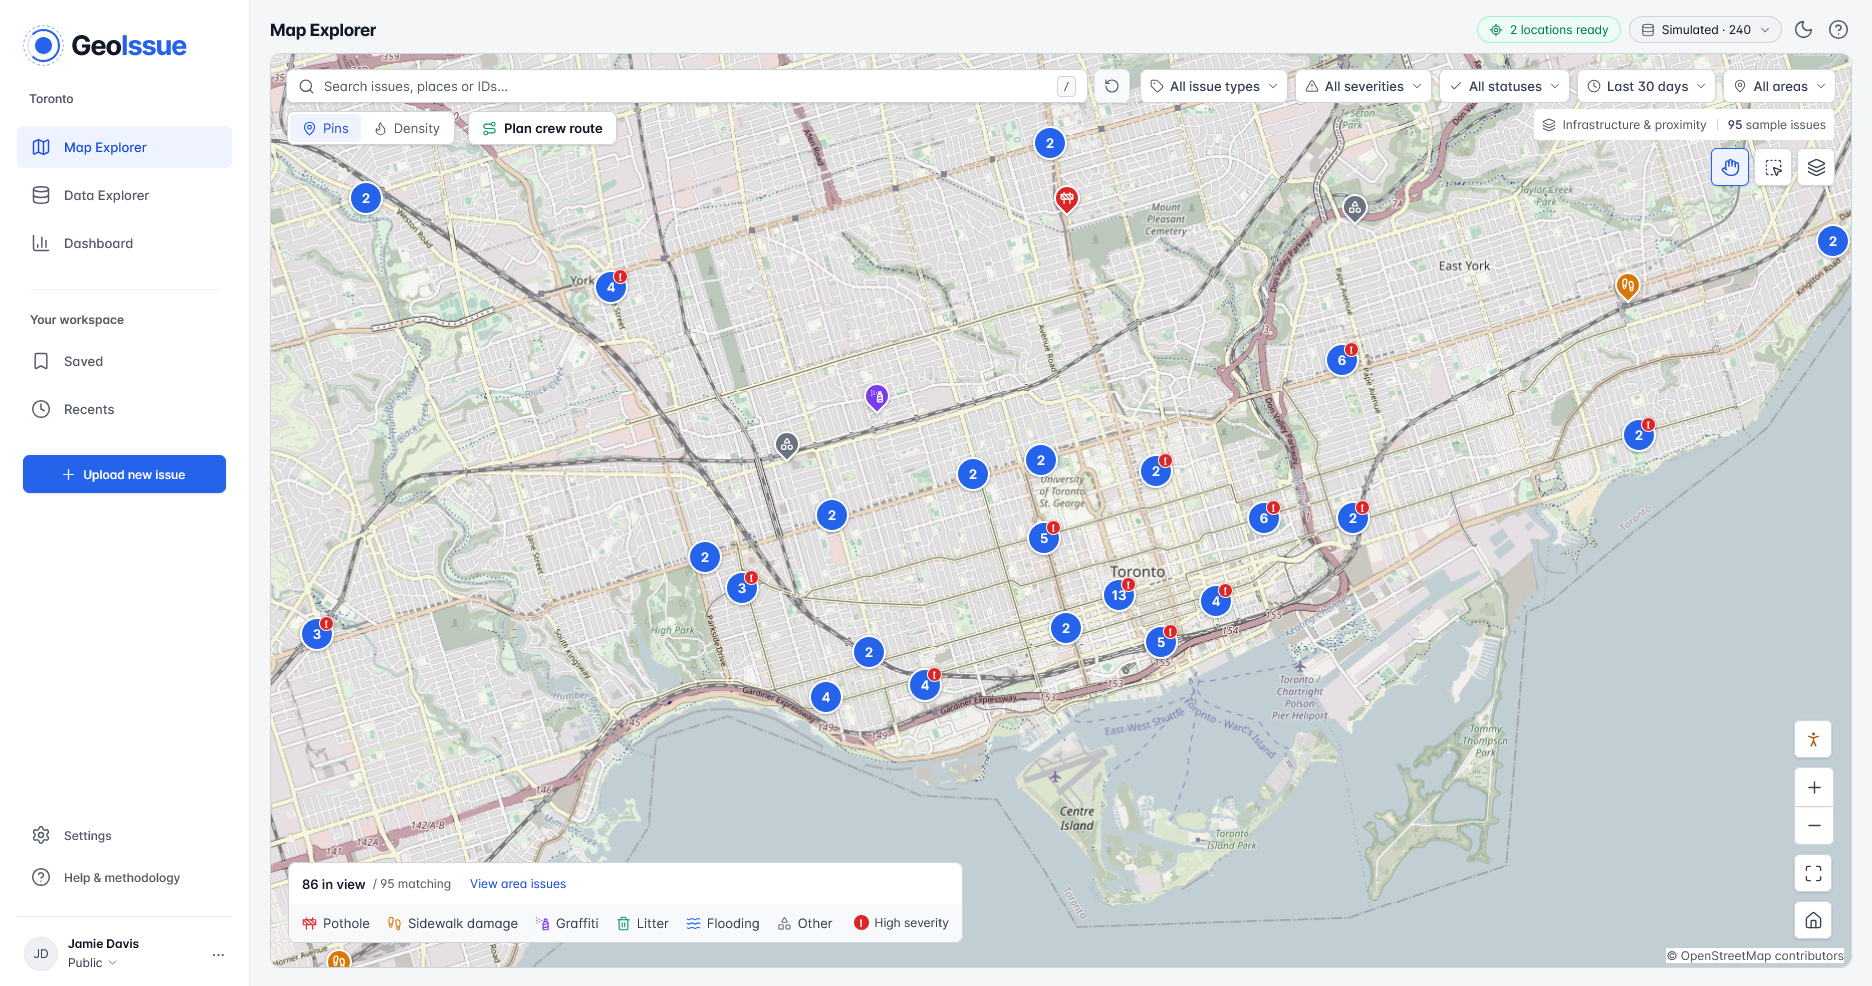
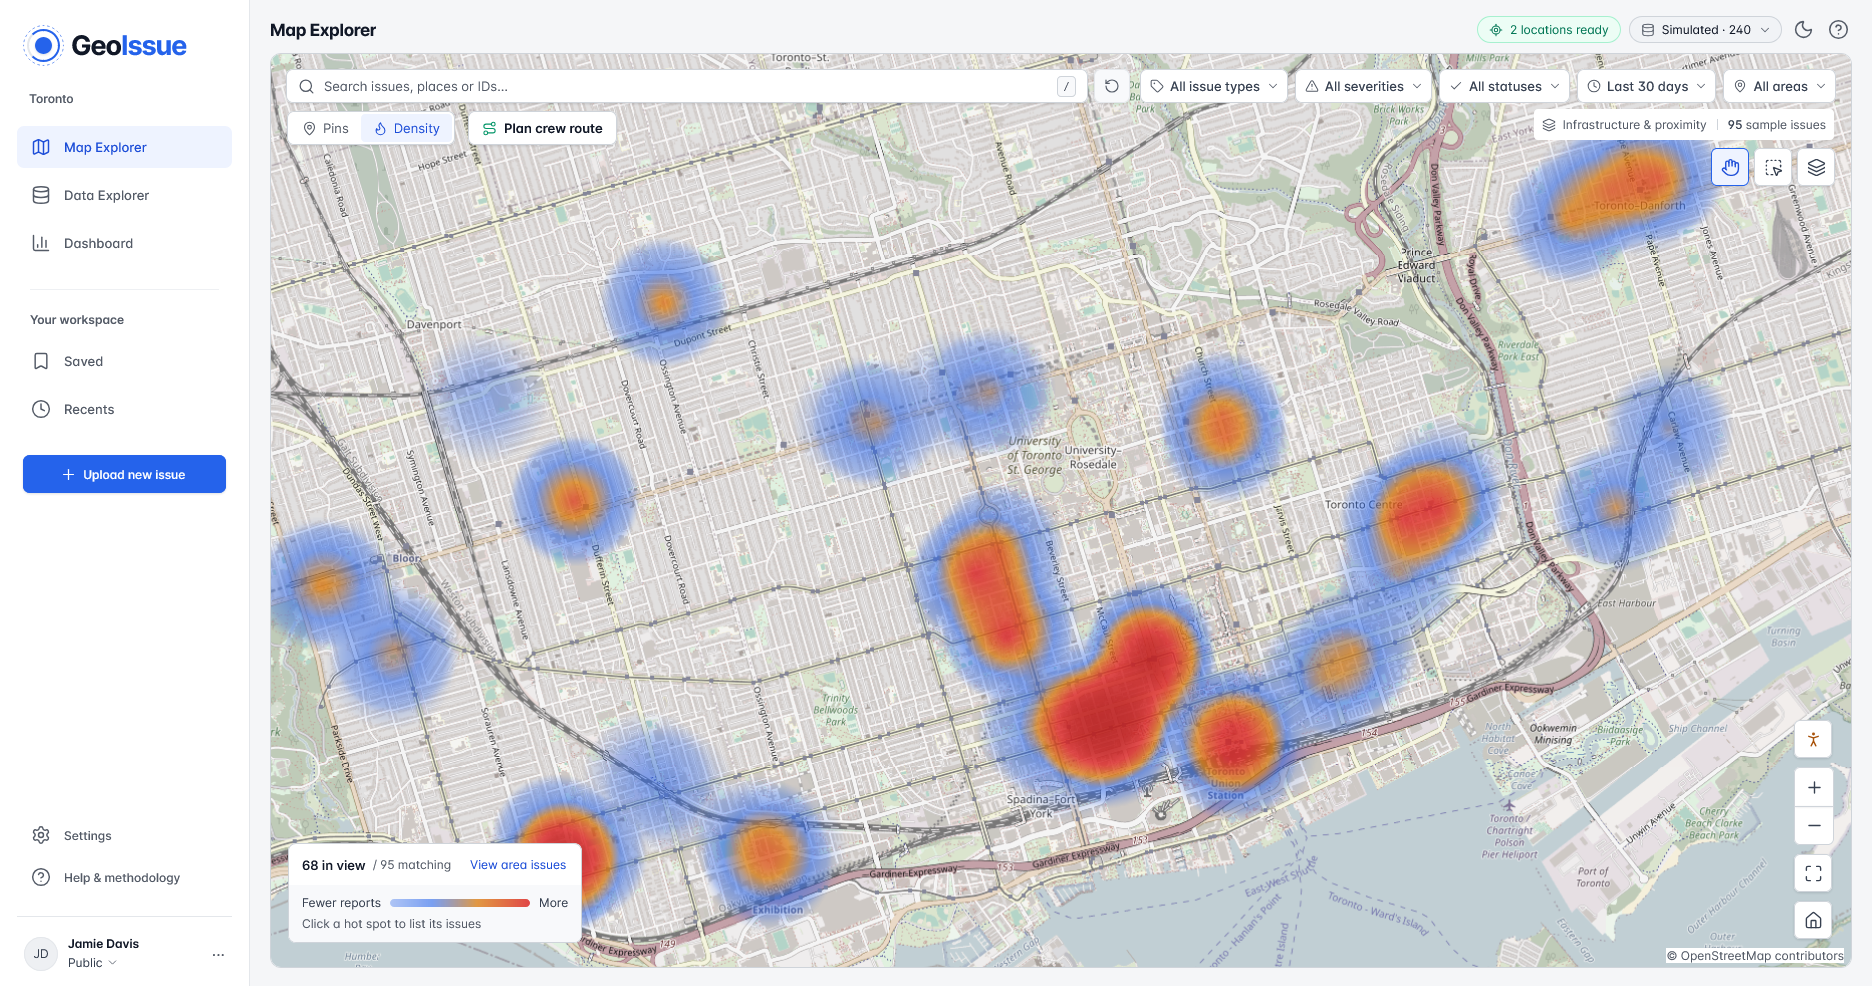
GeoIssue turns street photos and public social posts into a map of Toronto’s infrastructure problems.
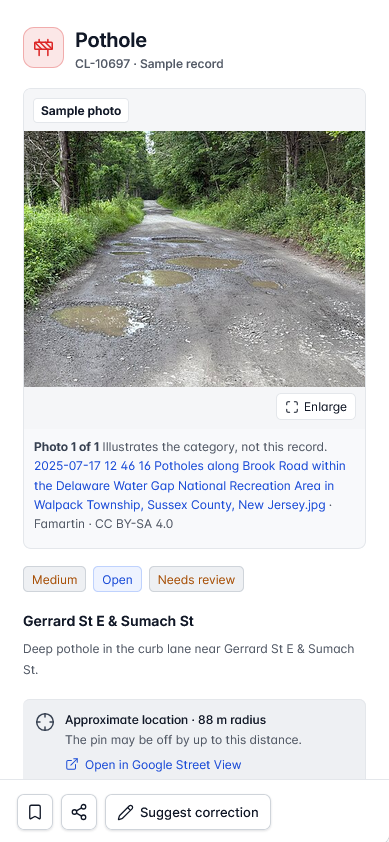
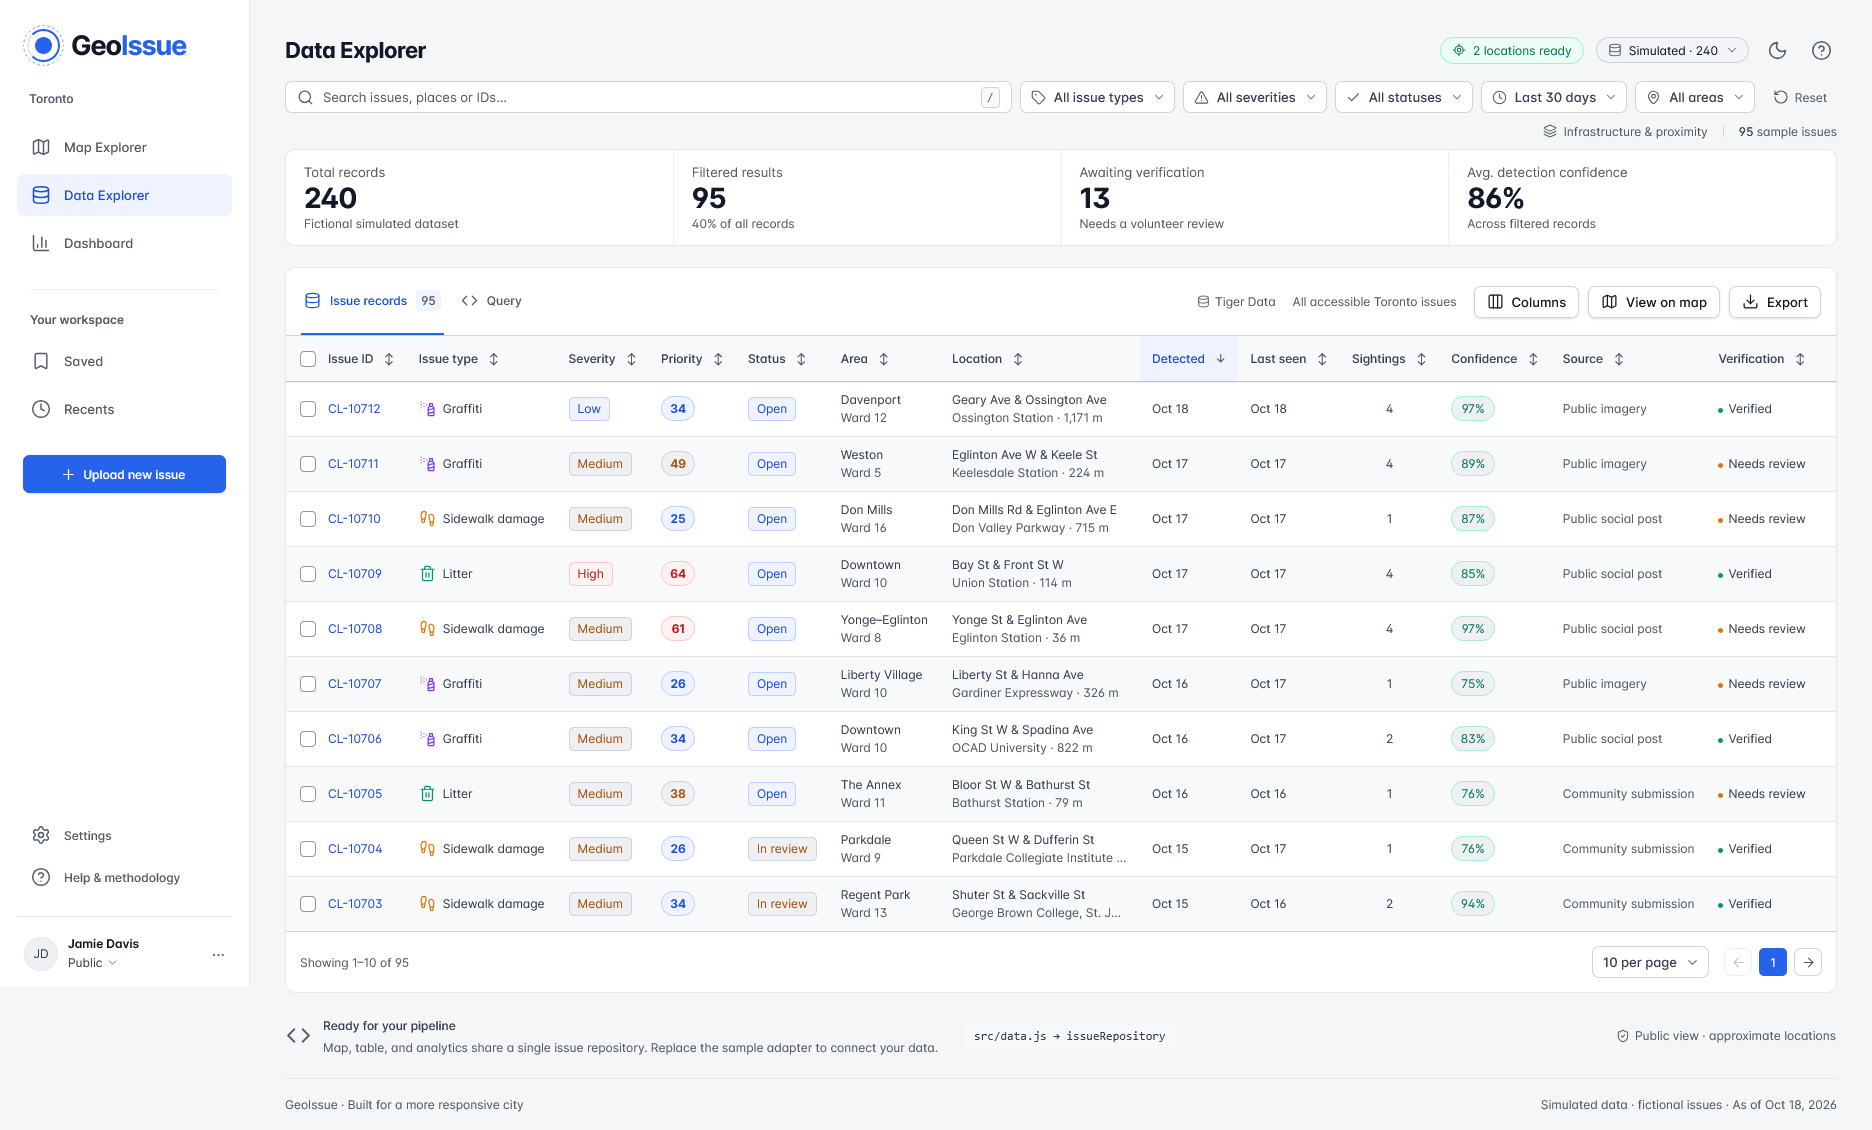
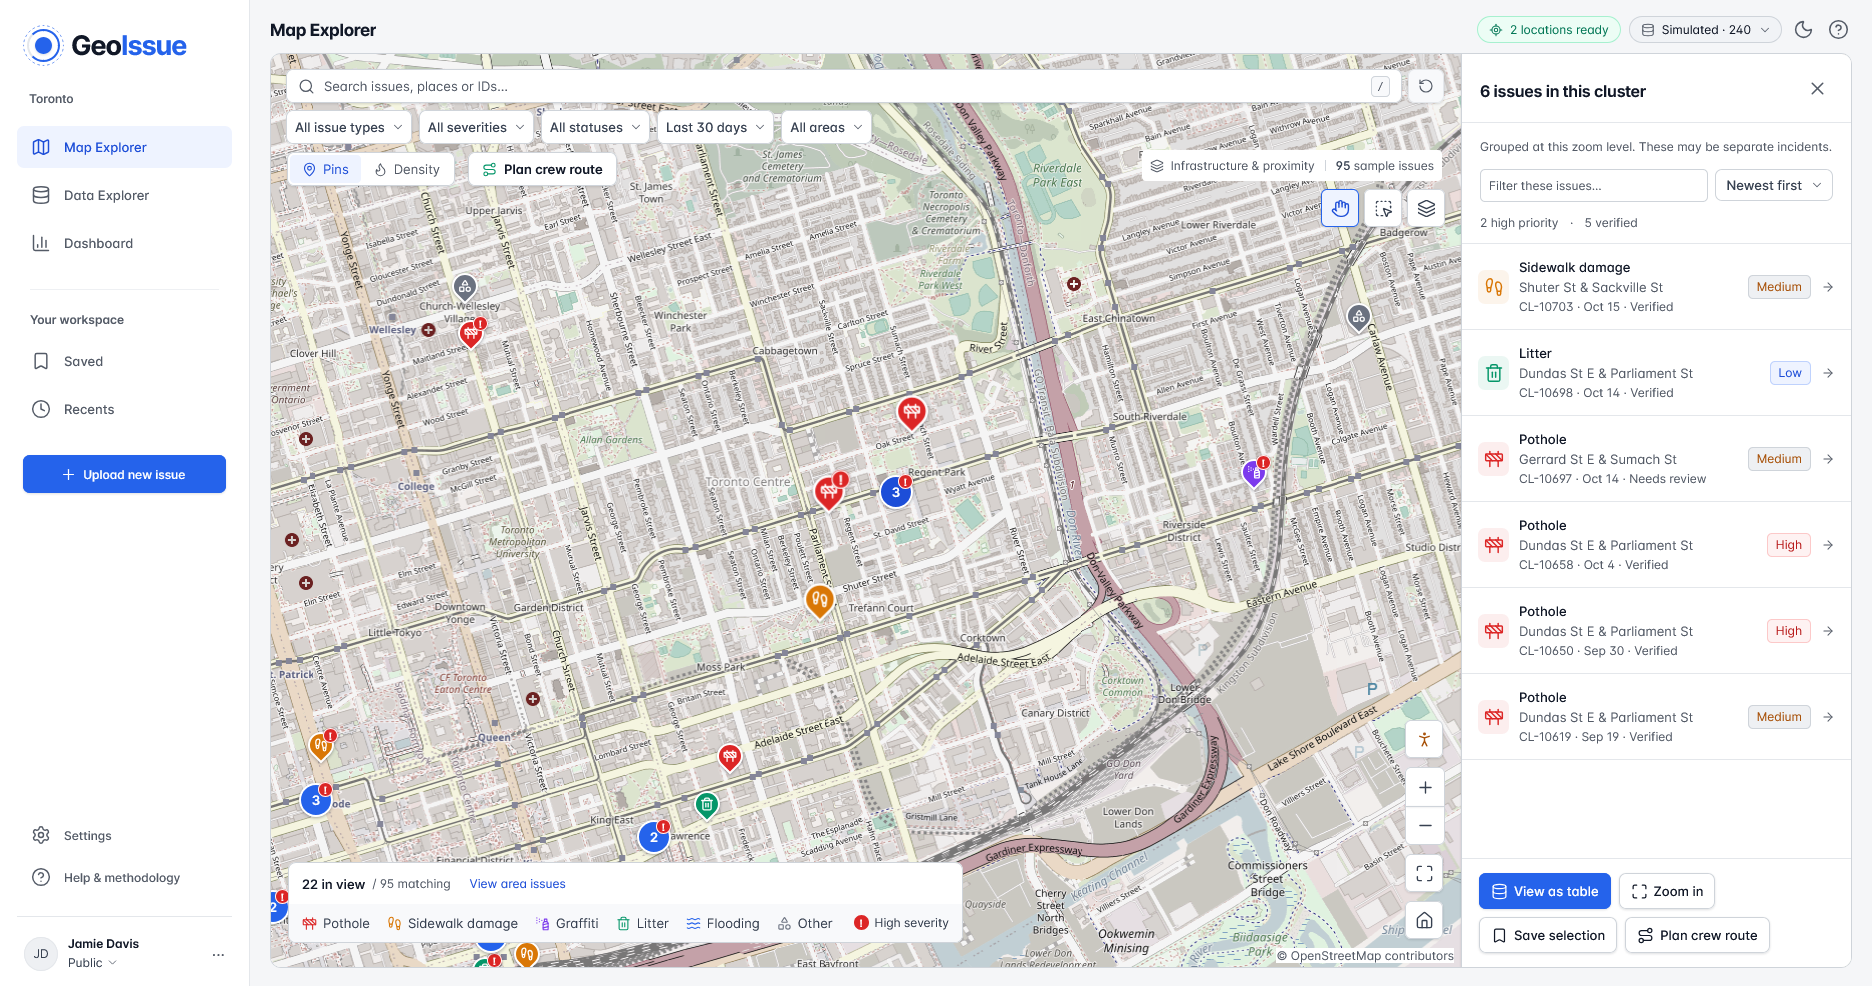
It screens images for visible issues, estimates their locations, groups repeated sightings, and assigns a priority score with an explanation. Users can explore the map, inspect the supporting photos and source posts, and filter by issue type, severity, neighbourhood, or ward.
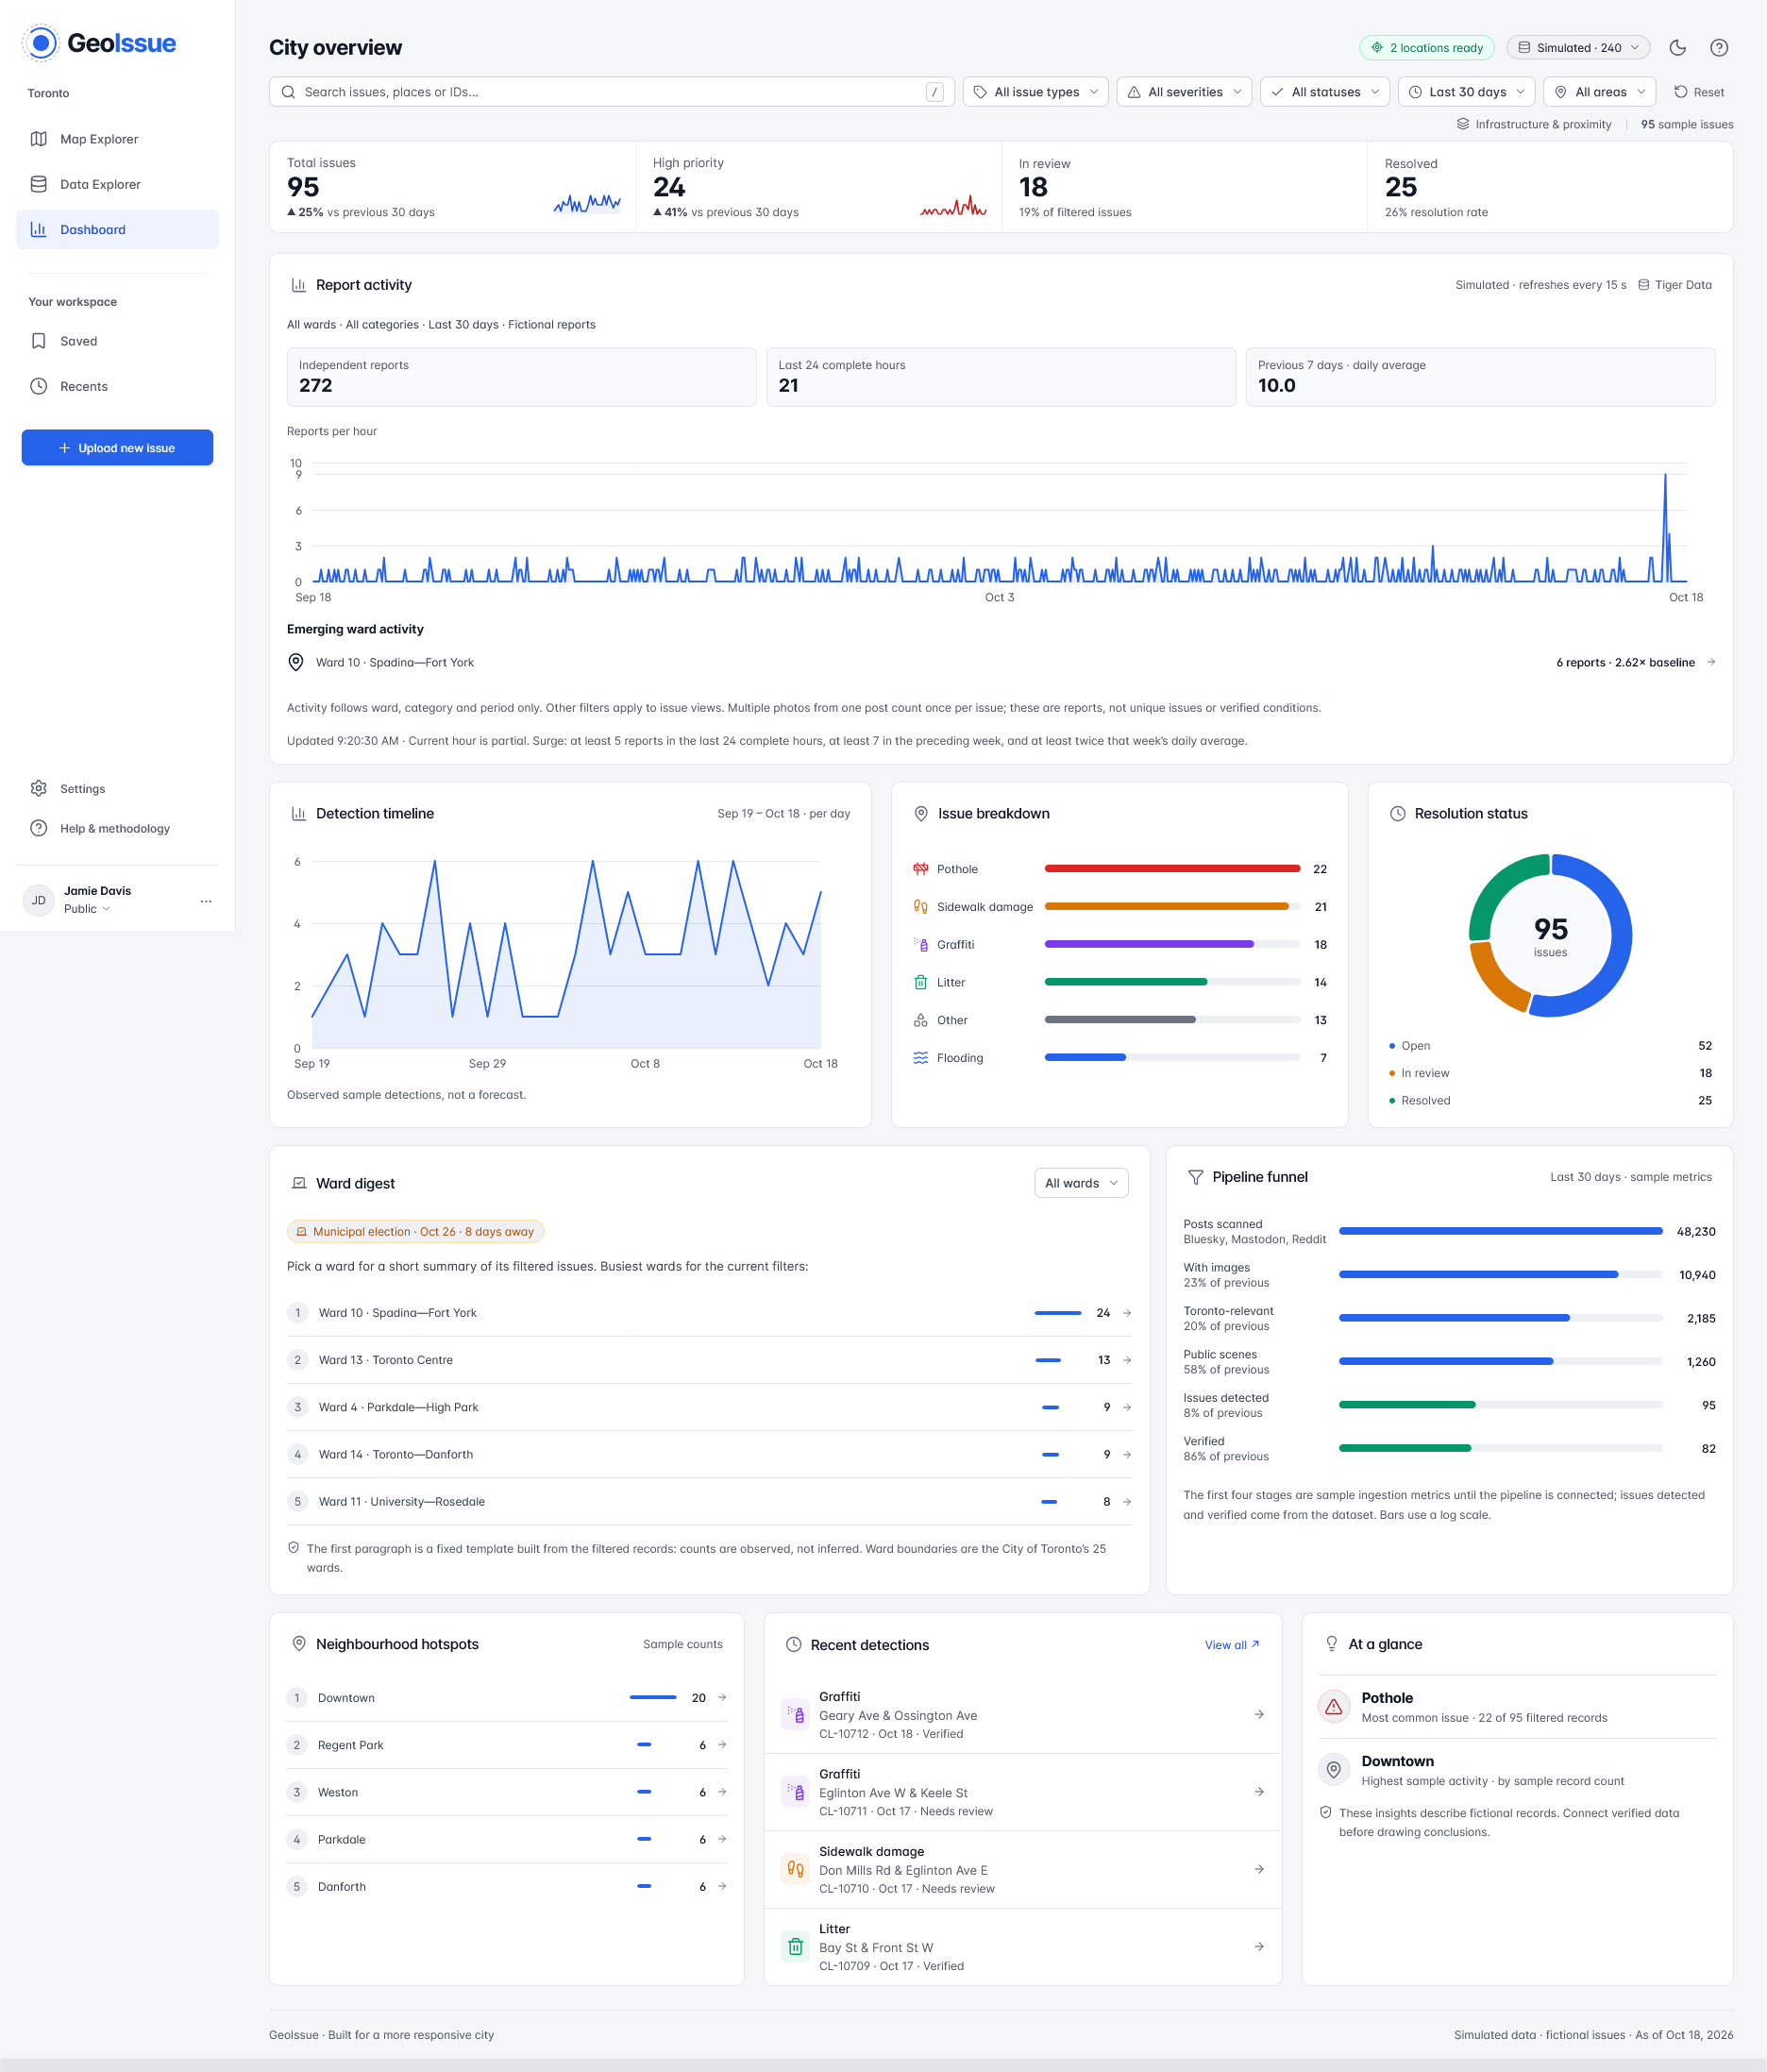
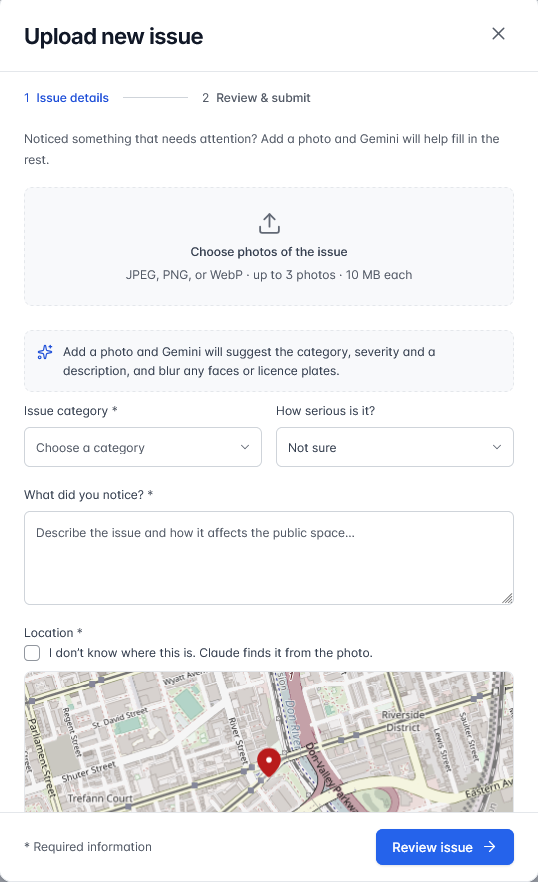
Residents can also upload photos and suggest corrections. A dashboard shows patterns across areas, while a crew route planner helps organize selected issues into a route with estimated travel distance and emissions.
Location estimates include uncertainty, and collected records are labelled separately from demonstration data.
How we built it
We built a Python pipeline to collect photos, standardize records from different sources, and process them into issues the map can display. Gemini helps screen images and generate structured descriptions of visible infrastructure problems.
To estimate locations, we combine available coordinates, place names, captions, and Toronto reference data. We connect issues with ward boundaries and nearby infrastructure, then merge likely duplicates so several photos of one problem do not become several separate incidents.
The frontend uses HTML, CSS, and JavaScript with OpenStreetMap tiles. The map, searchable table, and dashboard share the same issue dataset and filters.
We also built a Tiger Data integration using PostgreSQL and TimescaleDB to store issue snapshots and track sightings over time.
Challenges we ran into
Finding useful photos was harder than finding posts that mentioned a problem. Search results included advertisements, screenshots, old images, and ordinary construction scenes. We had to distinguish what a caption claimed from what the photo actually supported, so we added screening and a more detailed assessment stage.
Our biggest challenge was figuring out exactly where someone should go to find the problem. Identifying a damaged sidewalk is useful, but a pin near an intersection can still leave a maintenance worker searching four corners.
Many photos lacked GPS coordinates, and captions often mentioned only a street or neighbourhood. Even when we identified an intersection, we still needed to determine which side of the road showed the issue and which direction the photographer was facing. A recognizable building could help locate the camera without necessarily locating the damage itself.
That precision matters if we want to pass reports to city maintenance teams or eventually connect with Toronto’s 311 service. We combined available coordinates, captions, place names, and nearby infrastructure to narrow down locations. We also made location estimates explainable and added tools for users to correct pins. Exact street positions and viewing directions still need verification before direct handoffs to city services.
Repeated posts created another challenge. Several photos might show the same pothole from different angles or on different days. We needed to group those sightings into one issue while preserving the evidence and its history, so repeated attention would not inflate the number of separate problems.
Accomplishments that we're proud of
We connected the full journey from a collected photo to an issue someone can inspect on a map.
We’re especially proud that users can see the evidence behind a report, understand its priority, and challenge its location. Those details make the results easier to assess.
We also added tools that help people act on the map, including ward summaries, exports, and crew route planning.
What we learned
A convincing description is only one part of a useful civic report. Location, timing, duplicate detection, and supporting evidence matter just as much.
We learned to distinguish when a photo was posted from when it was taken. We also learned that a neighbourhood with fewer posts may simply have less online activity, so report counts need context.
What's next for GeoIssue
We want to improve location accuracy and add stronger checks for whether reported conditions are still present.
Next, we would move submissions and review decisions into a shared, authenticated system, connect verified reports with Toronto’s 311 workflow, and test the product with residents and maintenance teams.
We would also evaluate coverage across neighbourhoods so the map reflects more than the places getting the most attention online.
Built With
- apify
- css3
- gemini
- html5
- javascript
- openstreetmap
- postgresql
- python
- tigerdata
- timescaledb


Log in or sign up for Devpost to join the conversation.