-
-

CivicLens: free, evidence-based site selection for Southampton, built on open city data.
-
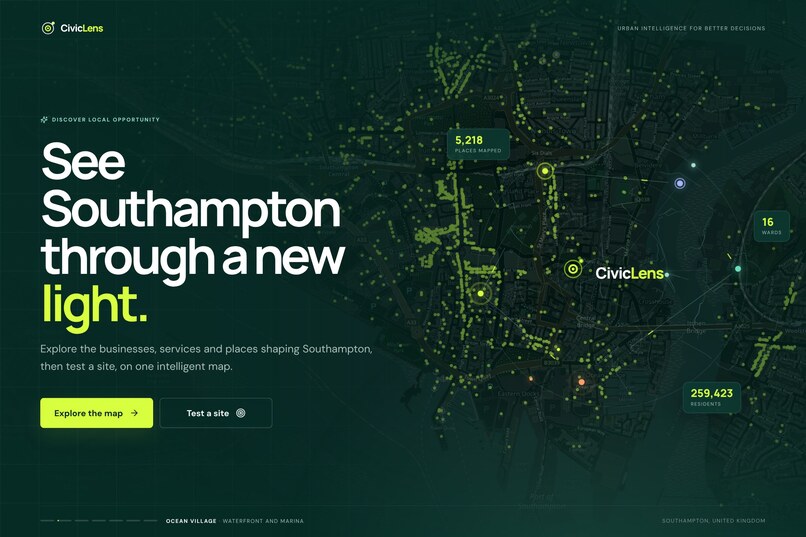
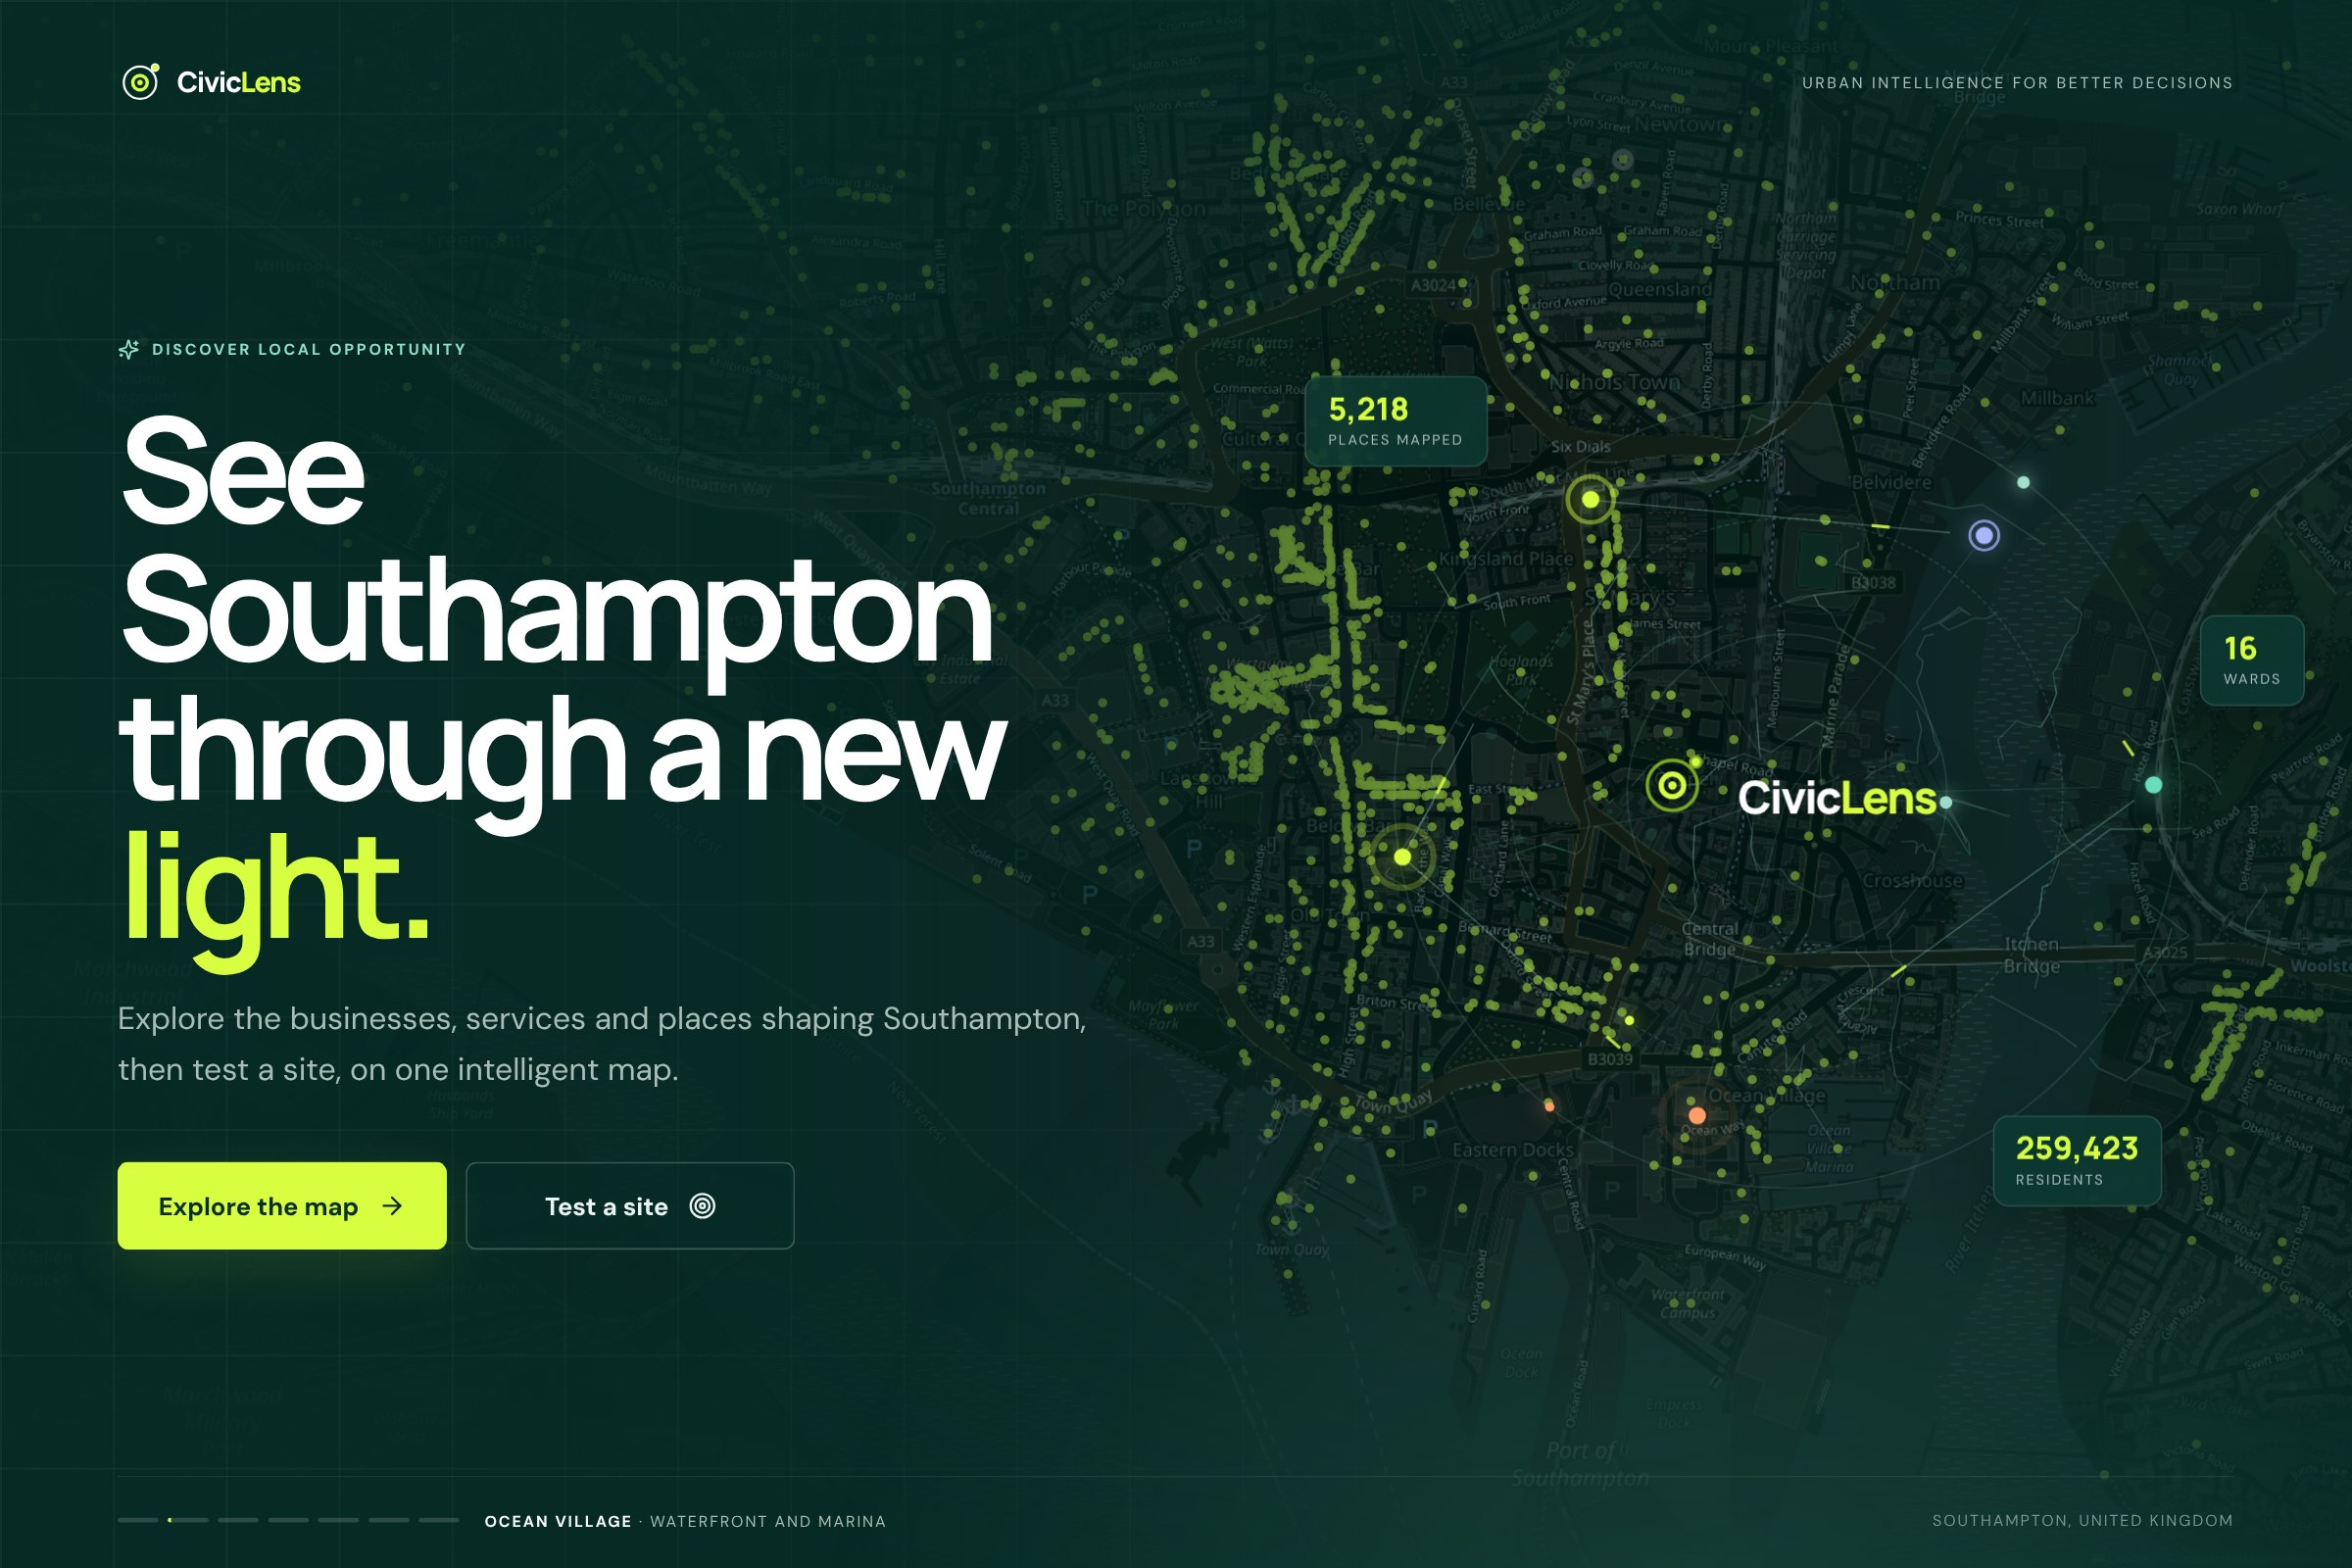
Landing page: explore the businesses and services shaping Southampton, then test a site, all on one interactive map.
-
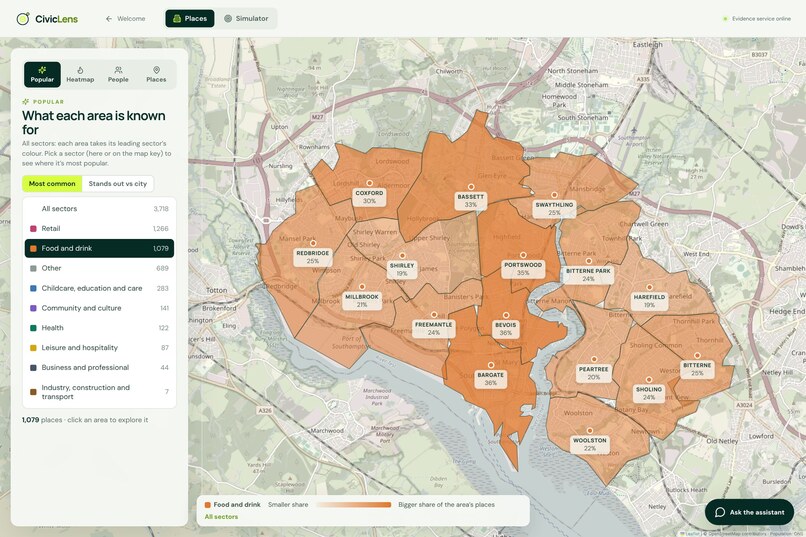
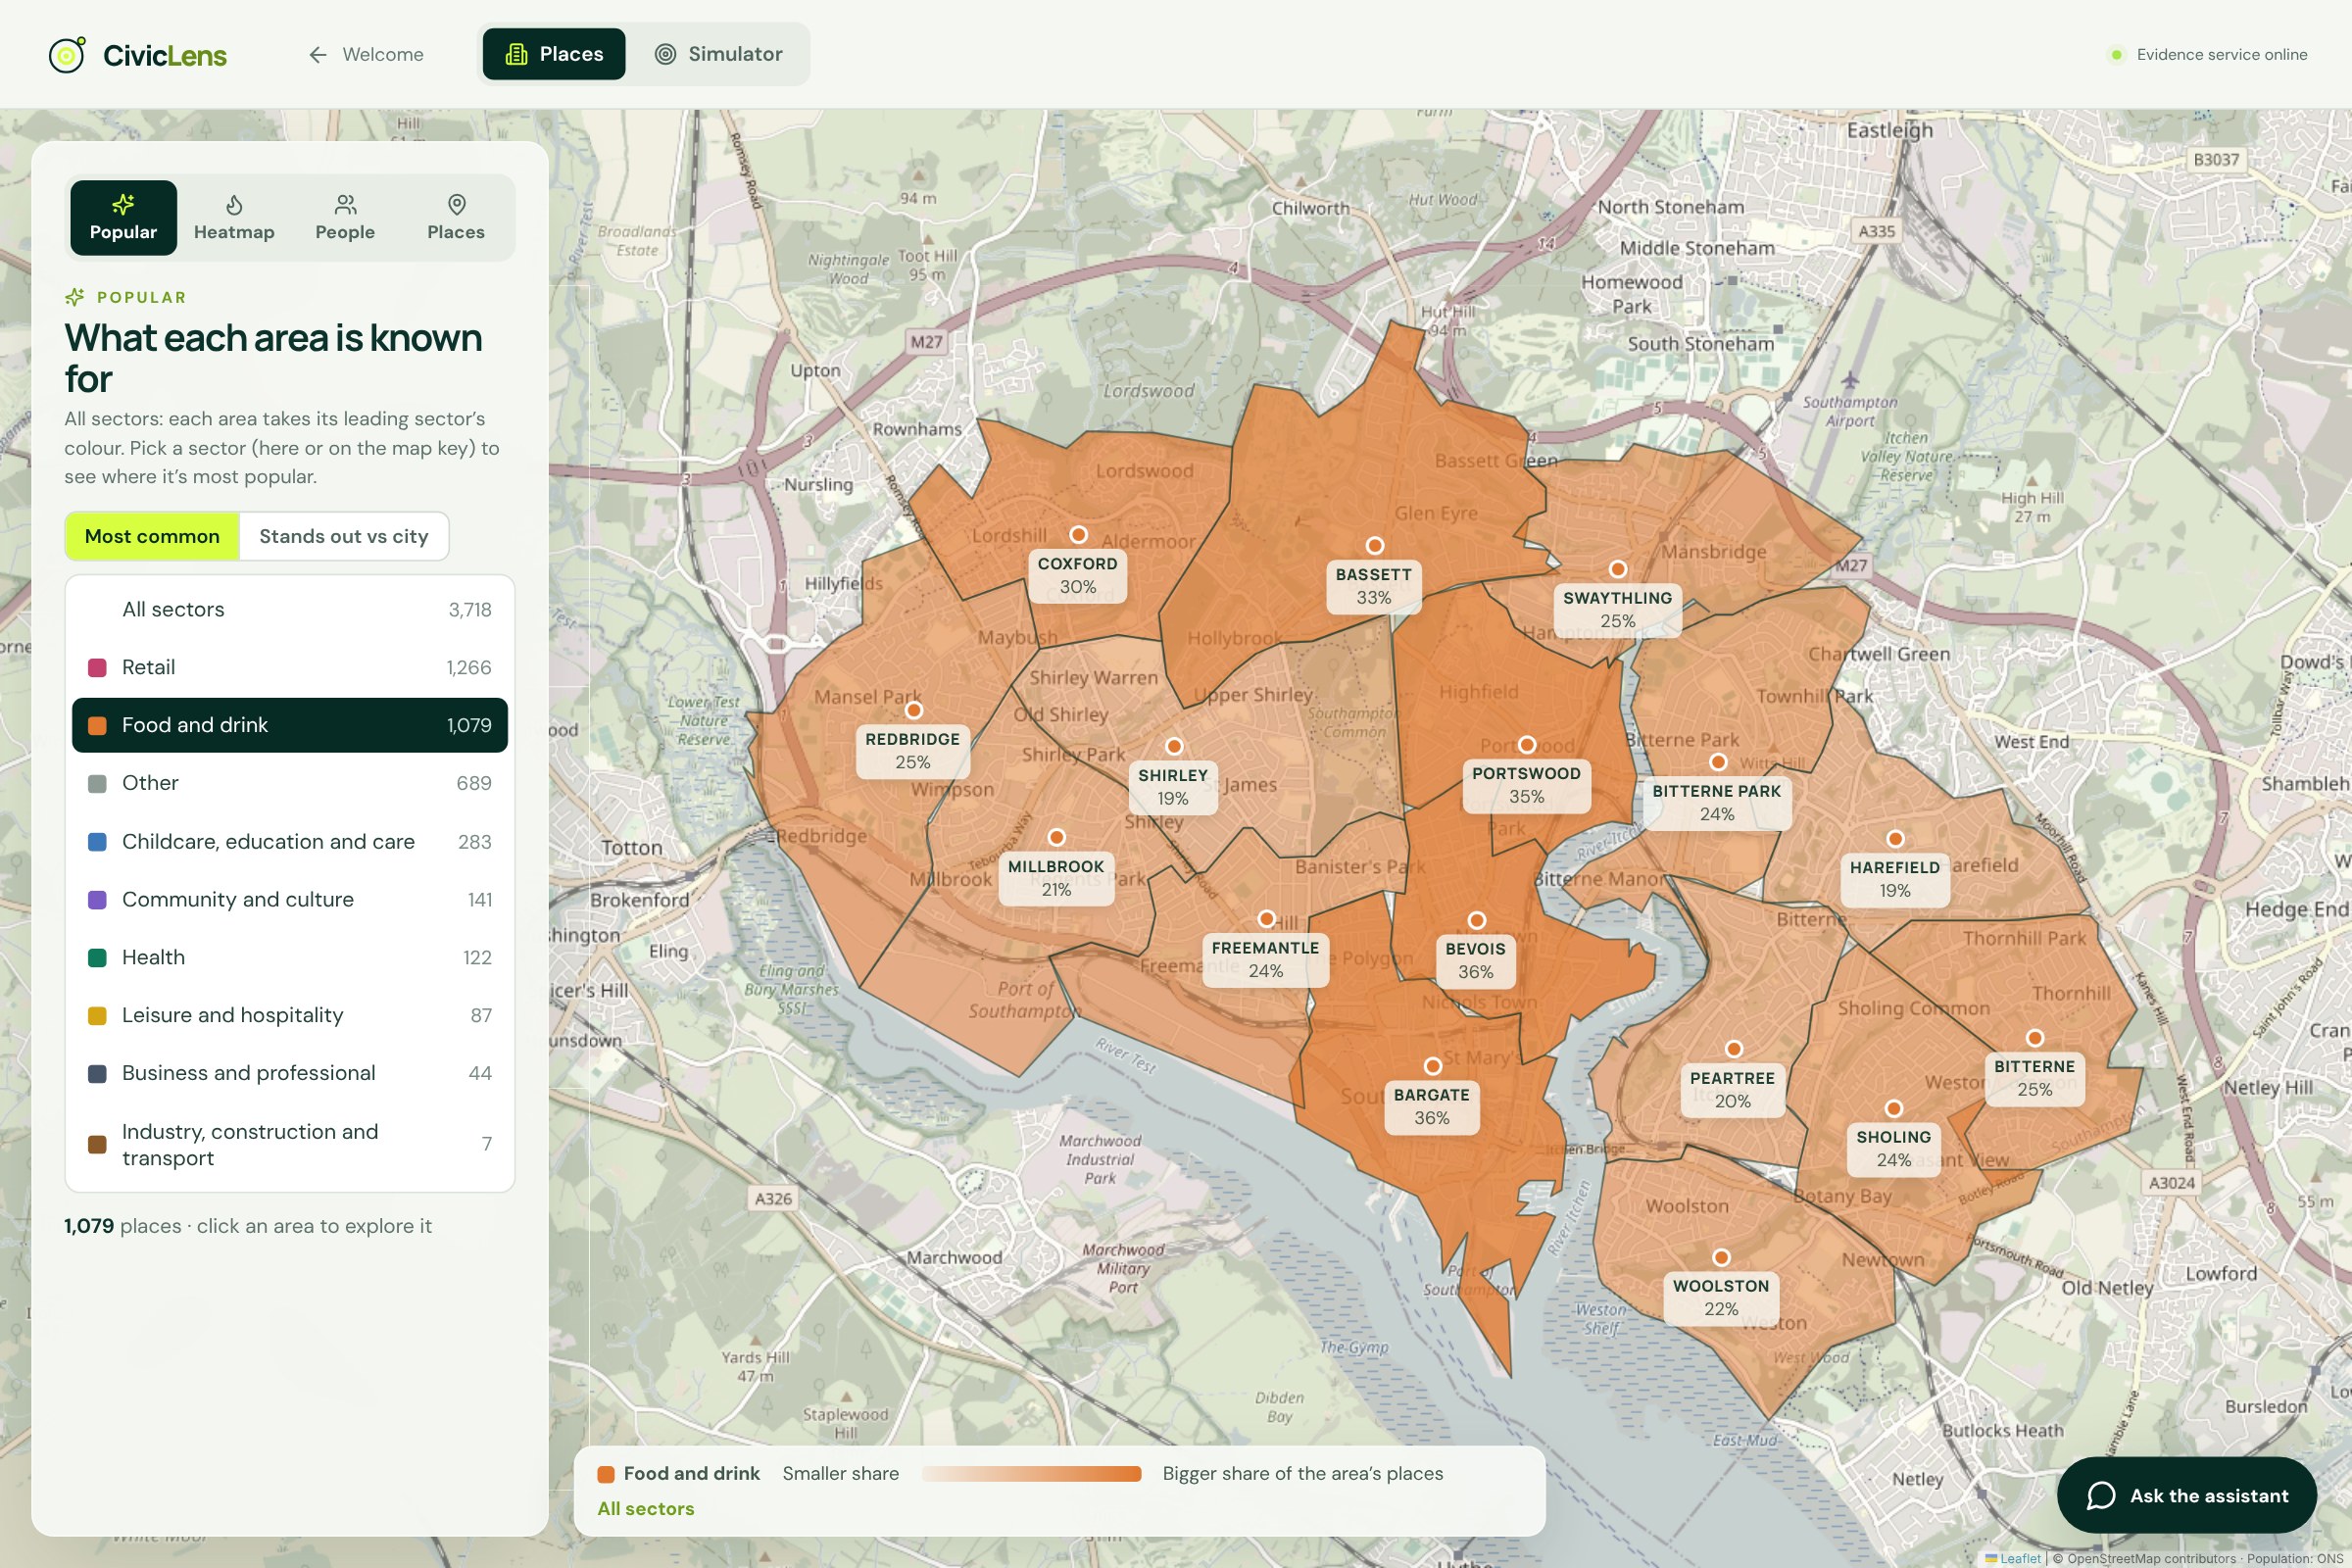
Places view: each ward shaded by its share of food and drink businesses (1,079 places), showing where the sector is strongest.
-
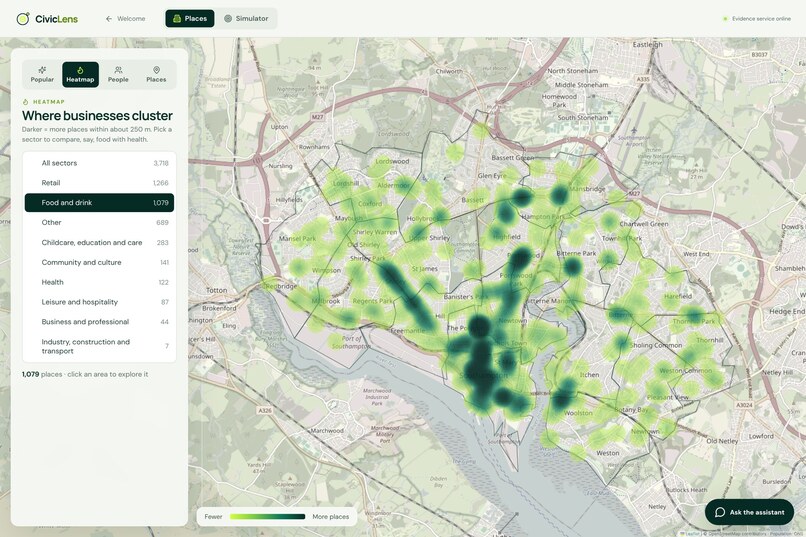
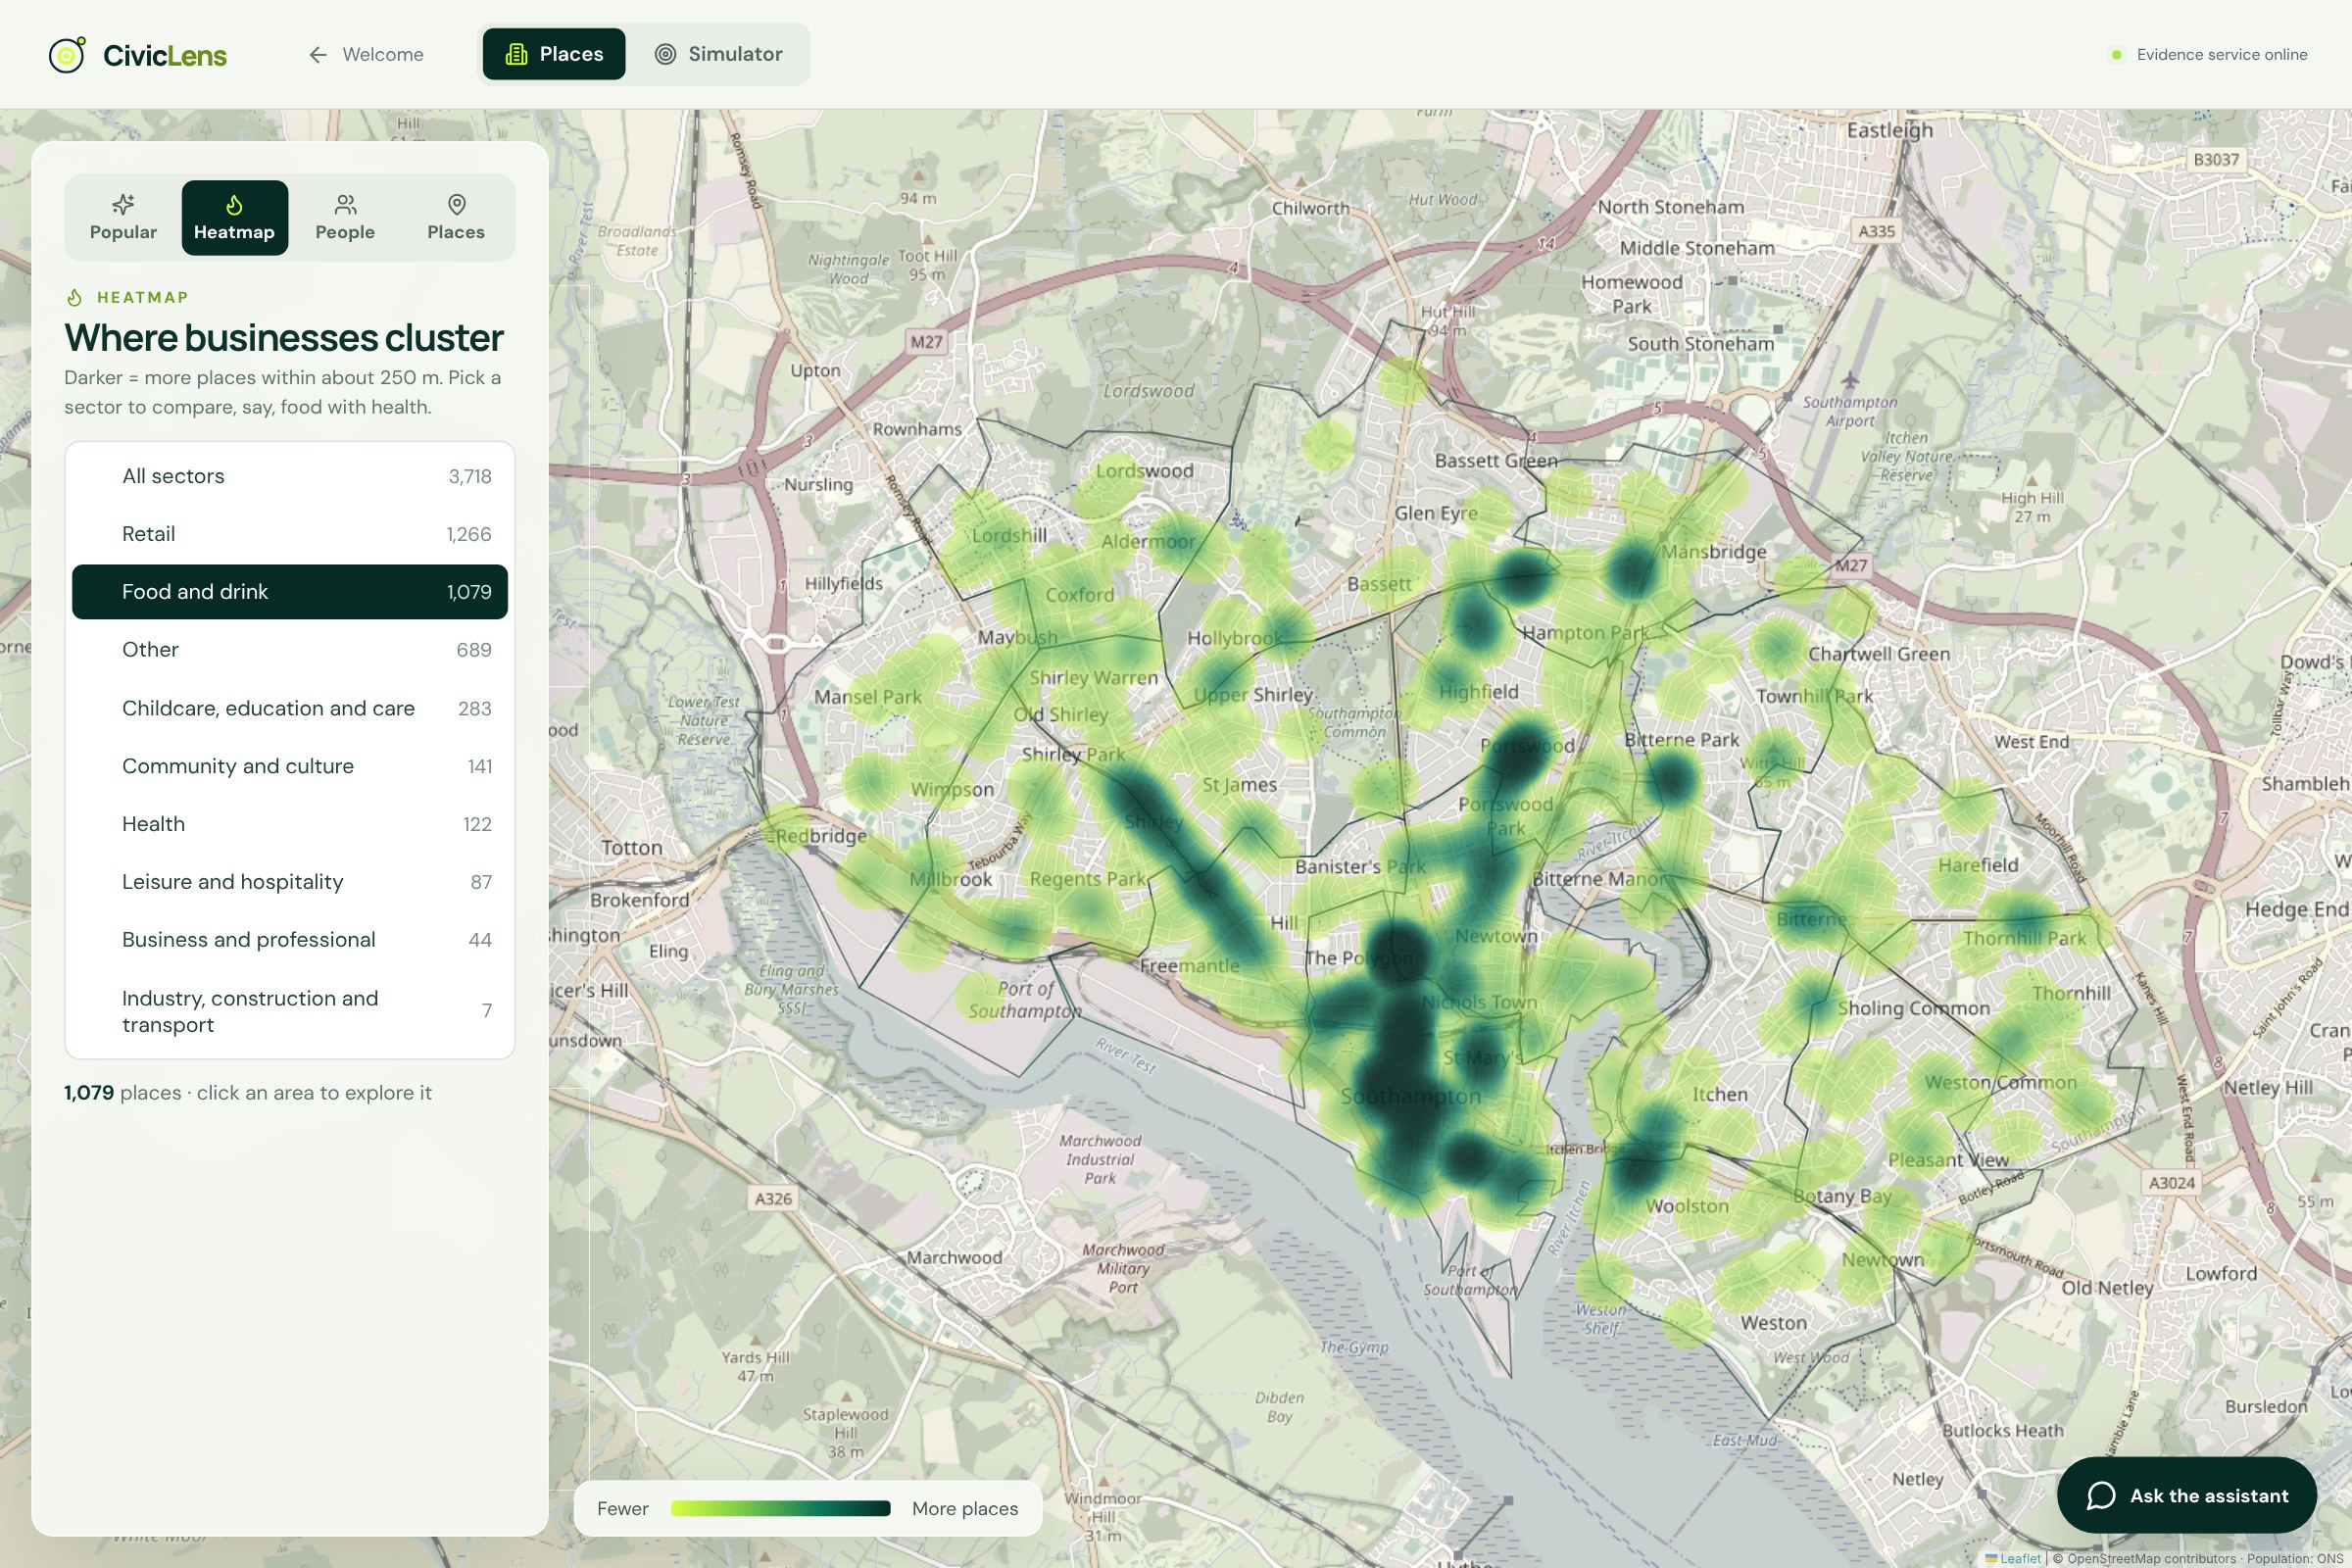
Heatmap view: where food and drink businesses cluster across the city (darker = more places within about 200 m).
-
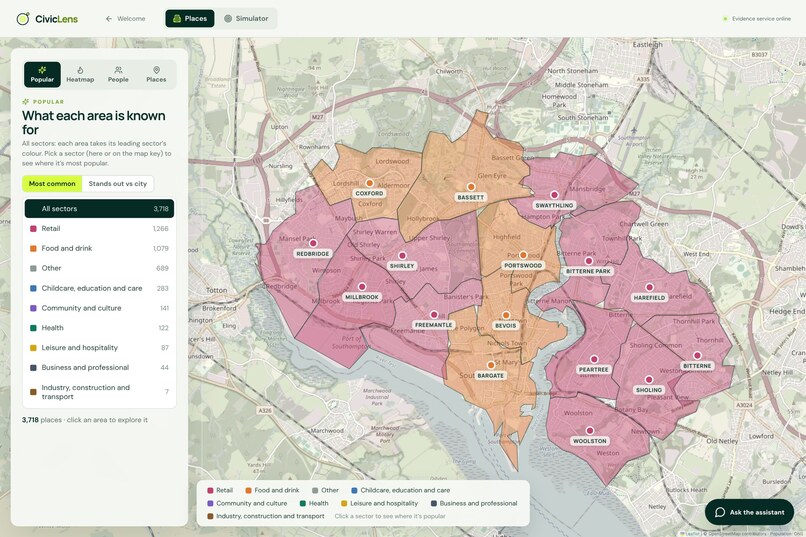
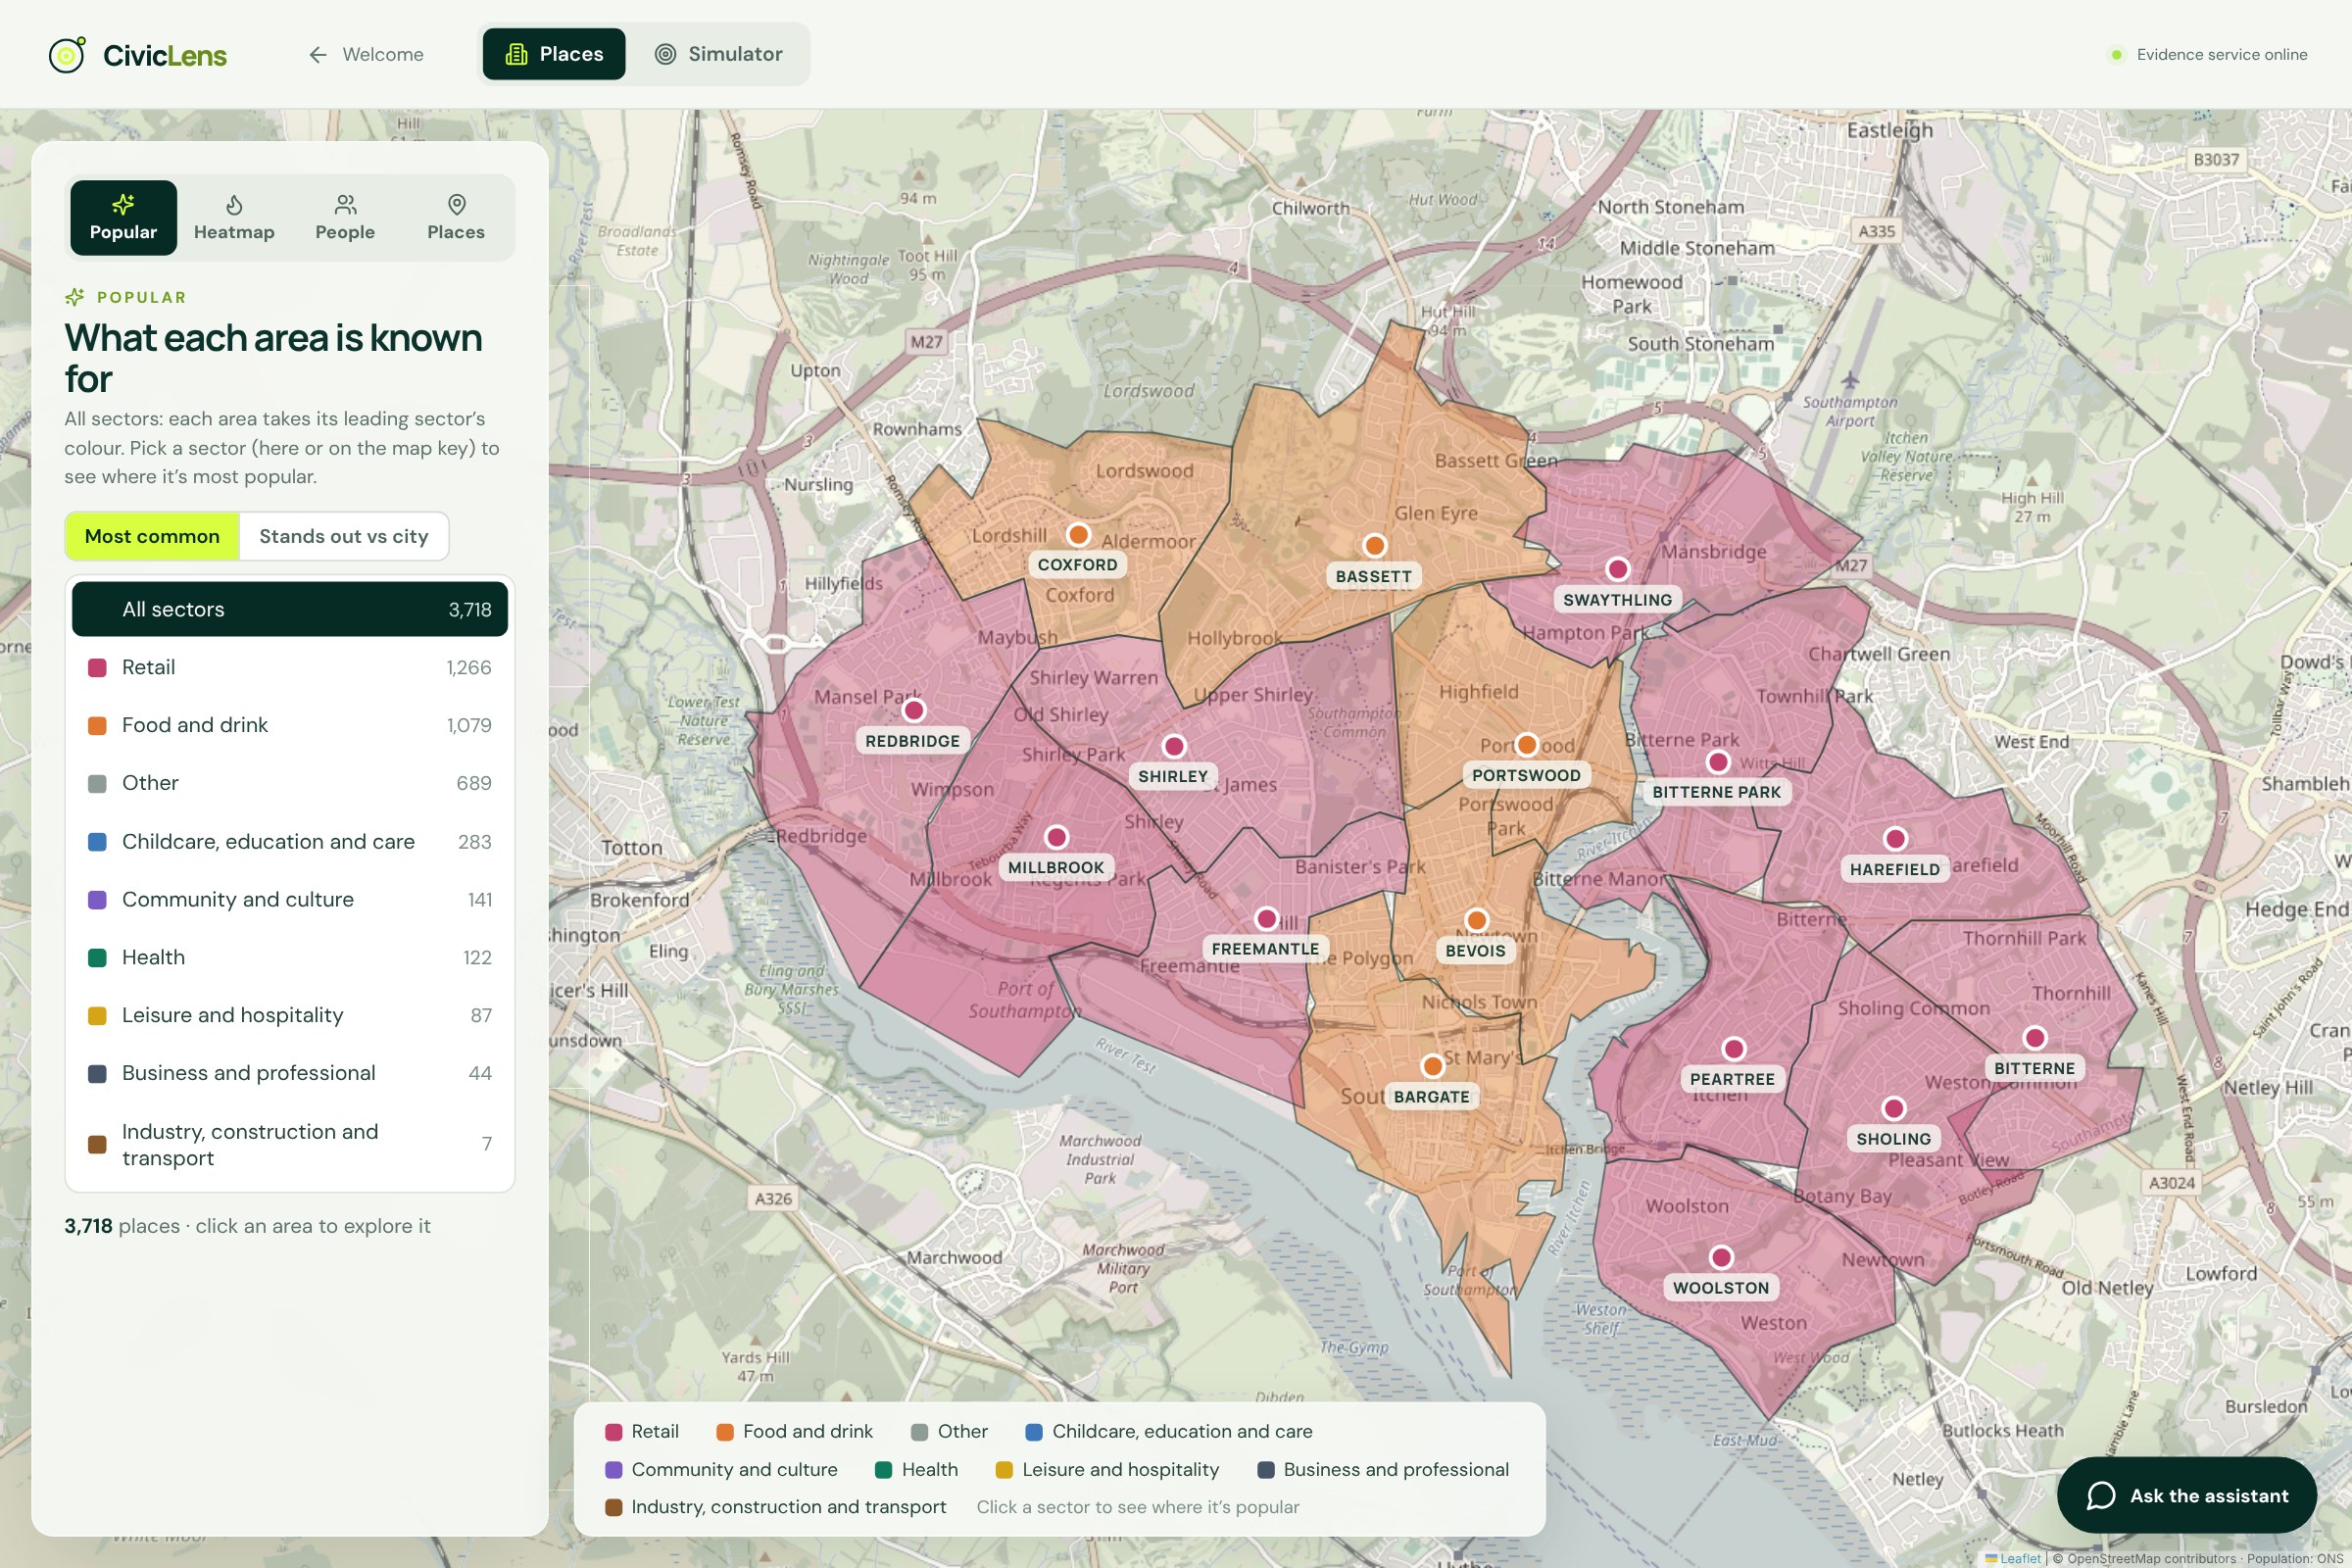
Sector map: every ward coloured by its most common business type, across all 3,718 mapped places in Southampton.
-
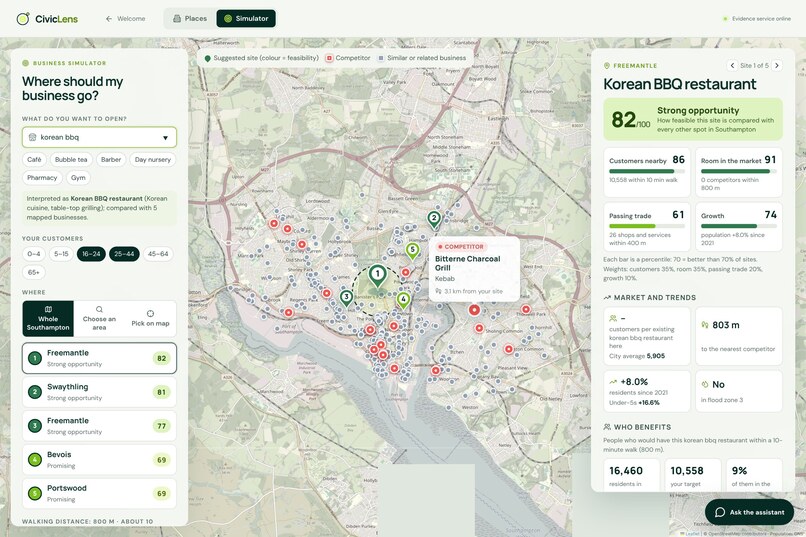
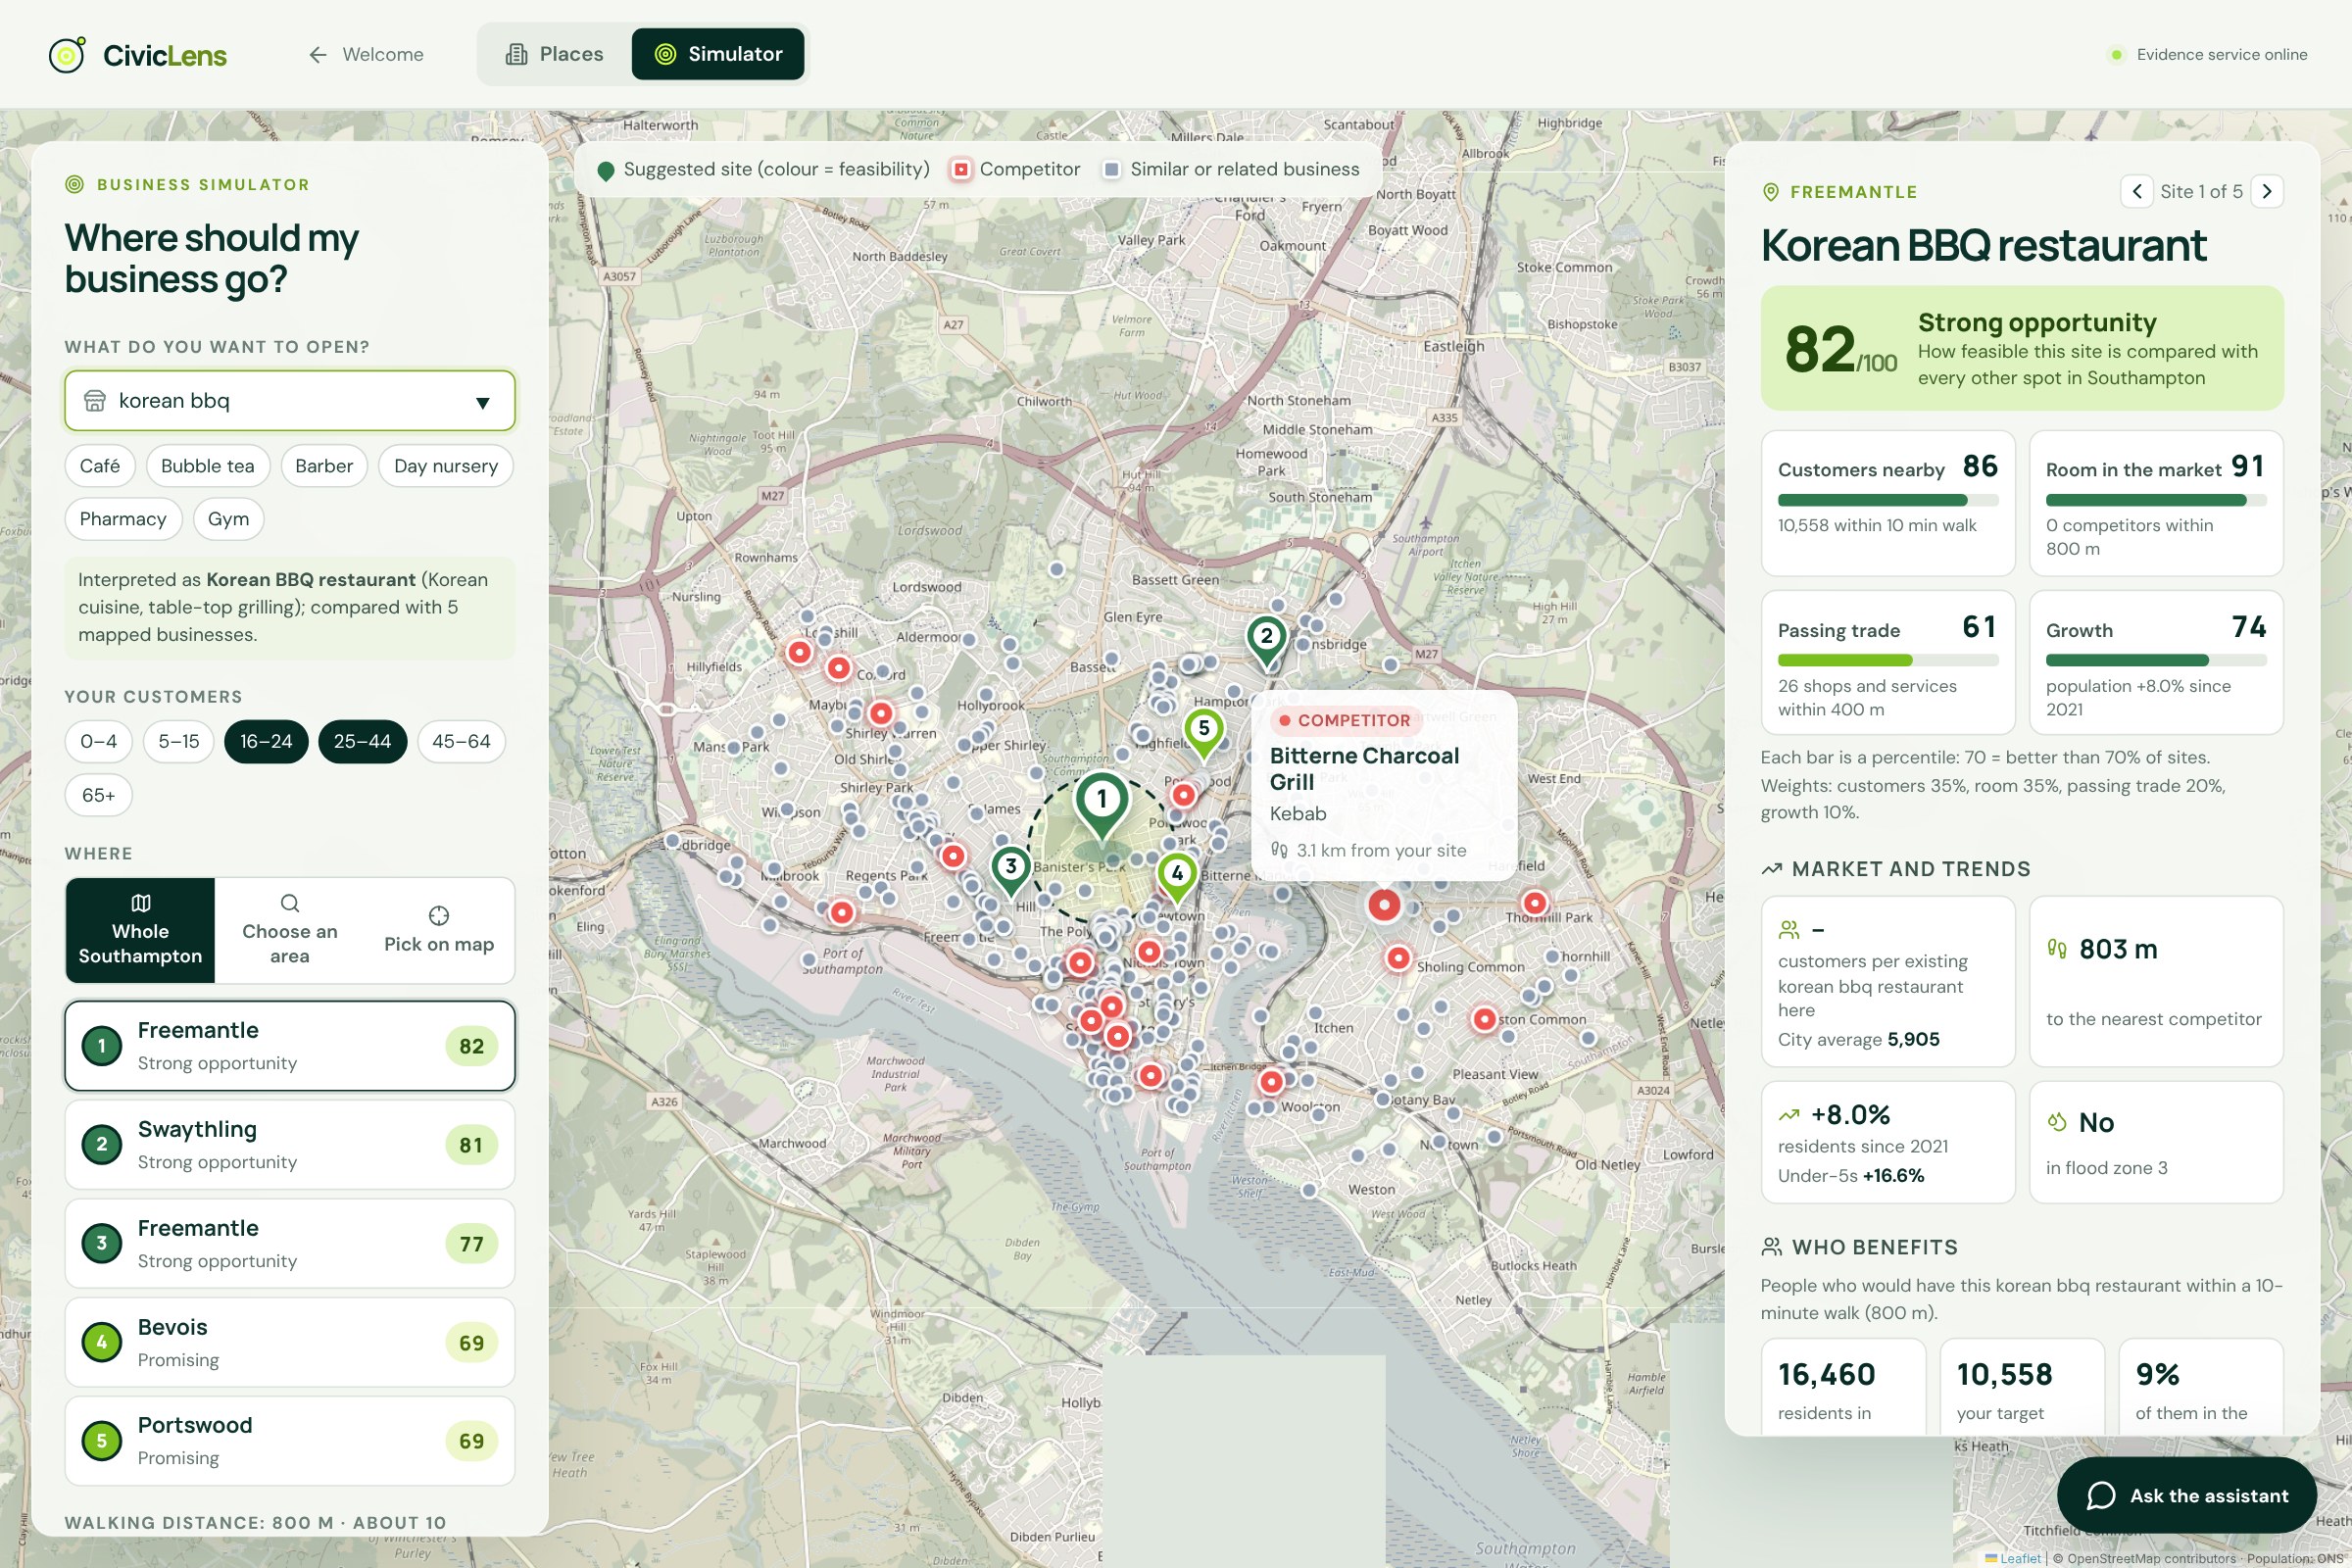
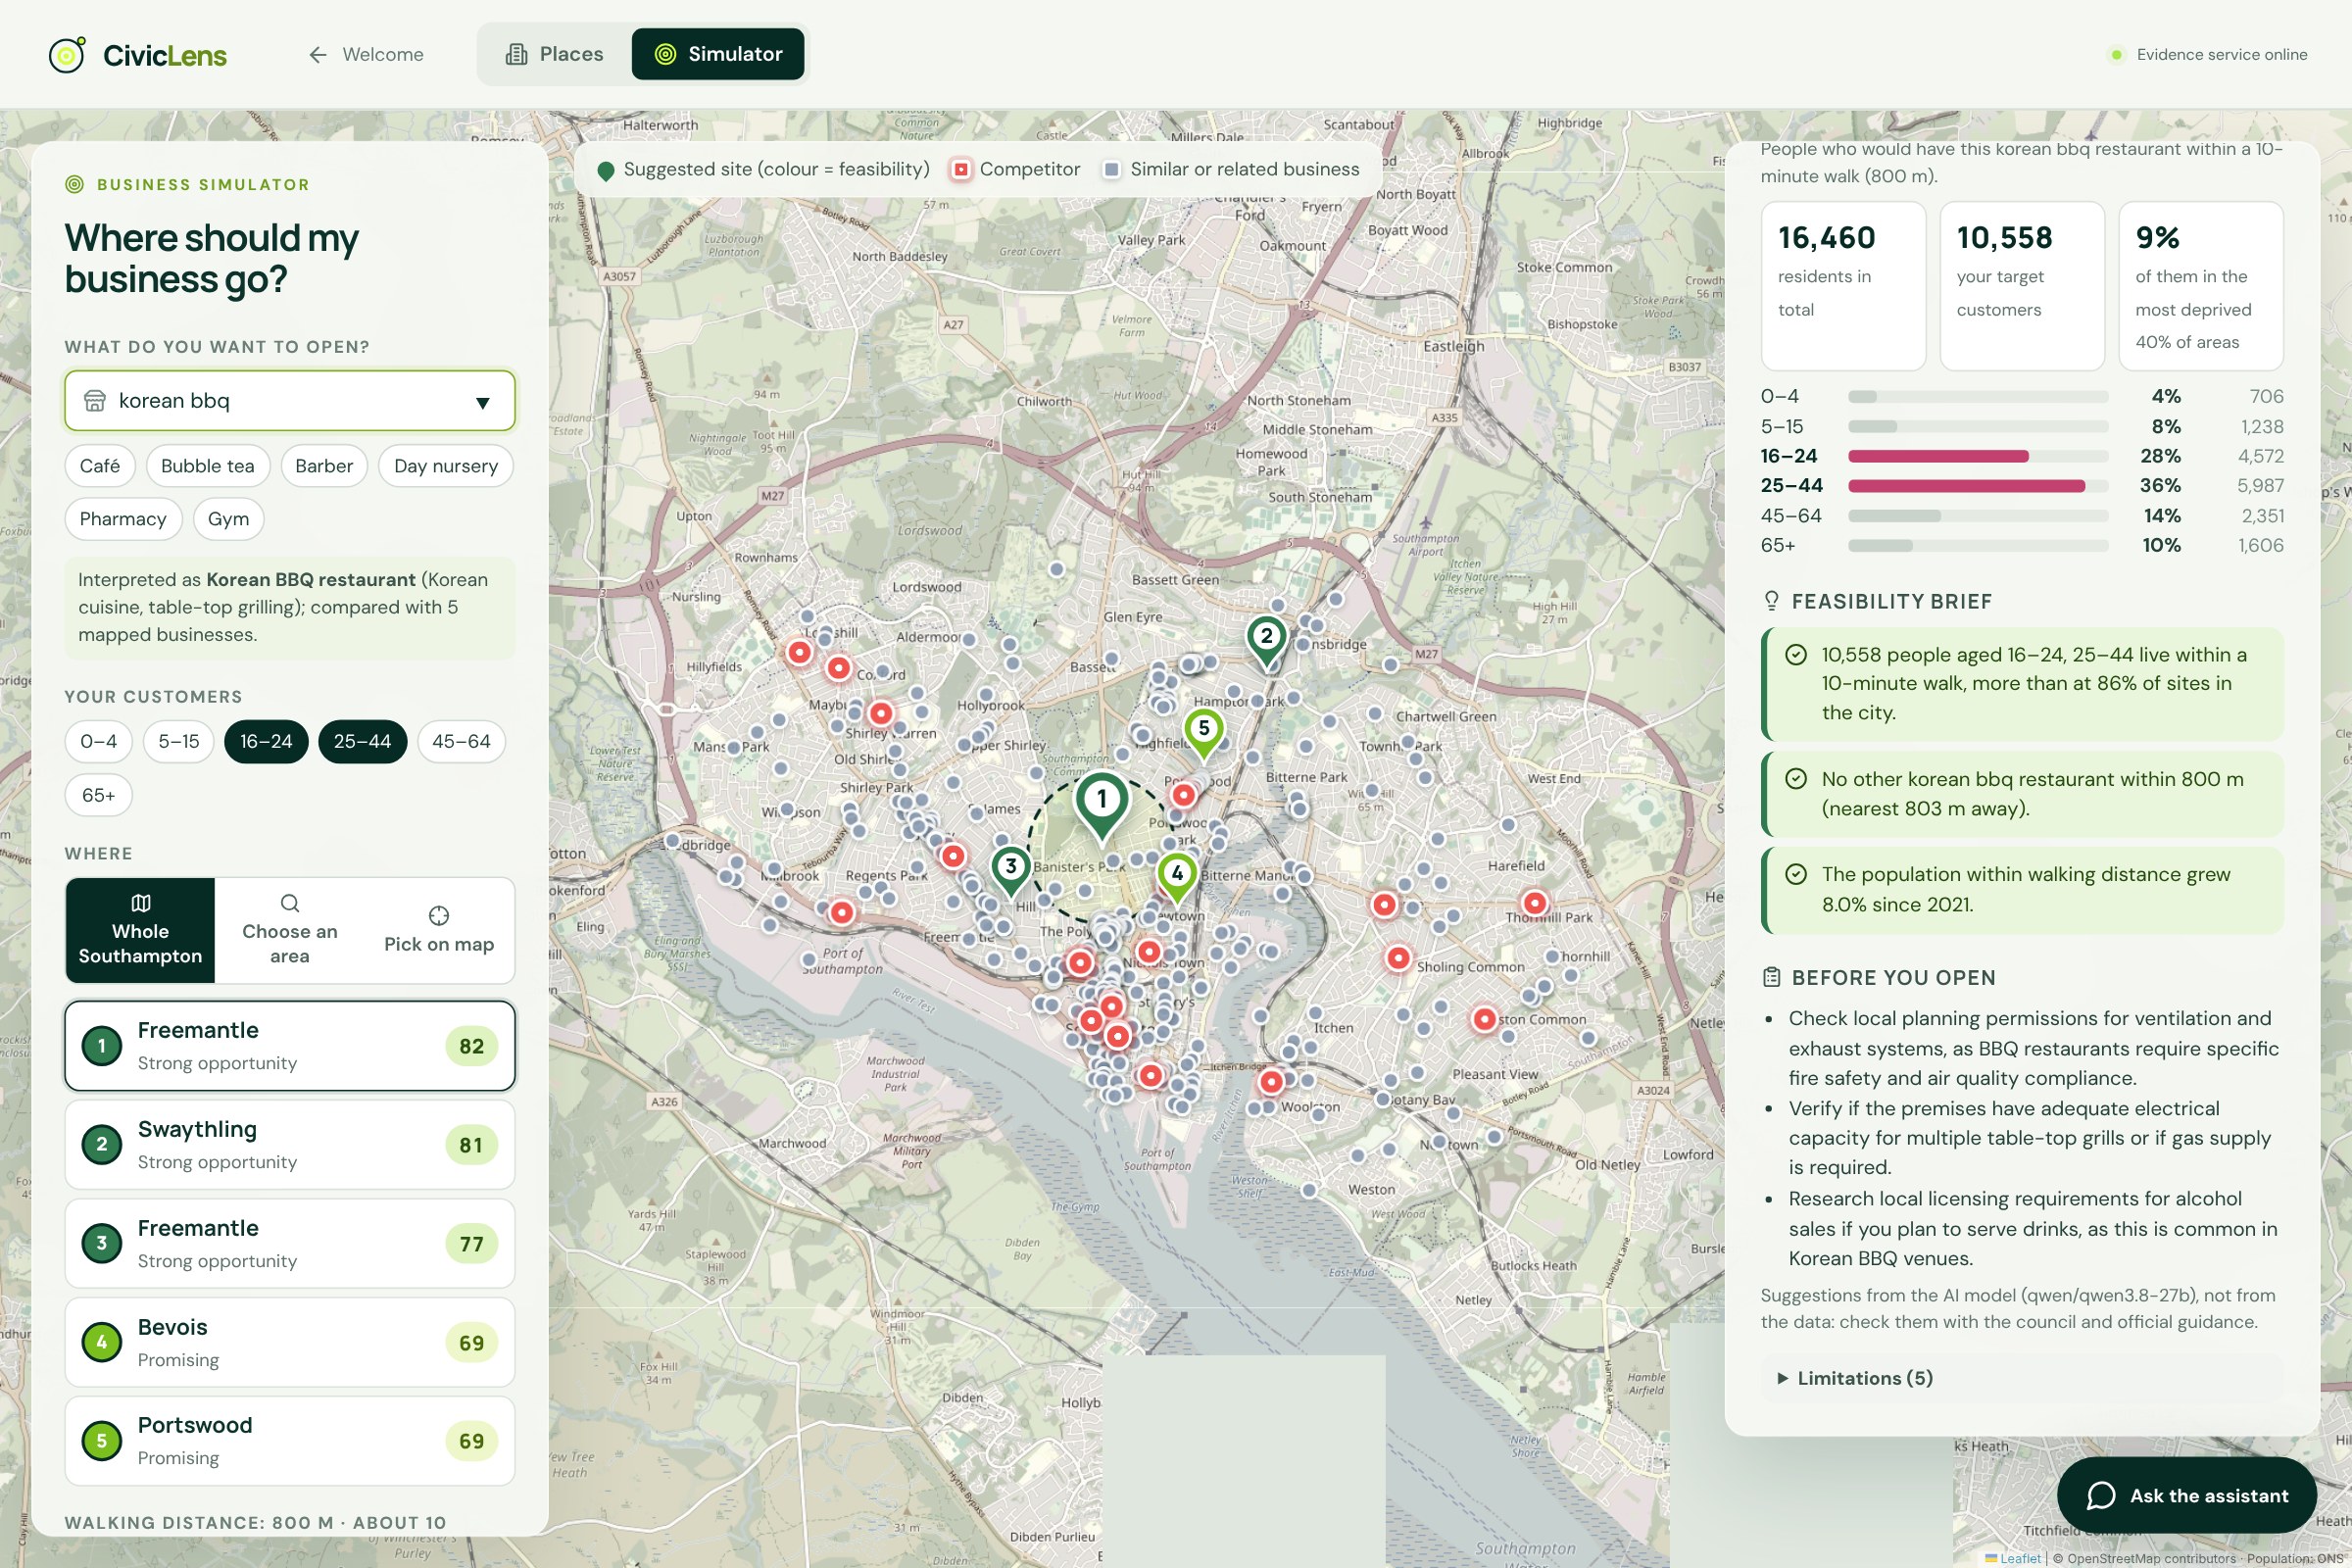
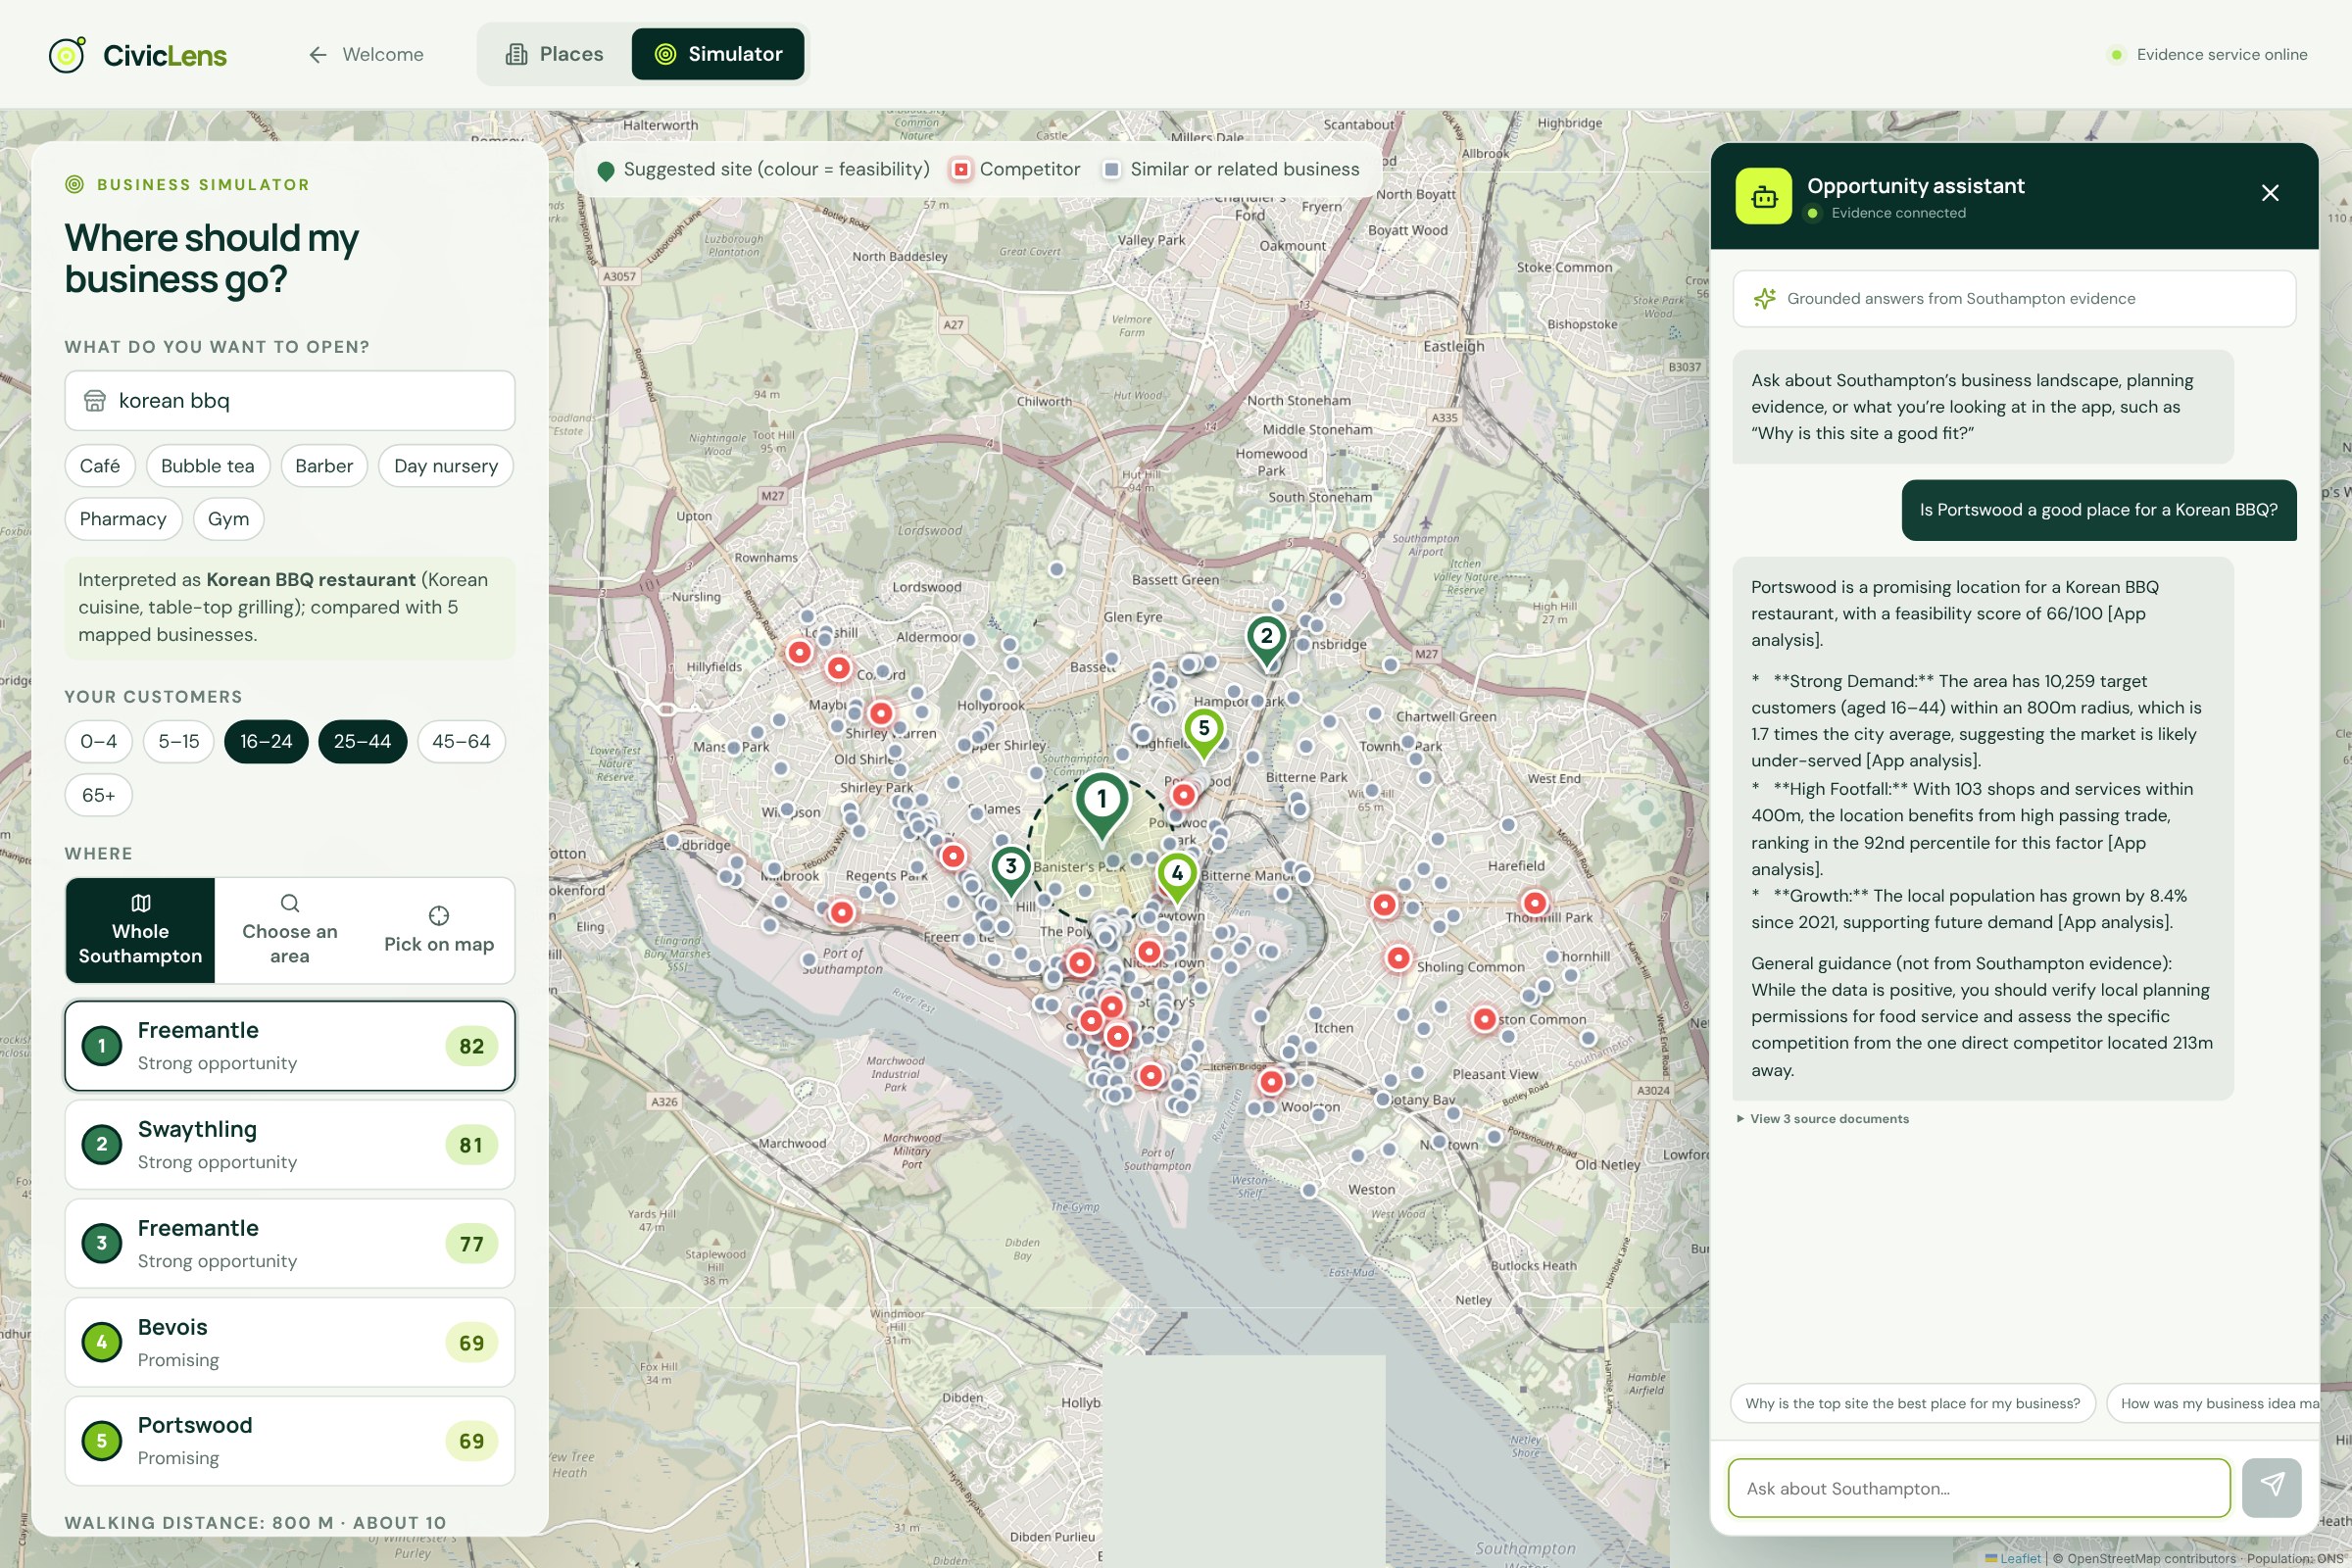
Business simulator: 'korean bbq' is mapped to its real competitors, and the top five sites are ranked, led by Freemantle at 82/100.
-
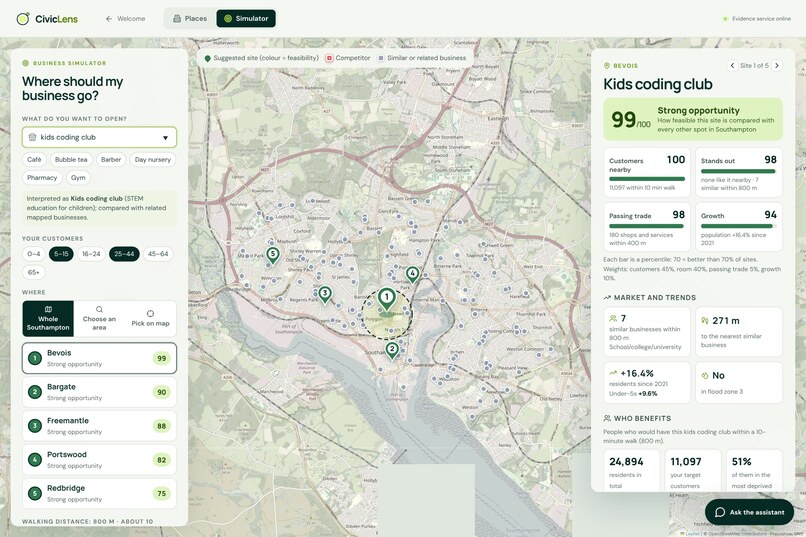
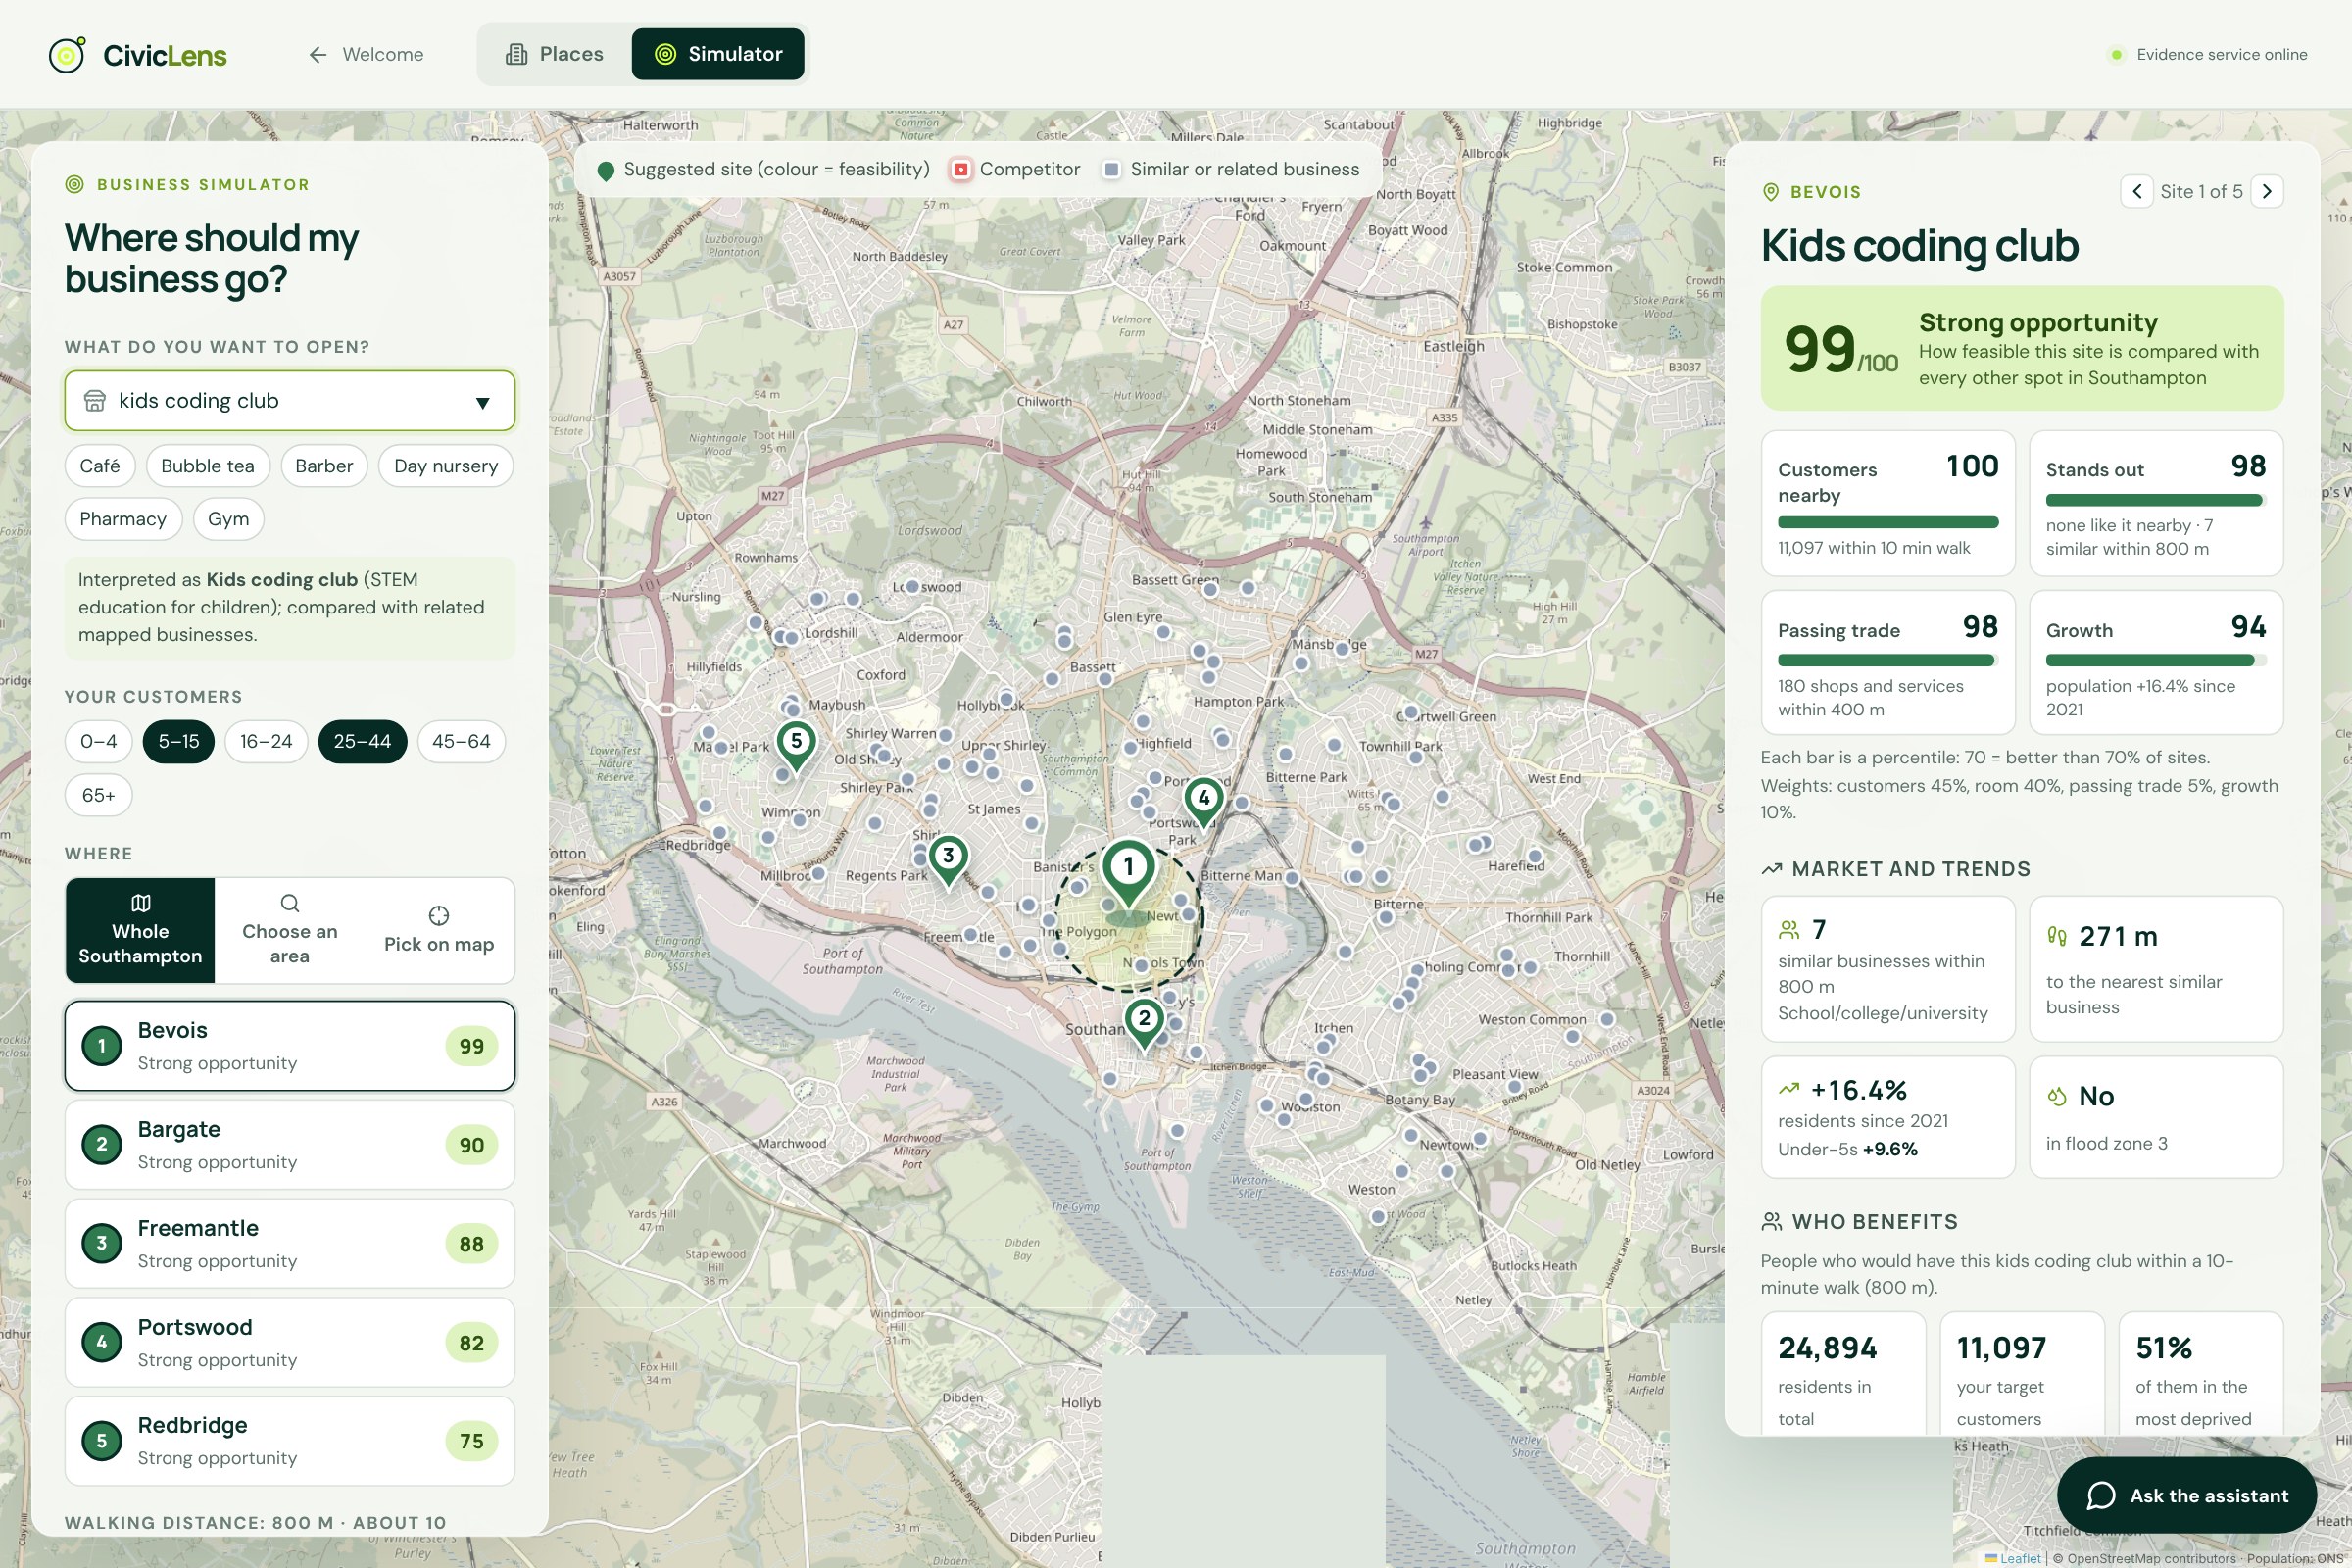
Niche ideas work too: 'kids coding club' scores 99/100 in Bevois, with 7 similar businesses nearby and 24,894 residents in range.
-
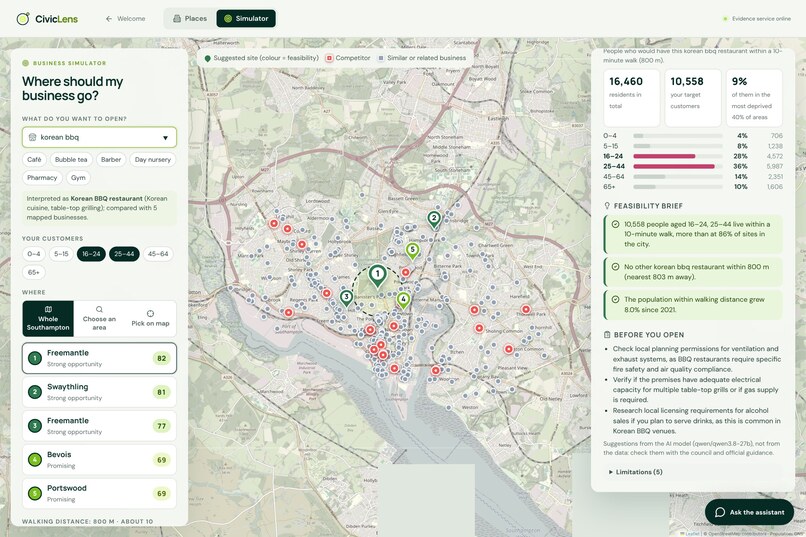
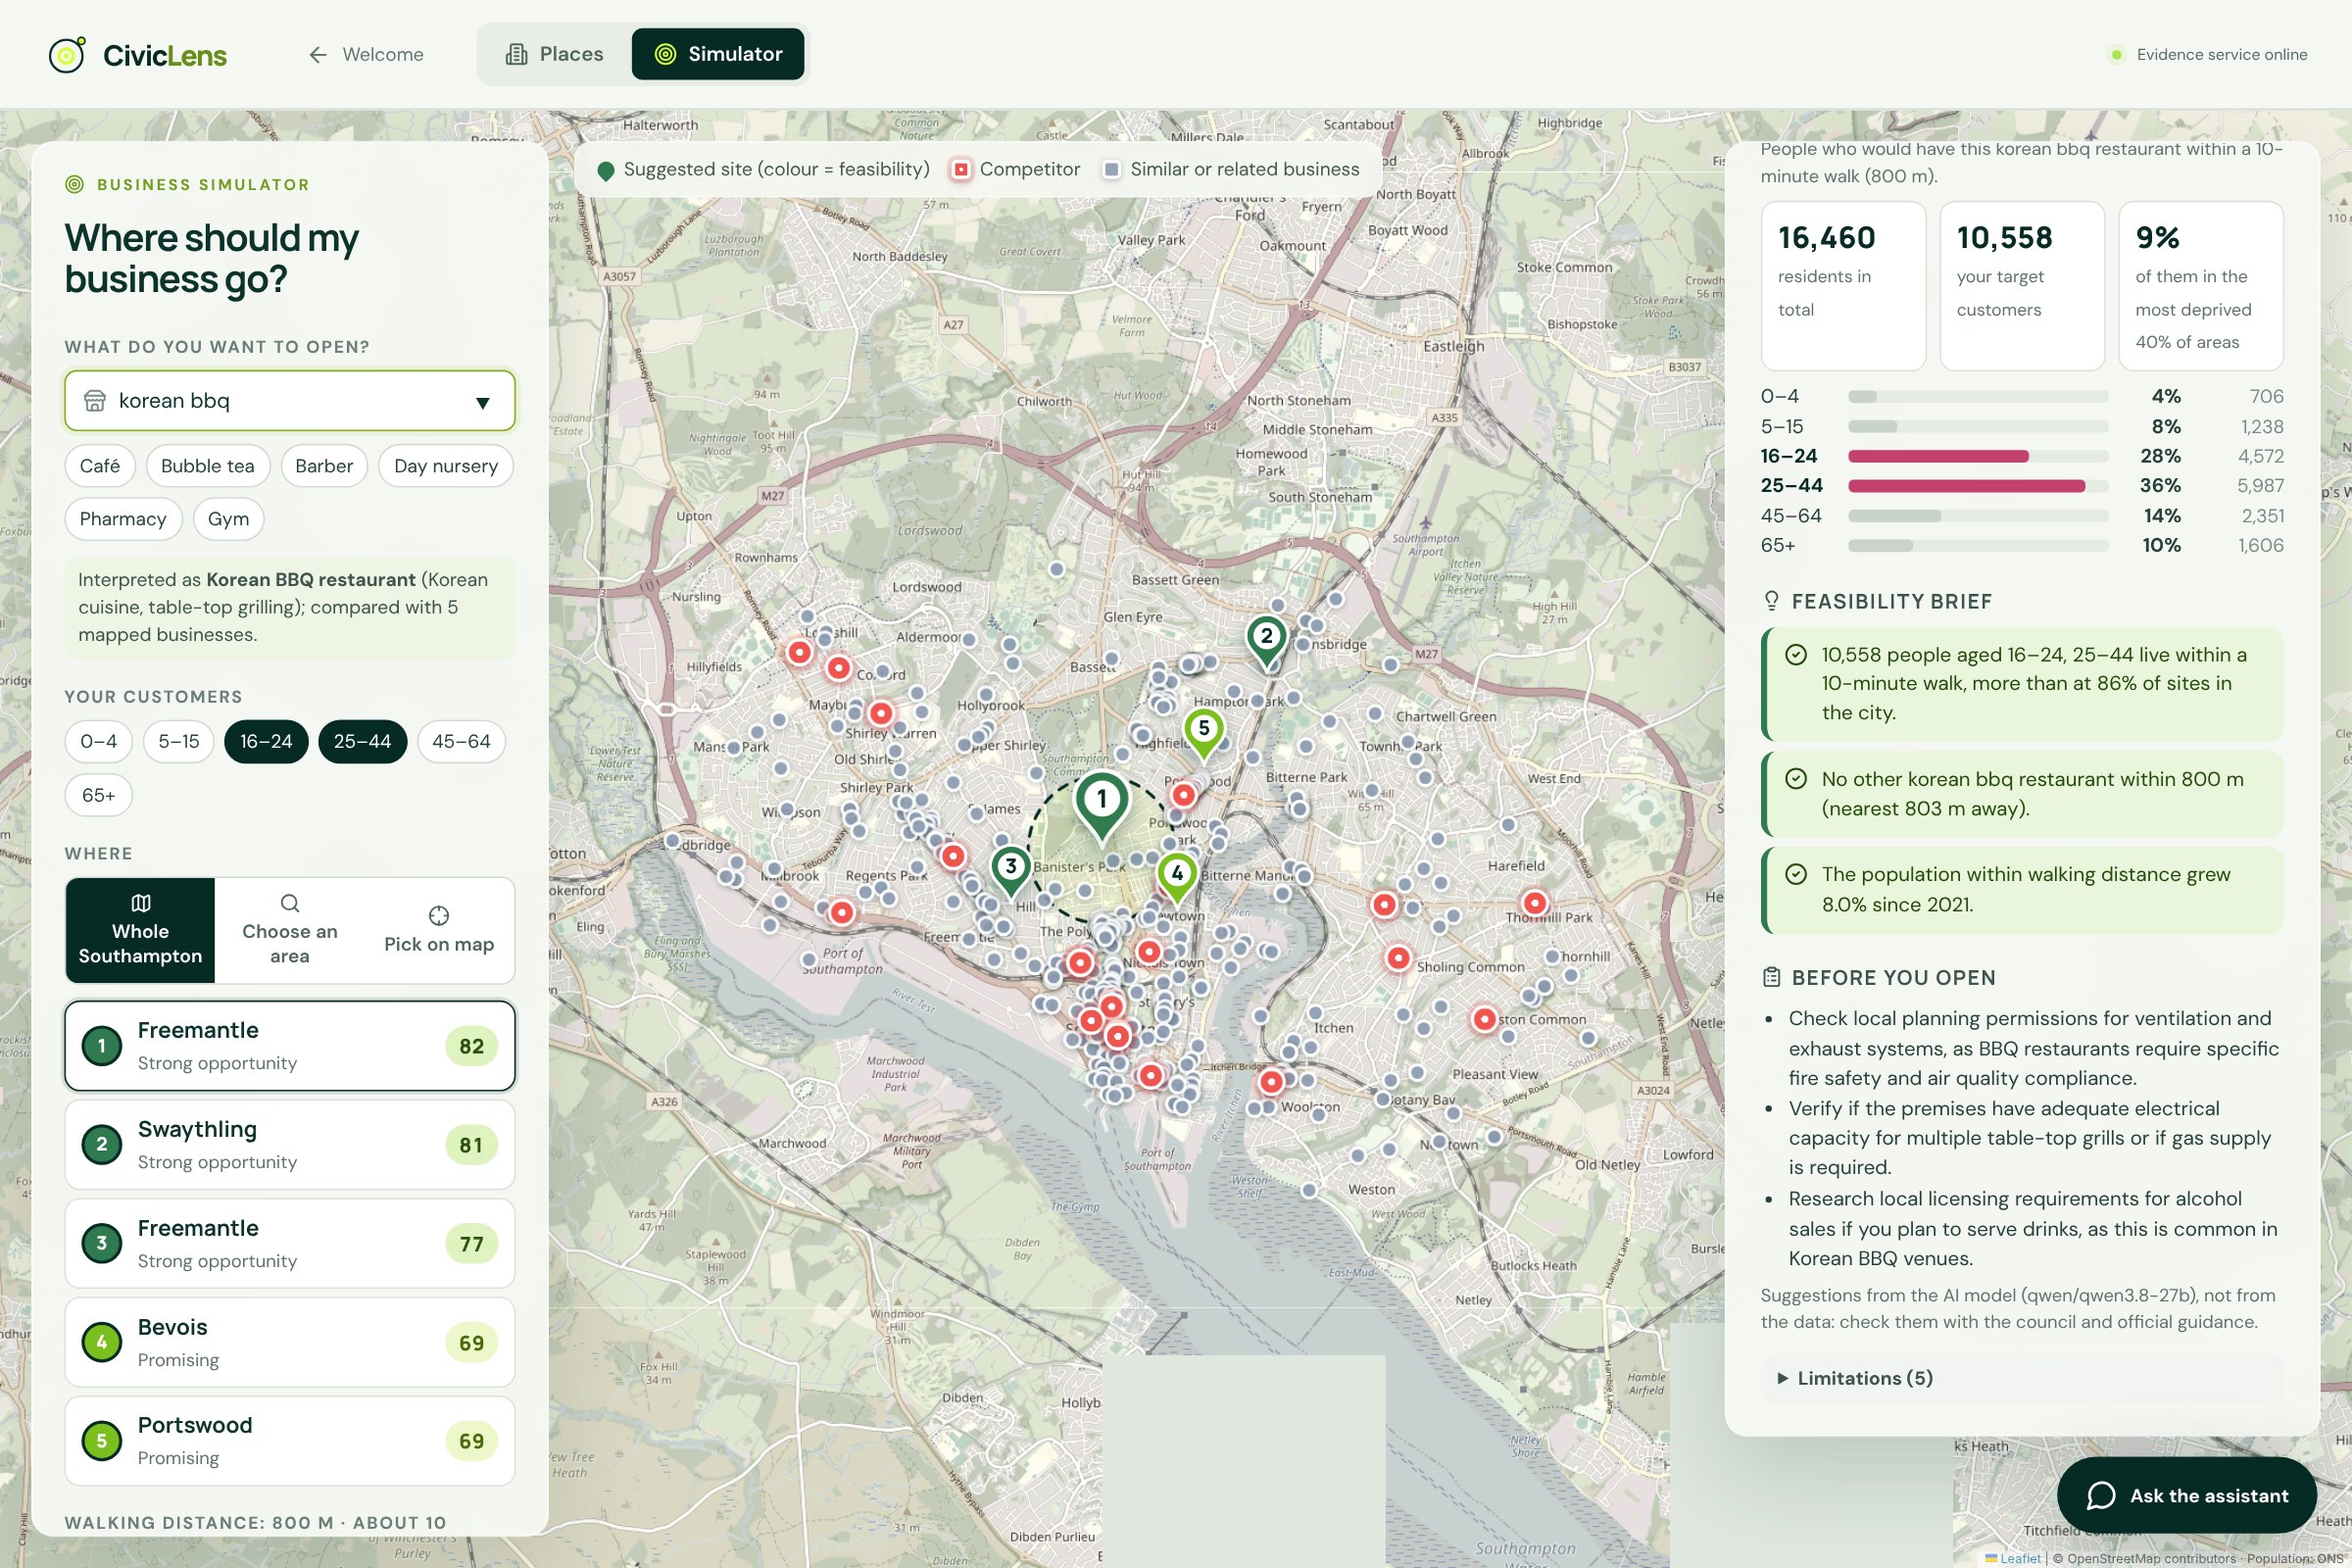
Feasibility brief: who lives within a 10-minute walk, whether a competitor is close, and what to check before opening.
-
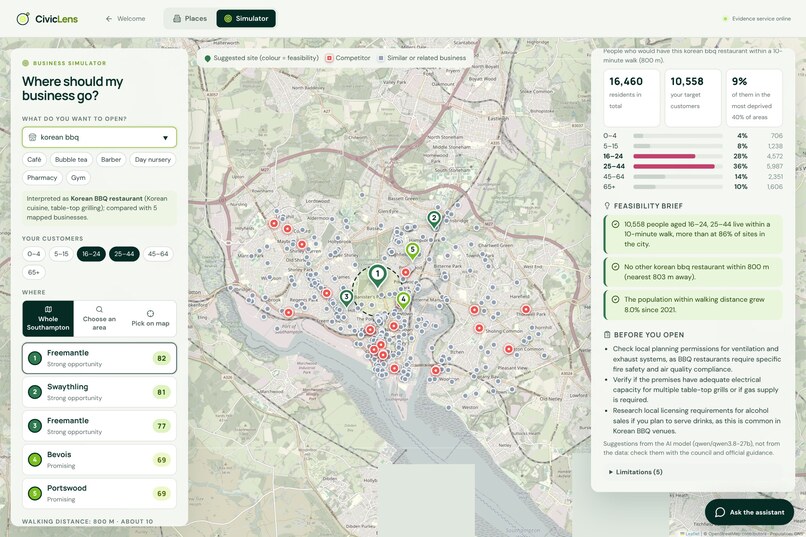
Feasibility brief: target customers by age group, population growth since 2021 and practical checks before you open.
-
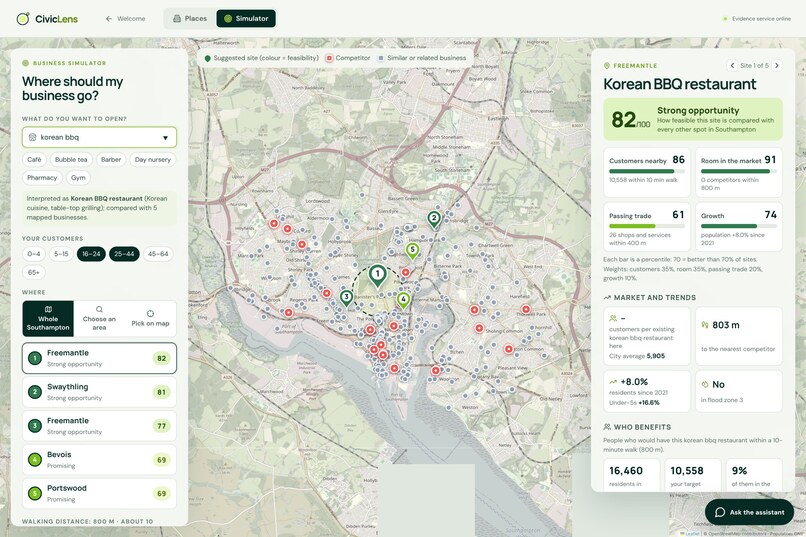
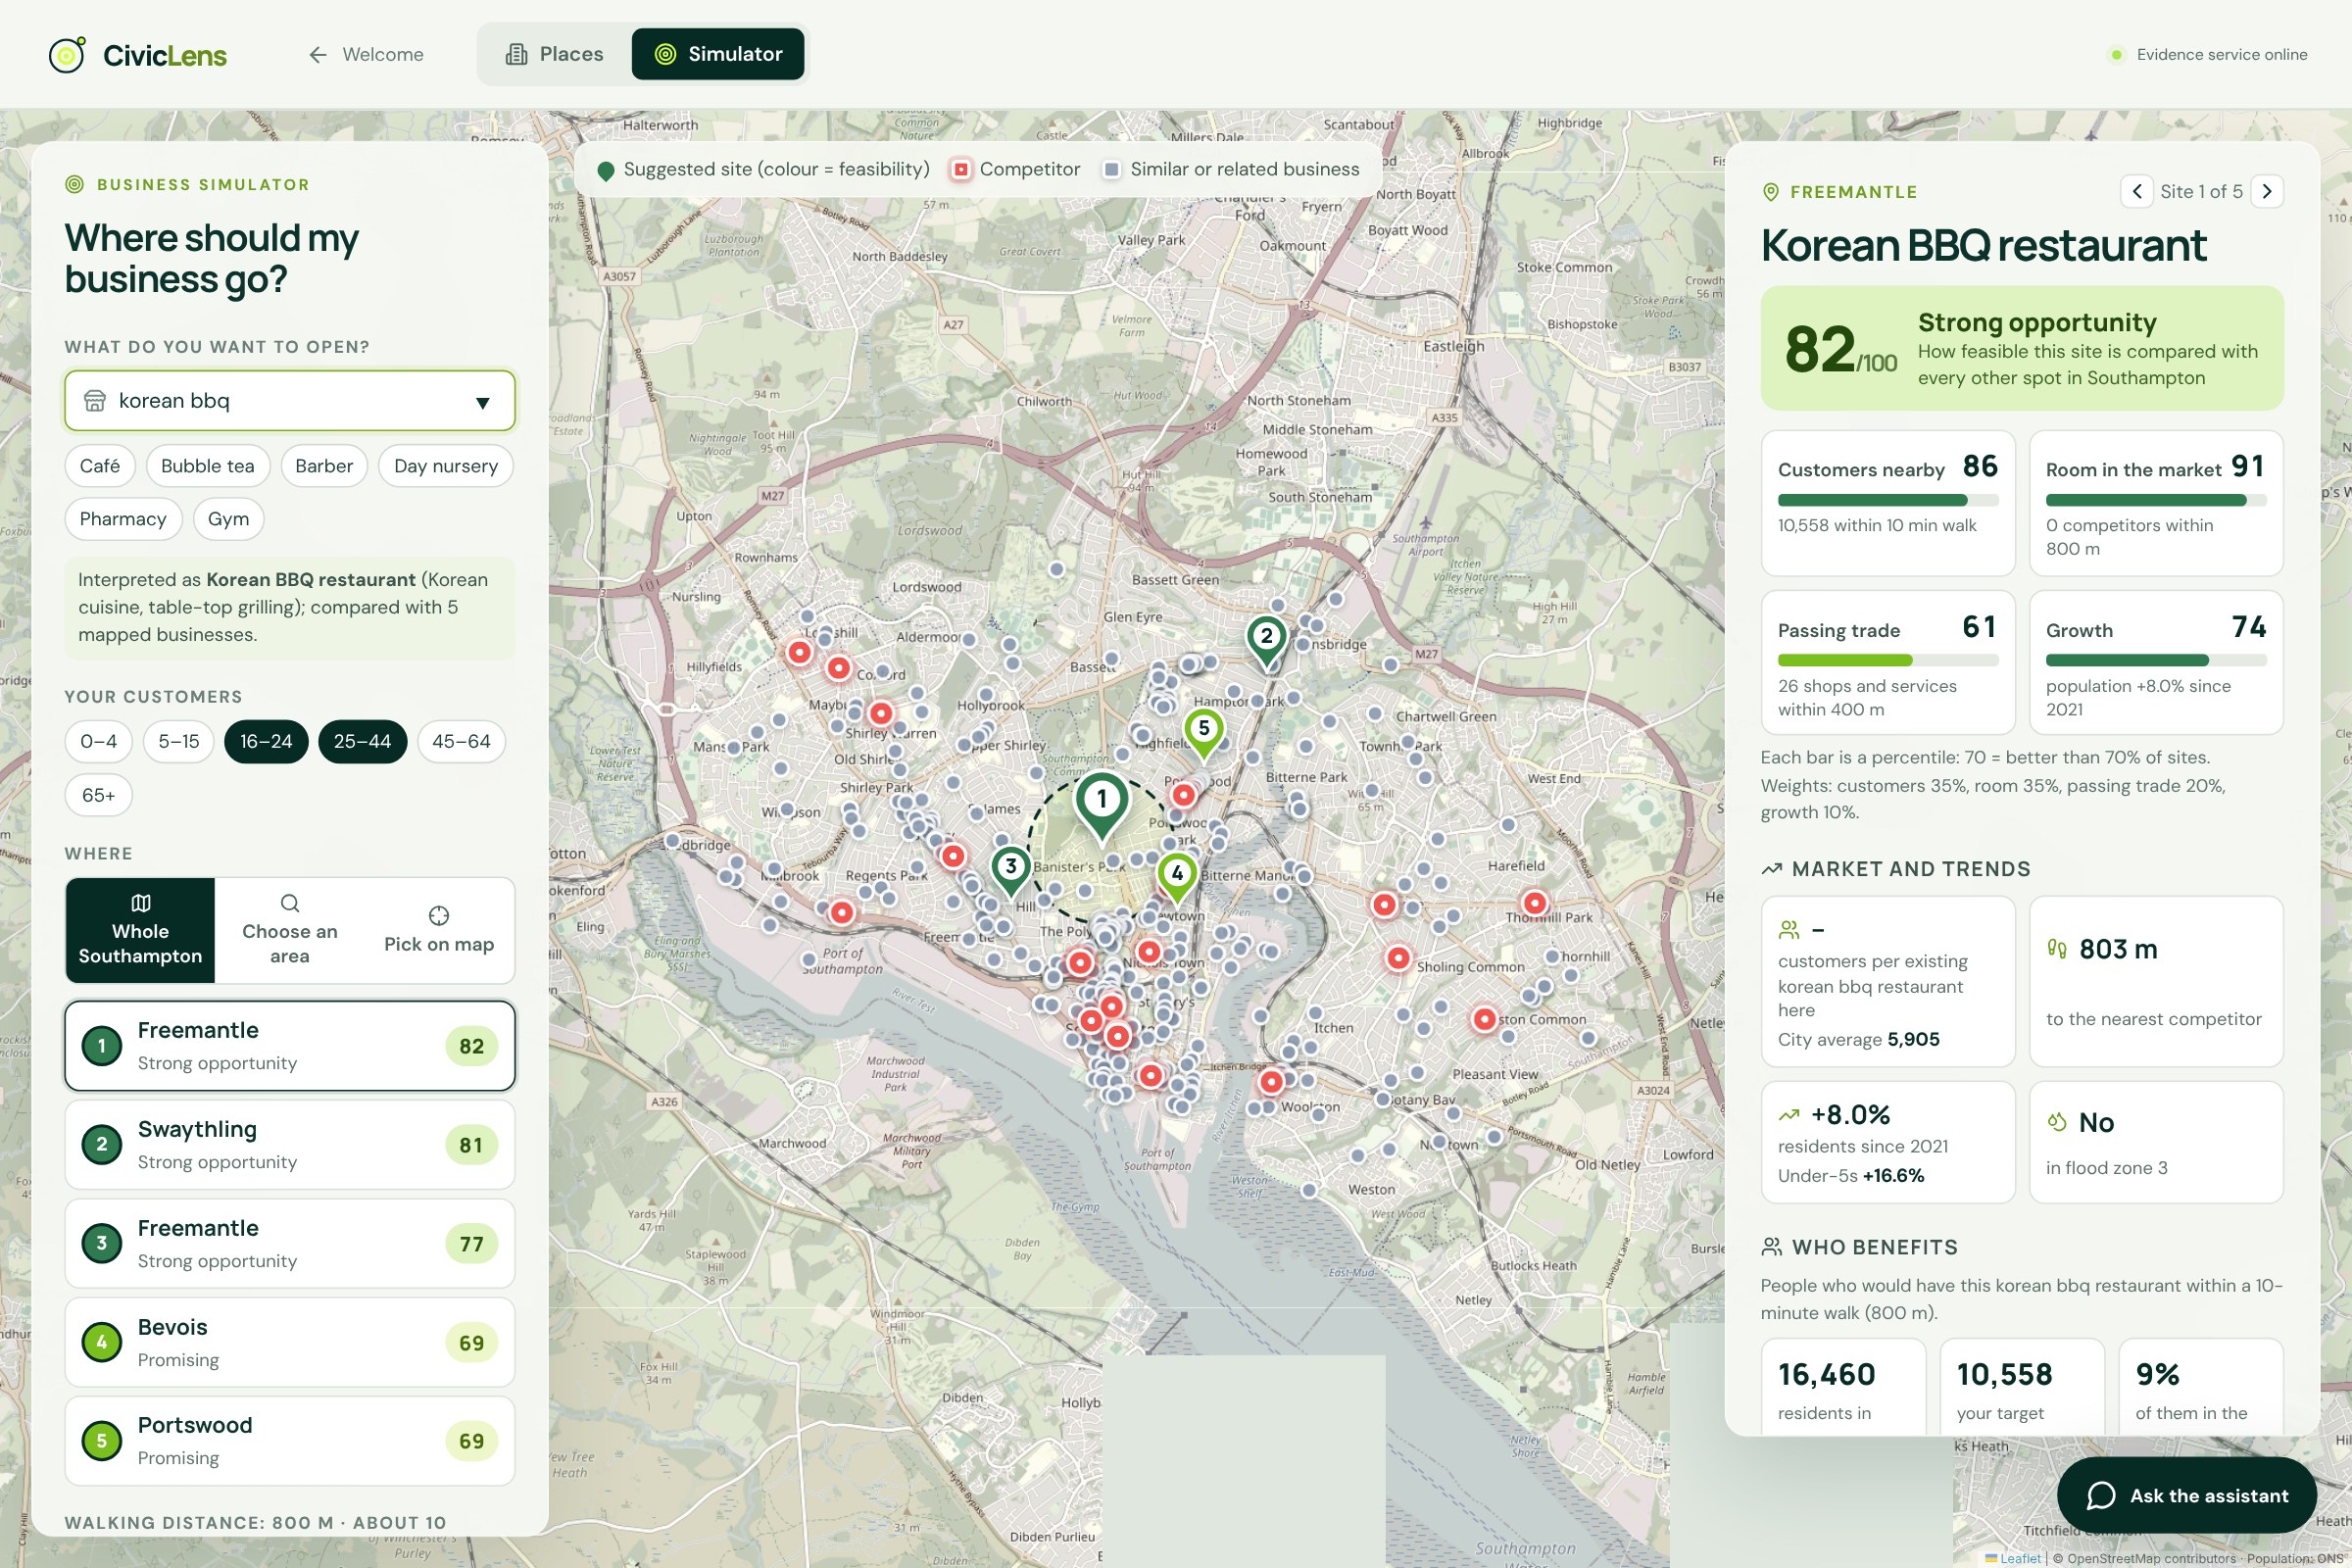
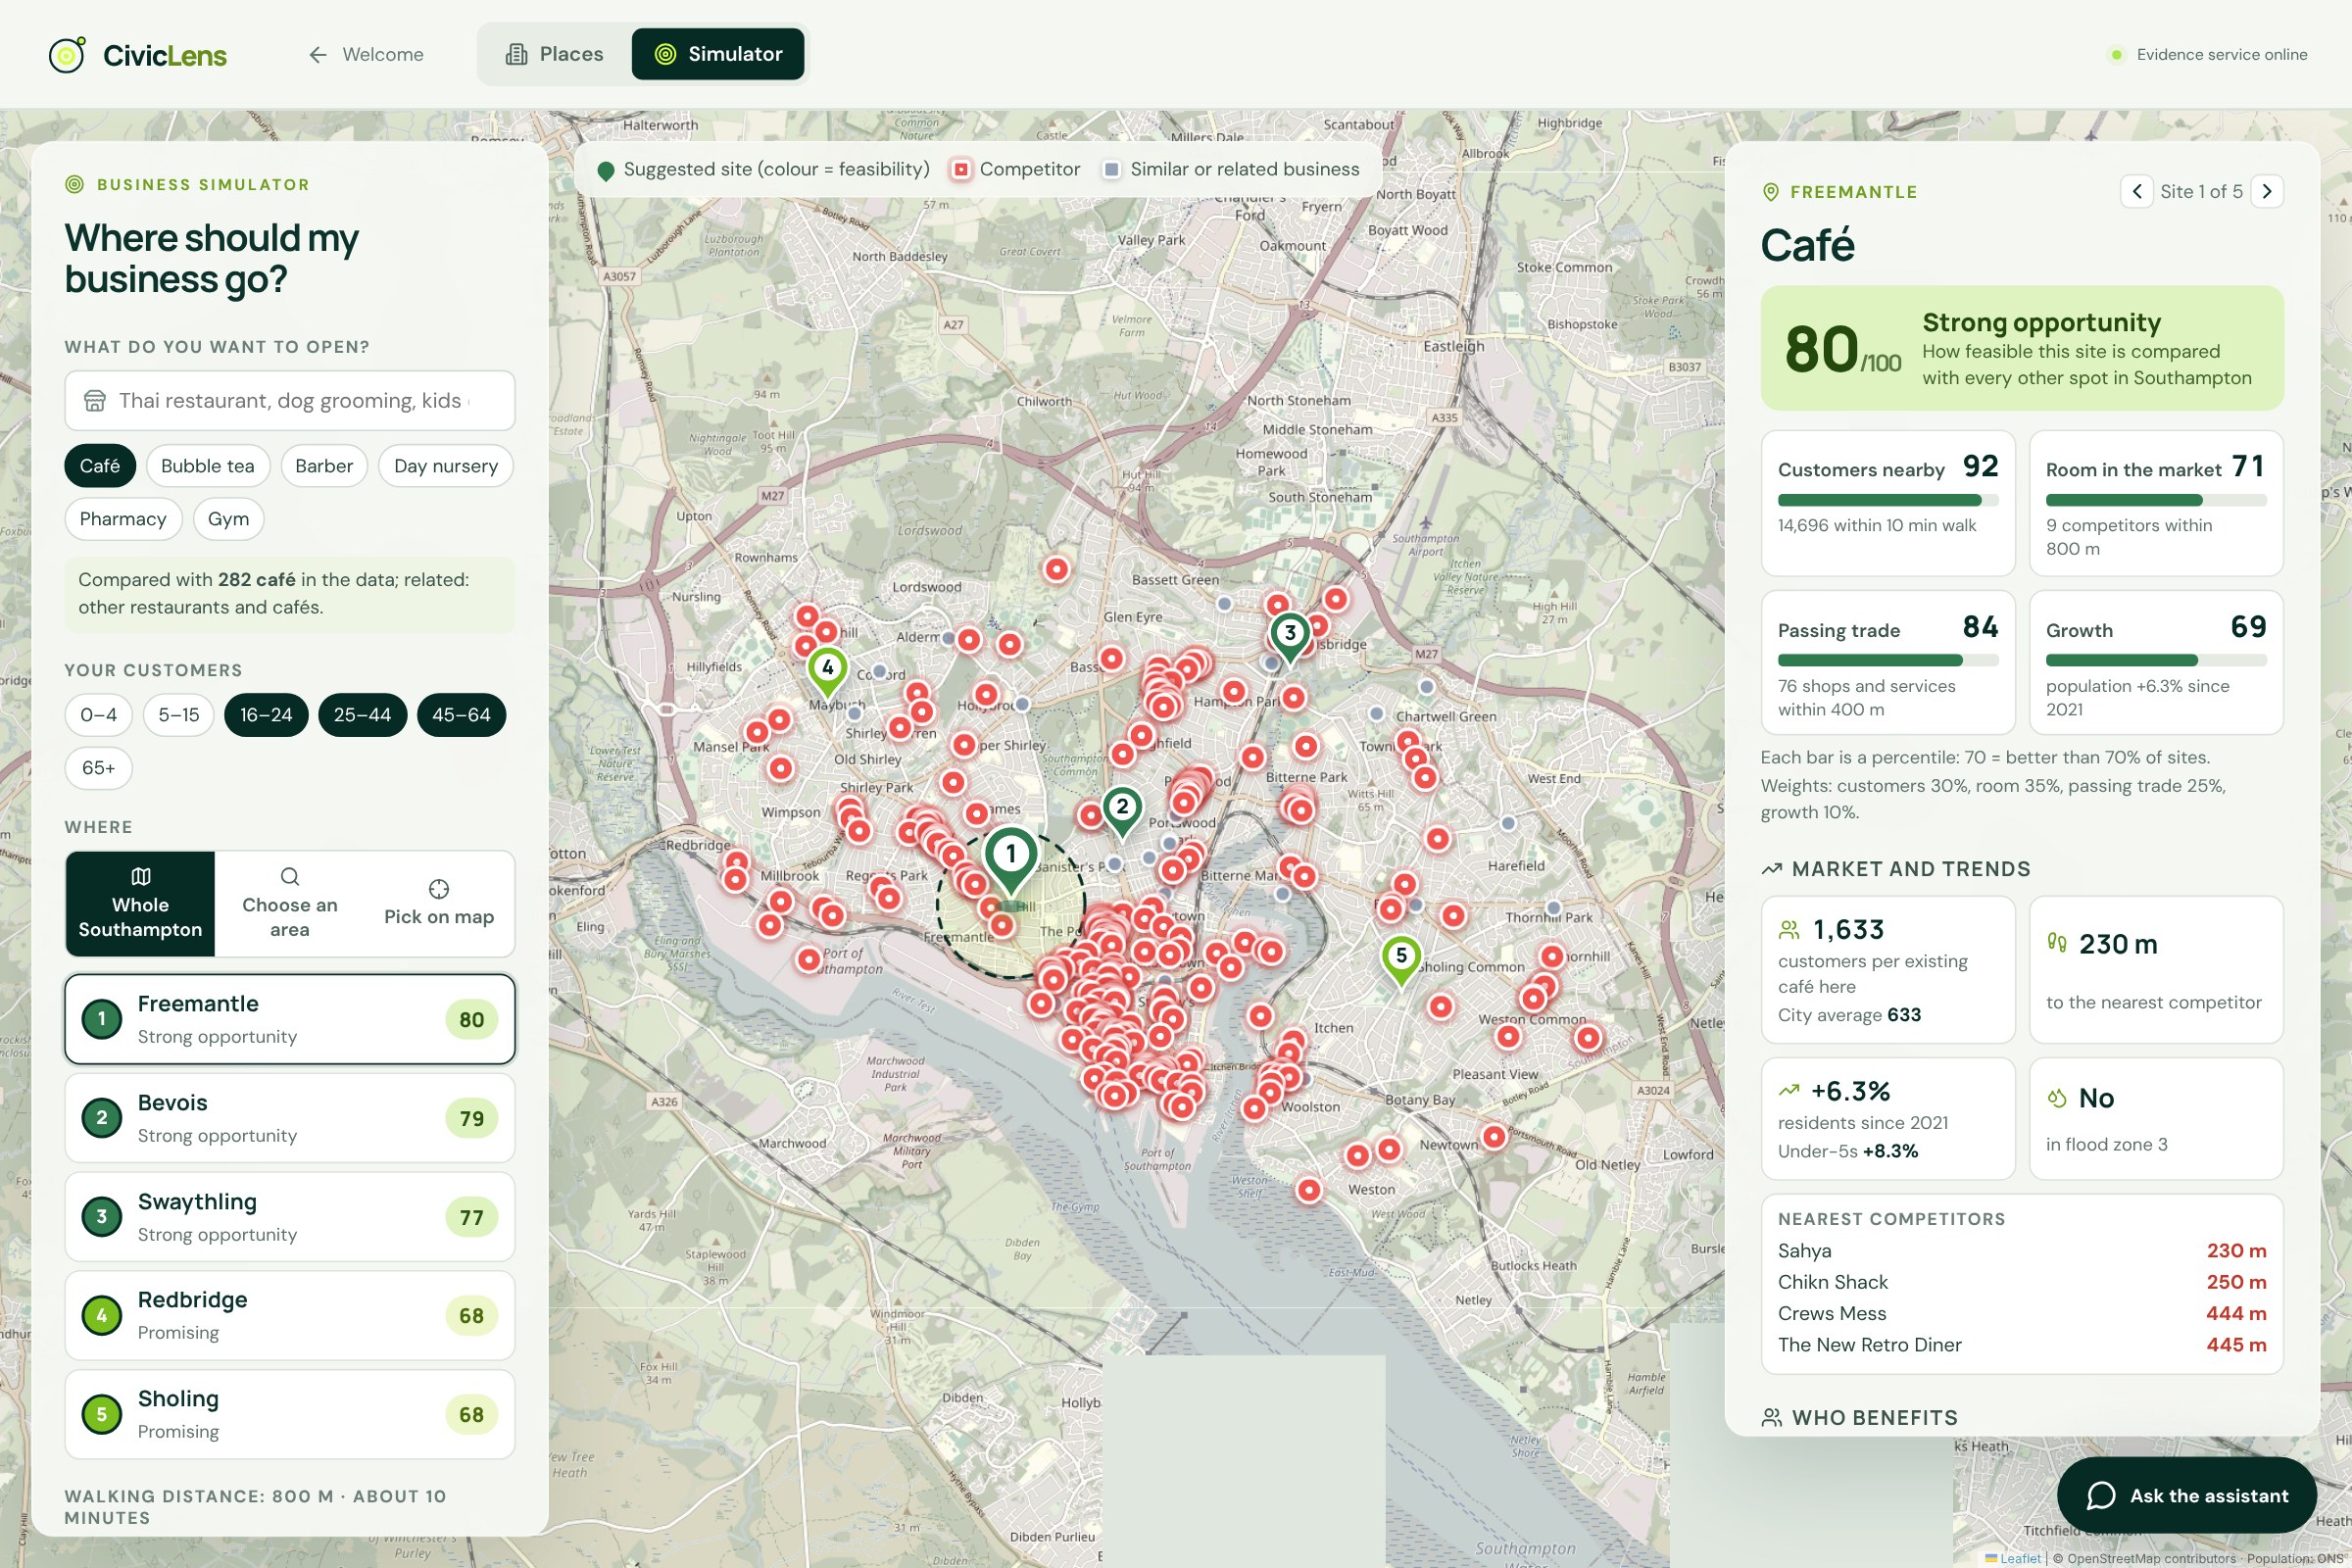
Site detail: a Korean BBQ site in Freemantle with its four factor scores: customers nearby, room in the market, passing trade, growth.
-
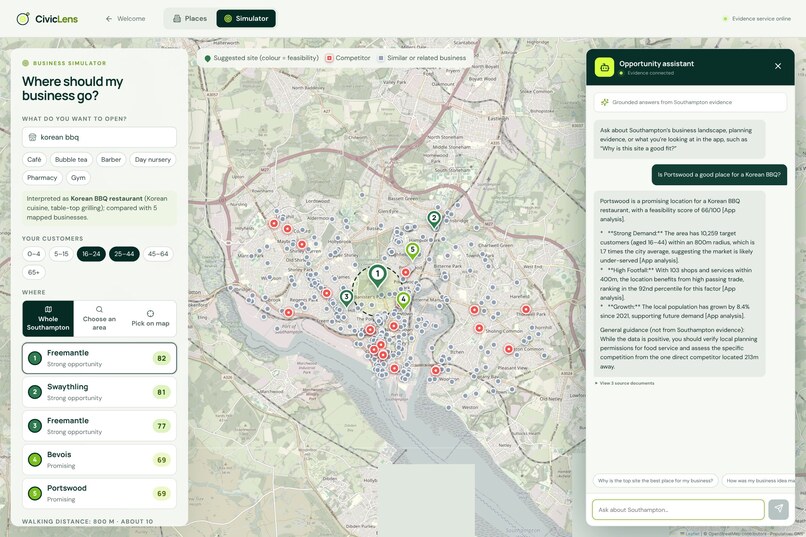
Ask the assistant: 'Is Portswood a good place for a Korean BBQ?' gets an answer grounded in evidence, tagged [App analysis].
-
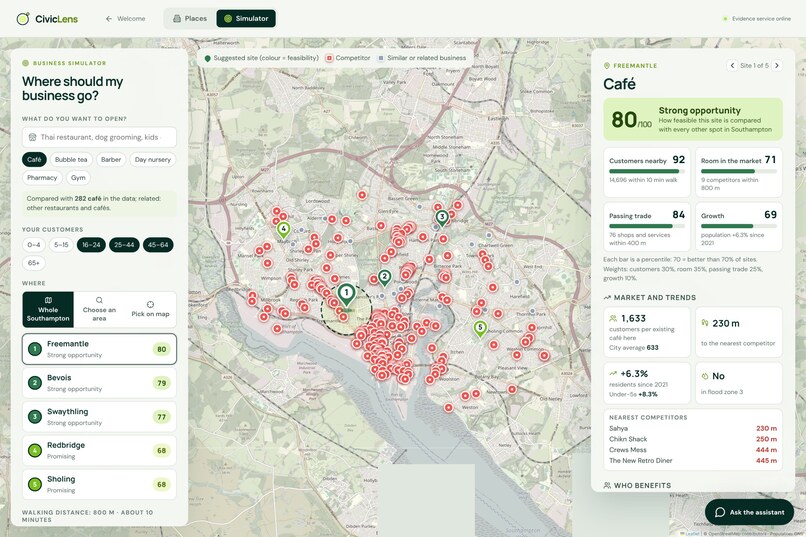
Crowded markets show up clearly: café scores 80/100 in Freemantle, with 9 competitors within 400 m and the nearest 230 m away.

Inspiration
Who decides where a new business goes in Southampton? Usually one person, with a spreadsheet, a few walks round the area and a gut feeling.
That matters here. The council's own Economic Assessment (Aug 2025) shows only 35.2% of new Southampton businesses survive three years, against 52.8% across England. Start-ups fell 29.5% in 2023, and retail lost 155 businesses in a single year. A poor location is one of the few causes of failure you can check before signing a lease.
The data to check it already exists, and it's open: who lives where (ONS), every food business (Food Standards Agency), shops and amenities (OpenStreetMap), GPs and pharmacies (NHS). But it sits in five places, in formats only an analyst can join. A retail chain pays consultants for that analysis. We wanted anyone with an idea to get it free, in under a minute.
What it does
You type a business idea in your own words, such as "korean bbq", "dog grooming" or "a little sushi bar for students". CivicLens:
- Understands the idea. An LLM maps it onto the 83 business types that actually exist in the city's data: its like-for-like competitors, similar businesses (other cuisines), target customers by age and how much it relies on passing trade.
- Scores every street. It ranks all 792 small areas of Southampton on customers nearby, room in the market, passing trade and population growth, using 3,718 real places.
- Explains with evidence. It shows the best five sites with a plain-English feasibility brief. An assistant answers follow-ups such as "what about Portswood?" and links every citation to the page of the council's report it came from.
How we built it
Our rule: the AI reads and explains; tested code does every number.
- Classifier: Qwen3.8 27B on Groq returns JSON. The server then enforces the rules: only real types survive, like-for-like is capped at the closest niche, and vague words like food or shop are dropped.
- Site model: a deterministic scorer in the browser. "Room in the market" is a supply-to-demand ratio, borrowed from the two-step floating catchment method (Luo & Wang, 2003). Nearer people and competitors count more, as in Huff's (1964) trade-area model:
$$ g(d) = 1 - 0.5\frac{d}{R} $$
$$ D(s) = \underset{j}{\sum} \text{residents}(j) \cdot g(d(s,j)) $$
$$ C(s) = 2\underset{\text{like}}{\sum} g + 0.6\underset{\text{similar}}{\sum} g + 0.3\underset{\text{related}}{\sum} g $$
$$ \text{Room}(s) = \frac{D(s)}{1 + C(s)} $$
Each factor becomes a percentile against all 792 sites, with a 15-point penalty in Flood Zone 3.
- Assistant: BM25 keyword search over Southampton's documents, then a grounded prompt. It may cite only retrieved passages or
[App analysis]. Common questions are answered by fixed templates with no LLM call, so the same screen always gives the same answer. - Stack: React 19 + Vite + Leaflet, FastAPI, Python data pipelines, deployed as one service on Render.
Challenges we ran into
- Keyword matching is badly wrong. Without AI, sushi bar became a hairdresser, curry house a hotel and pho place a mobile phone shop. On 22 hand-labelled ideas, keywords got 9/22 right and the LLM got 21/22.
- LLMs copy and contradict. The model sometimes pasted whole prompt lines back as answers, or picked the right types under the wrong sector label. Server-side validation fixed both.
- A production bug on demo day. Every AI call on the live site failed because Cloudflare blocked Python's default User-Agent. The page kept working on keyword fallback, which was exactly why we built the fallback. A one-line header fixed it.
- Joining messy open data. The hygiene register and OpenStreetMap disagree on names, places and cuisines. We merged and de-duplicated them, inferred cuisines from names ("Phoenix Fish Bar" is not Vietnamese) and flagged places that may have closed.
- Being honest when there's no answer. For "kids coding club" the right output is "possible gap in the market, check on the ground", not invented competitors.
Accomplishments we're proud of
- Assistant: 15/16 answers correct, 0 citations to unretrieved sources, about 0.7 s per answer
- Against "pick the site with the fewest competitors", our pick differs in 6 of 10 cases and puts +9,195 more people within walking distance
- 57 tests, including one that injects a wrong number and checks it is caught
- No personal data, and every source is dated and openly licensed (OGL / ODbL)
What we learned
- Use AI where language is the hard part, and nowhere else. The most trustworthy feature is the one that never lets the model produce a number.
- A simple baseline is the best argument for AI. "Sushi bar → hairdresser" convinced people faster than any architecture diagram.
- Measure early: building the benchmark found three real bugs.
- A good failure message ("possible gap, go and check") is a feature.
What's next
- Network walking distance (the River Itchen and railways matter)
- Rents and vacant units, so a top site has somewhere to rent
- Sessions with real business owners and the council's business-support team
- Back-testing the scores against real openings and closures, then rolling out to other English councils (it's all national open data)
Built With
- bm25
- fastapi
- food-standards-agency
- groq
- javascript
- leaflet.js
- llm
- nhs
- numpy
- ons
- overpass-openstreetmap
- pandas
- pypdf
- pyproj
- pytest
- python
- qwen
- rag
- react
- react-leaflet
- remotion
- render
- shapely
- uvicorn
- vite

Log in or sign up for Devpost to join the conversation.