

Inspiration
Choosing where to live is one of the biggest decisions people make, and the information is scattered everywhere — one site for crime, another for schools, a third for air quality, a spreadsheet for cost of living. We wanted a single honest answer to "Should I move here?" — and one that changes depending on who is asking. A retiree and a college student can look at the same street and see two completely different places.
What it does
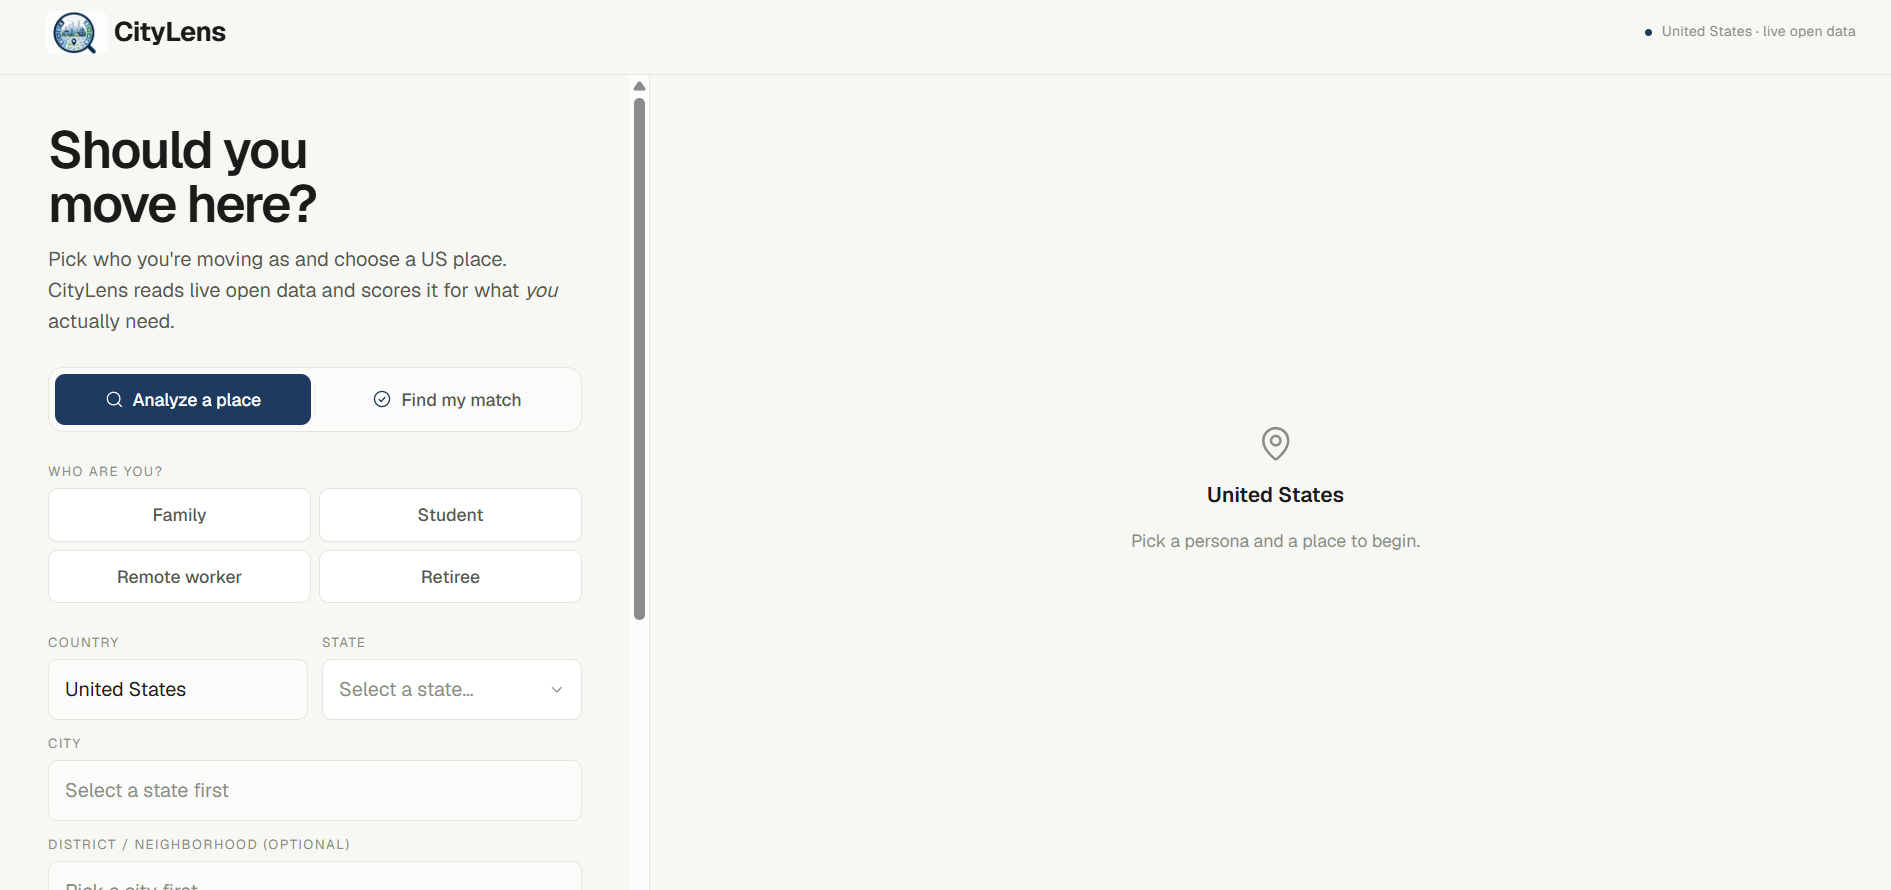
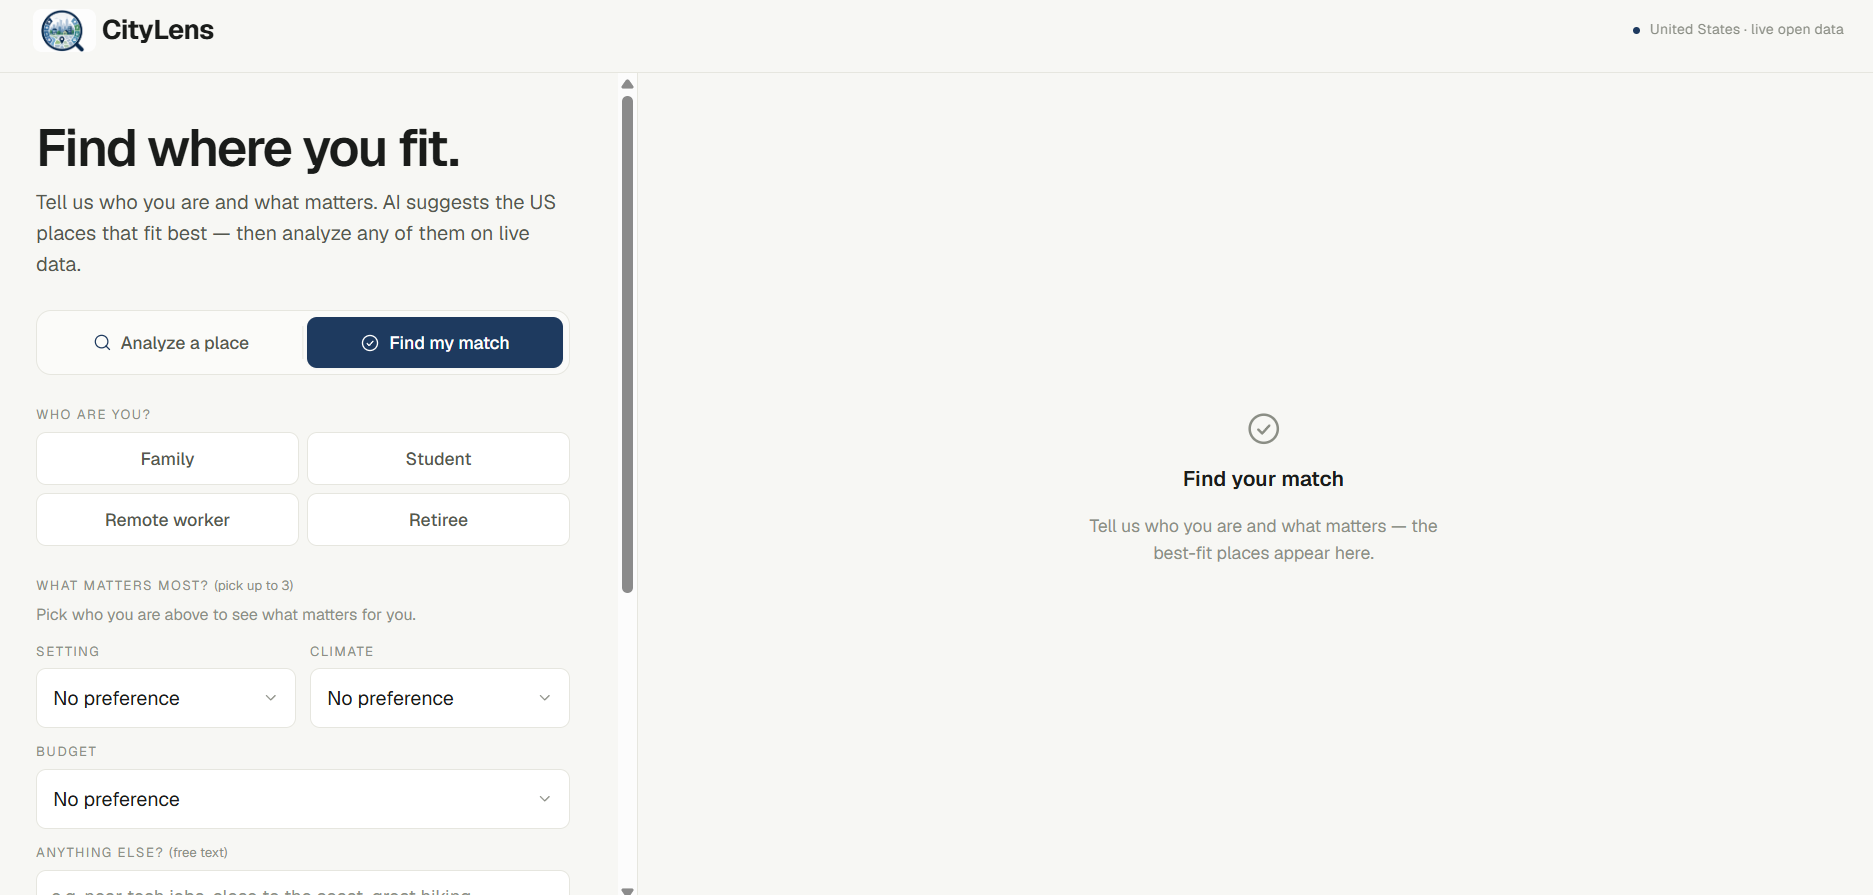
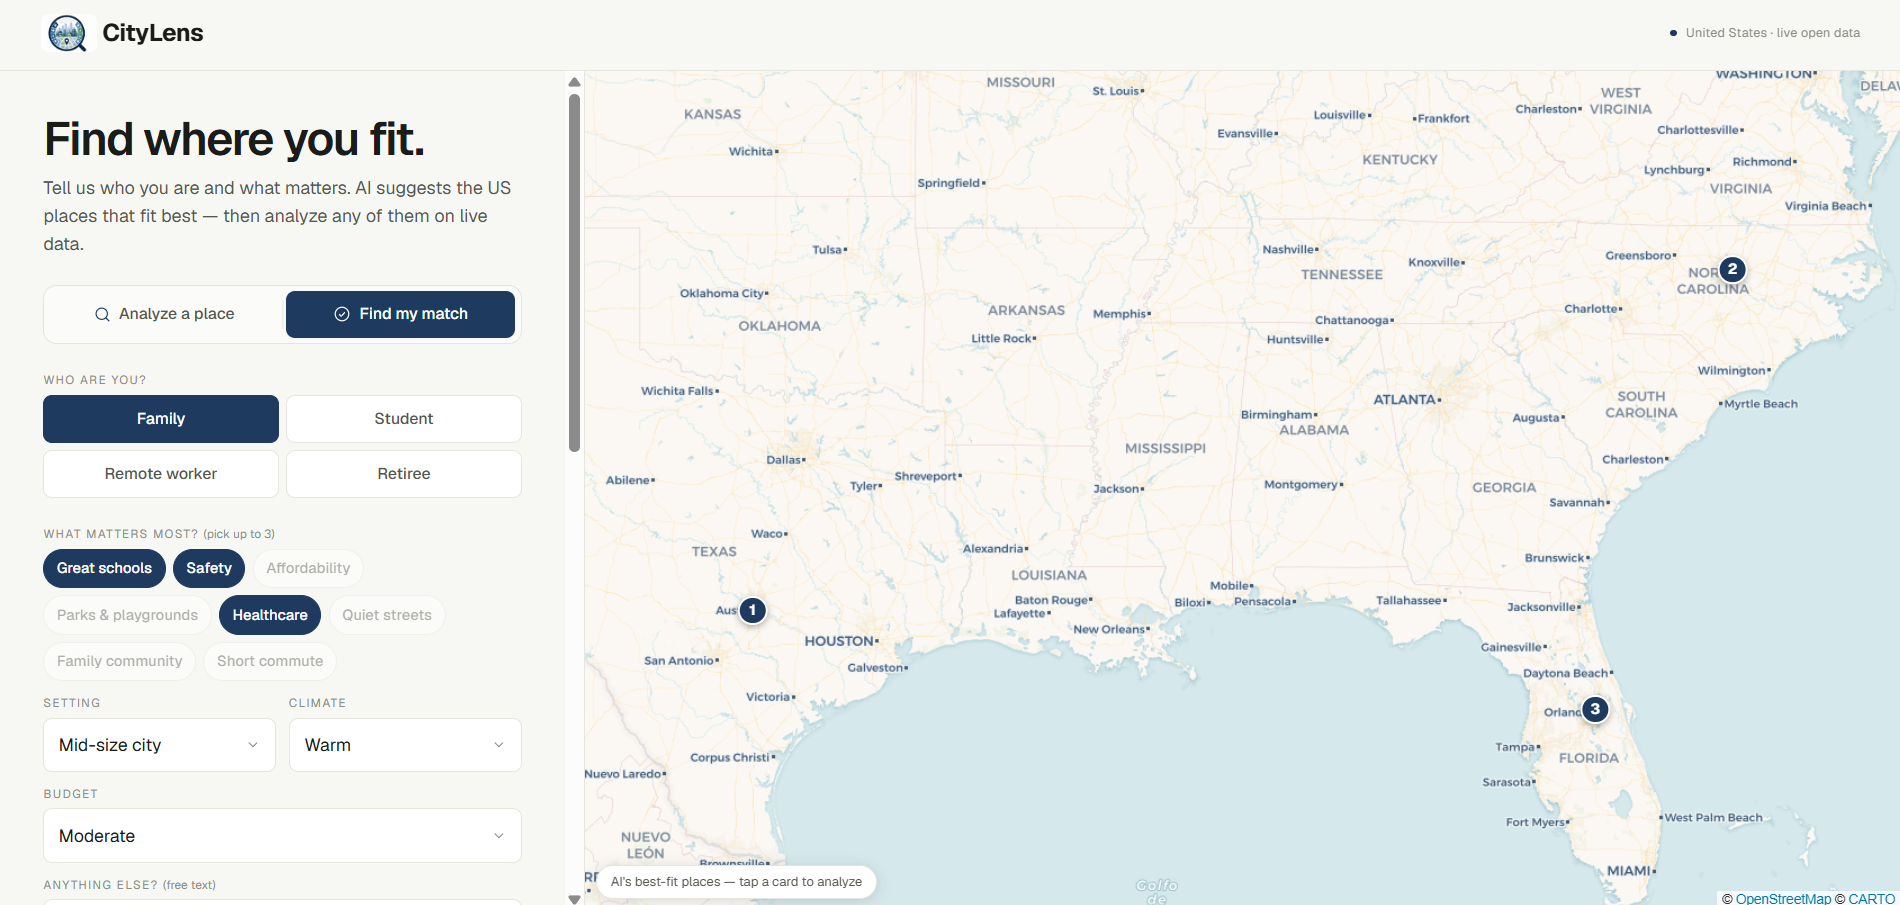
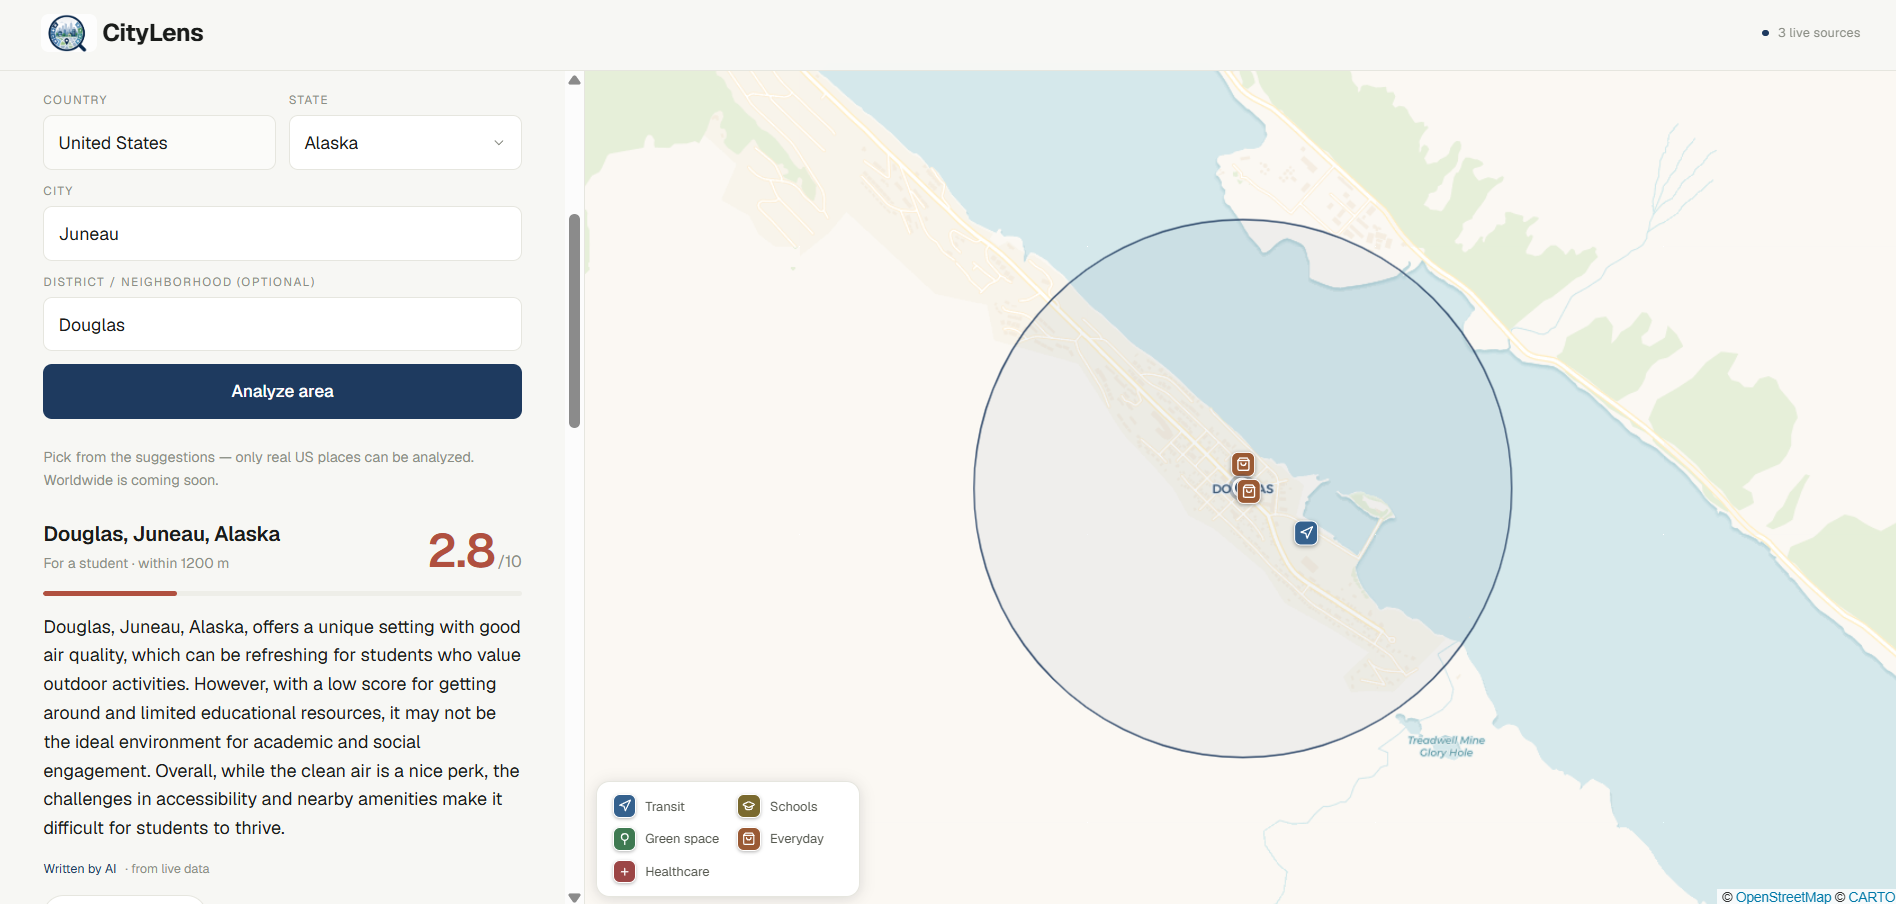
You pick who you're moving as — family, student, remote worker, or retiree — and choose a US state, city, and neighborhood. CityLens pulls live open data and scores the place on what matters to that person: safety, healthcare, cost of living, schools, air quality, getting around, everyday errands, green space, and quiet. It returns one 0–10 score, a plain-language verdict, and a breakdown of every criterion with the real numbers behind it. The criteria are personalized: a retiree never sees "schools"; a student never sees "healthcare".
How we built it
- Next.js + TypeScript, deployed on Vercel.
- Live neighborhood data from OpenStreetMap via the Overpass API — transit stops, schools, parks, clinics, shops, and nearby major roads/rail (a noise proxy). We race several Overpass mirrors so a slow one never blocks a search.
- Air quality from Open-Meteo (US AQI, PM2.5).
- Street-level crime from NYC Open Data (NYPD complaints).
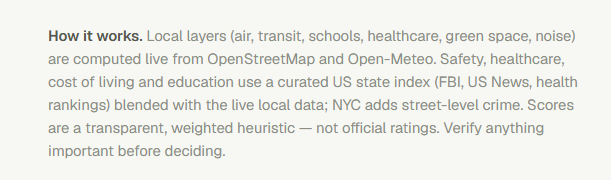
- Safety, healthcare, education, and cost of living at the state level from a curated index built on public rankings (FBI crime rates, US News, health- system rankings), blended with the live local data.
- Address entry uses Photon and Nominatim for typeahead, so users can only pick real US places.
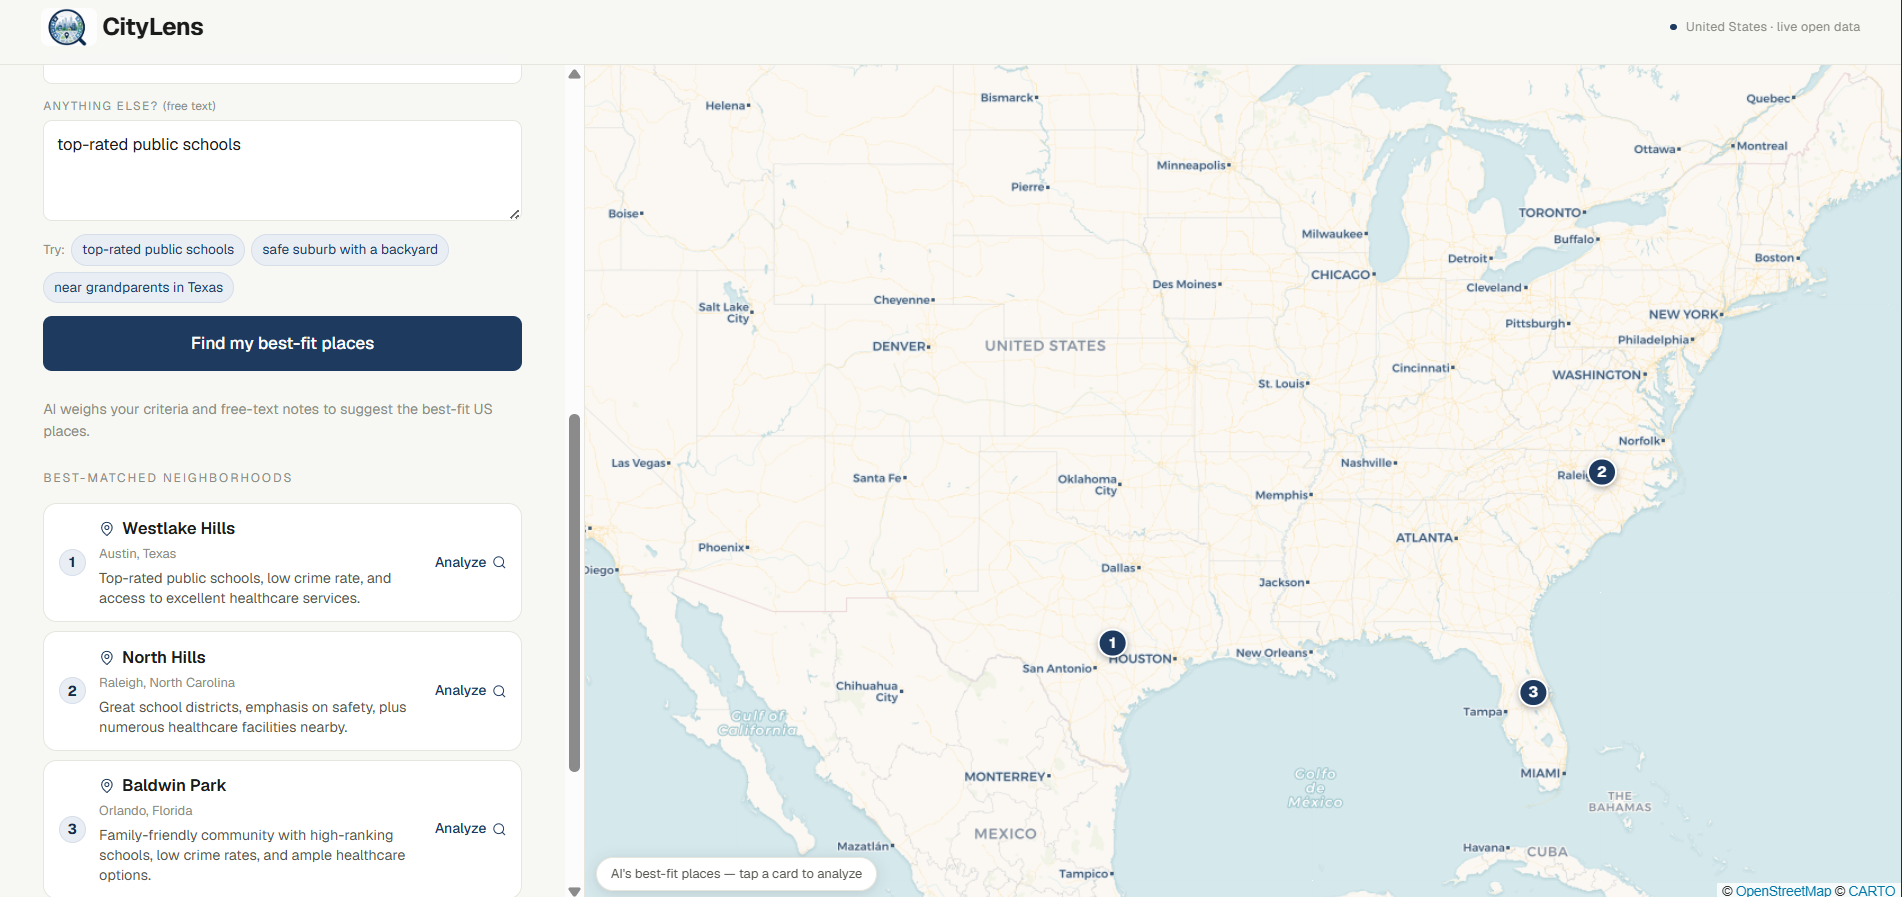
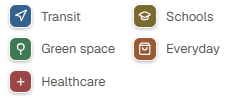
- A Leaflet map (CARTO tiles) shows what surrounds the address.
- The written verdict is generated by an LLM through OpenRouter, with a deterministic fallback so it always works.
Challenges we ran into
Inspiration
Choosing where to live is one of the biggest decisions people make, and the information is scattered everywhere — one site for crime, another for schools, a third for air quality, a spreadsheet for cost of living. We wanted a single honest answer to "Should I move here?" — and one that changes depending on who is asking. A retiree and a college student can look at the same street and see two completely different places.
What it does
You pick who you're moving as — family, student, remote worker, or retiree — and choose a US state, city, and neighborhood. CityLens pulls live open data and scores the place on what matters to that person: safety, healthcare, cost of living, schools, air quality, getting around, everyday errands, green space, and quiet. It returns one 0–10 score, a plain-language verdict, and a breakdown of every criterion with the real numbers behind it. The criteria are personalized: a retiree never sees "schools"; a student never sees "healthcare".
How we built it
- Next.js + TypeScript, deployed on Vercel.
- Live neighborhood data from OpenStreetMap via the Overpass API — transit stops, schools, parks, clinics, shops, and nearby major roads/rail (a noise proxy). We race several Overpass mirrors so a slow one never blocks a search.
- Air quality from Open-Meteo (US AQI, PM2.5).
- Street-level crime from NYC Open Data (NYPD complaints).
- Safety, healthcare, education, and cost of living at the state level from a curated index built on public rankings (FBI crime rates, US News, health- system rankings), blended with the live local data.
- Address entry uses Photon and Nominatim for typeahead, so users can only pick real US places.
- A Leaflet map (CARTO tiles) shows what surrounds the address.
- The written verdict is generated by an LLM through OpenRouter, with a deterministic fallback so it always works.
Challenges we ran into
- There is no free, nationwide, point-level crime API. Instead of faking it, we blend curated state-level safety with live local crime where it's open (NYC), and say so in the UI.
- Public Overpass mirrors are often slow or rate-limited, so we race them and cache results.
- Standard geocoders aren't built for typeahead ("Brook" wouldn't find "Brooklyn"). We switched to Photon, ranking cities by importance and neighborhoods by proximity to the chosen city.
- Keeping scores honest: everything is a transparent, weighted heuristic, and we label what is live vs. curated, and what isn't included yet.
Accomplishments that we're proud of
- It's a real, working product on live data — pick a persona and any US neighborhood and get a genuine, data-backed read, not a mockup.
- Personalized scoring that actually changes what you see: a retiree never gets scored on schools; a student never gets scored on healthcare.
- Honesty as a feature. Every number is traceable to a source, we label what's live vs. curated, and we say out loud what we don't cover yet — no fake "real-time" data.
- Typeahead that only lets you pick real US places, so the analysis is never run on a location that doesn't exist.
- A resilient data layer: we race multiple OpenStreetMap mirrors and degrade gracefully when a source is down, so a search still returns something useful.
- This was my very first hackathon, so honestly I'm proud just to have taken part — and even prouder to have shipped something real and working.
What we learned
- A huge amount of genuinely useful civic data is open — crime, air quality, transit, schools, health rankings — but it's scattered, inconsistent, and only valuable once it's stitched together and made readable.
- "One score for a neighborhood" is the wrong idea. The same street is a different place for a family, a student, and a retiree, so the scoring has to be personalized to be honest.
- Off-the-shelf geocoders aren't built for autocomplete, and picking the right data source (Photon for typeahead, Overpass for features, Open-Meteo for air) matters more than any single clever algorithm.
- Being upfront about the gaps builds more trust than pretending to have data you don't.
What's next for CityLens
- Worldwide coverage — the scoring model already works globally; it's the country-level data that needs to be filled in.
- Street-level crime for more cities beyond NYC, using other open police-data portals.
- Housing costs and commute-time layers, the two things people ask about most.
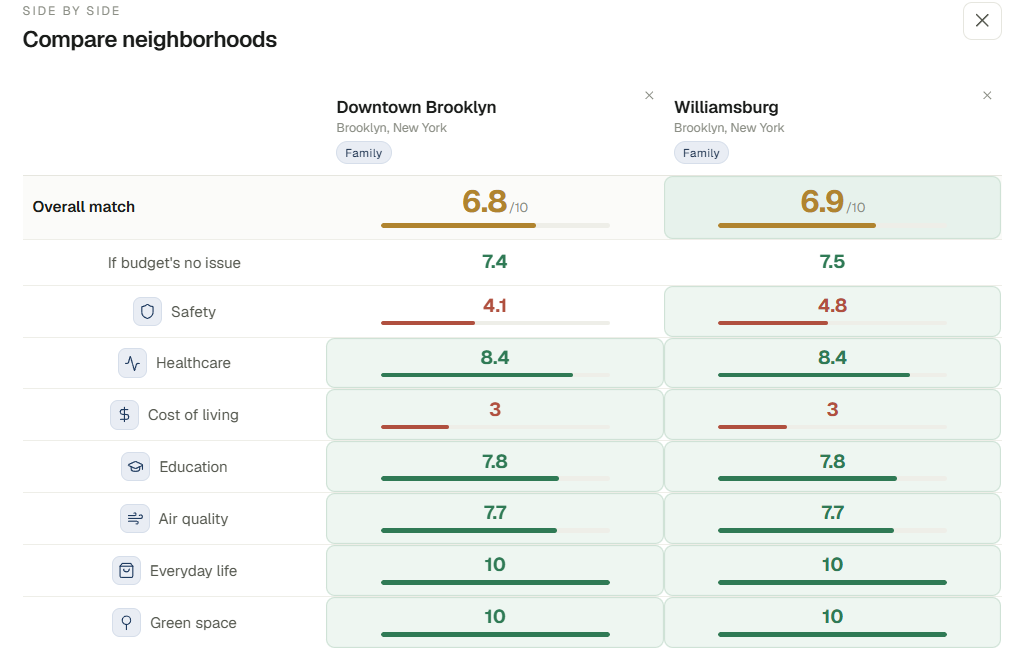
- Save and compare neighborhoods side by side, and share a result with a link.
Built With
- css
- leaflet.js
- next.js
- node.js
- nominatim
- nyc-open-data
- open-meteo
- openrouter
- openstreetmap
- overpass-api
- photon
- react
- typescript
- vercel


Log in or sign up for Devpost to join the conversation.