-
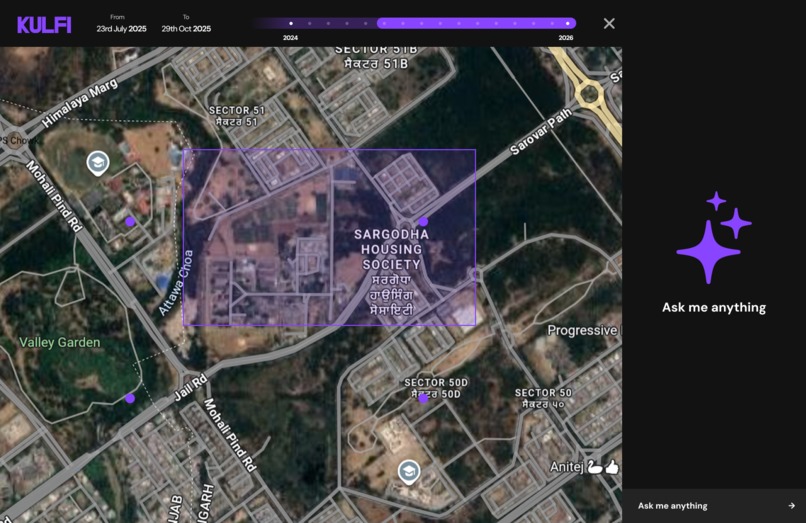
Landing Screen
Inspiration
We were inspired by the growing need for automated visual monitoring across industries. From cities struggling with road maintenance to Formula 1 teams analyzing subtle track changes, most inspections today remain manual, repetitive, and error-prone. Yet, modern cameras and online imagery capture the world in extraordinary detail over time, providing a powerful, underused source for visual analytics.
We realized that street-level time-series imagery like Google Street View could serve as the perfect proof of concept: a globally available dataset showing real-world change across years. But the real vision goes far beyond Street View, towards a general-purpose AI engine capable of detecting, classifying, and explaining any visual difference over time.
Our Project
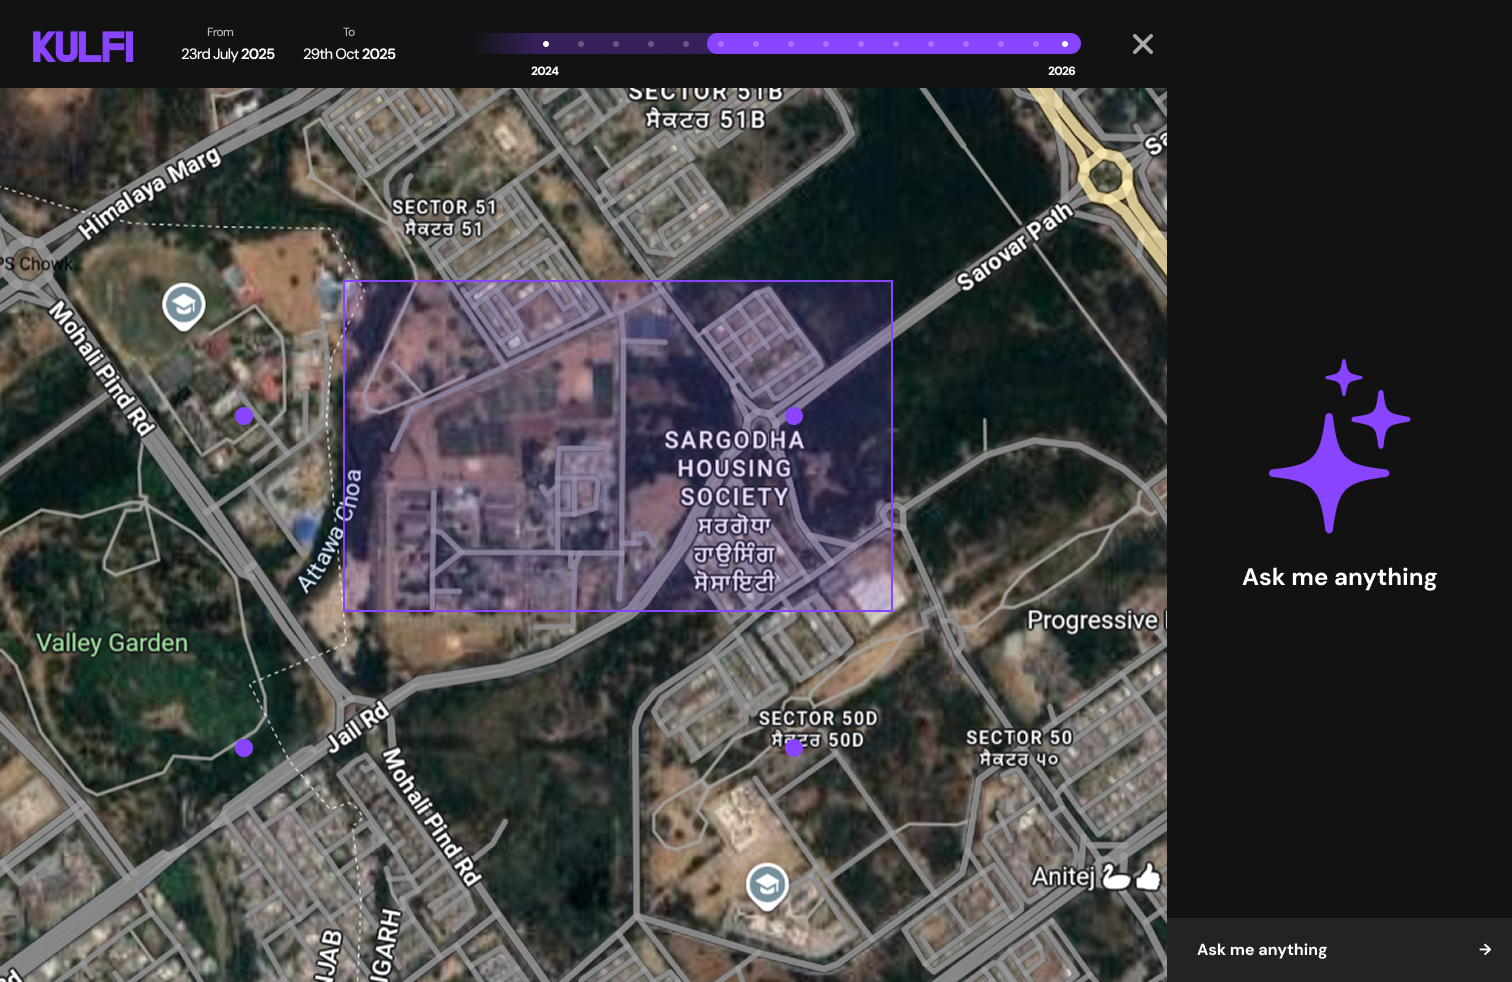
We aim to build an AI-powered visual difference engine that detects, highlights, and explains changes in time-series imagery. Users can explore a map, select a location, and instantly visualize how the scene has evolved over time, from repaired roads and new trees to large-scale construction.
The system will automatically identify these changes and present them side-by-side, with an interactive multimodal chat assistant (powered by Gemini 2.5 Pro) that interprets the differences. Users can ask natural-language questions like "When was this road repaved?" or "How many new structures appeared between 2015 and 2025?" and receive context-grounded, image-based insights.
By combining computer vision with LLM reasoning, we aim to transform raw visual change detection into actionable understanding, enabling use cases across urban monitoring, infrastructure maintenance, and motorsport track analysis, all within a single intuitive interface.
How We'll Build It
Backend API: Built with Python (FastAPI) for high-performance REST endpoints serving image-processing and LLM logic.
Image Processing & ML: Use OpenCV for alignment, differencing, and feature extraction. For advanced detection, leverage PyTorch (Siamese or change-detection CNNs) to identify subtle differences while filtering noise.
Data Source: Integrate the Google Street View API to fetch timestamped street-level images for proof of concept. These form the time-series base for change detection.
Frontend UI: A React + TypeScript web app featuring an interactive map (via Leaflet or deck.gl) where users can click locations to view "before vs. after" panoramas with overlaid highlights or heatmaps.
LLM Integration: Use Gemini 2.5 Pro via Vertex AI for the chat assistant. The LLM will interpret detected changes and explain them in natural language using annotated images as context.
Hosting & Infrastructure: Deploy with Render (backend) and Vercel (frontend). Use PostgreSQL (via Supabase or Neon) for structured metadata, user data, and cached results.
Challenges
Image Variability: Handling variations in angle, lighting, and occlusions is hard. Strong preprocessing (feature matching, normalization) will be needed to reduce false positives.
Change Sensitivity: Detecting small, meaningful changes (potholes, cracks) without flagging noise (shadows, cars) requires threshold tuning and possibly temporal smoothing.
Data Volume & Quotas: Street View data is vast; efficient caching and rate-limit management will be essential to stay performant and cost-effective.
LLM Grounding: Ensuring Gemini's responses stay factual to the images requires structured prompting and visual grounding.
Integration Complexity: Managing multiple async systems (frontend, backend, LLM, database) while keeping latency low is a non-trivial engineering challenge.
Accomplishments We're Aiming For
Accurate Change Detection: A reliable, explainable engine that visually pinpoints real-world differences while ignoring noise.
Explainable Visual Outputs: Clear heatmaps or annotations marking change regions.
Natural Language Insights: Users can query the system in plain English with accurate visual-grounded answers.
Scalable Live Demo: A working web portal showcasing Street View-based change detection at global scale.
Domain Extension: Apply the same engine to F1 track analysis or construction monitoring, highlighting its cross-domain potential.
What We'll Learn
- Integrating computer vision and language models into a cohesive multimodal pipeline.
- Preprocessing and aligning time-series imagery for robust change detection.
- Building interactive geo-visual UIs with React and map libraries.
- End-to-end cloud deployment with Render, Vercel, and Vertex AI.
- Applying prompt engineering for grounded, multimodal LLM reasoning.
Next Steps
After the hackathon:
- Expand to additional data sources (satellite, drone feeds).
- Improve classification (construction, vegetation, weather damage).
- Add real-time alerts for maintenance and monitoring.
- Enhance UX with richer 3D or AR-based map visualizations.
- Create a universal AI visual difference engine for diverse industries.
Built With
- deckgl
- fastapi
- gemini
- google-streetview
- langchain
- langgraph
- machine-learning
- neon
- next
- opencv
- pip
- postgresql
- python
- pytorch
- qgis
- react
- supabase
- tsx
- typescript
- uv

Log in or sign up for Devpost to join the conversation.