-
-
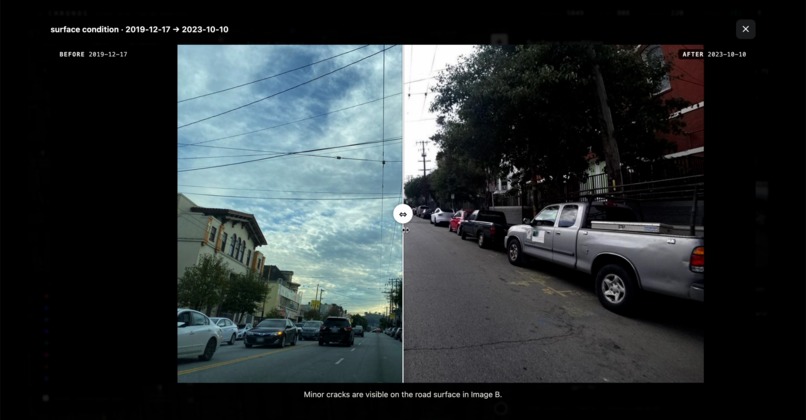
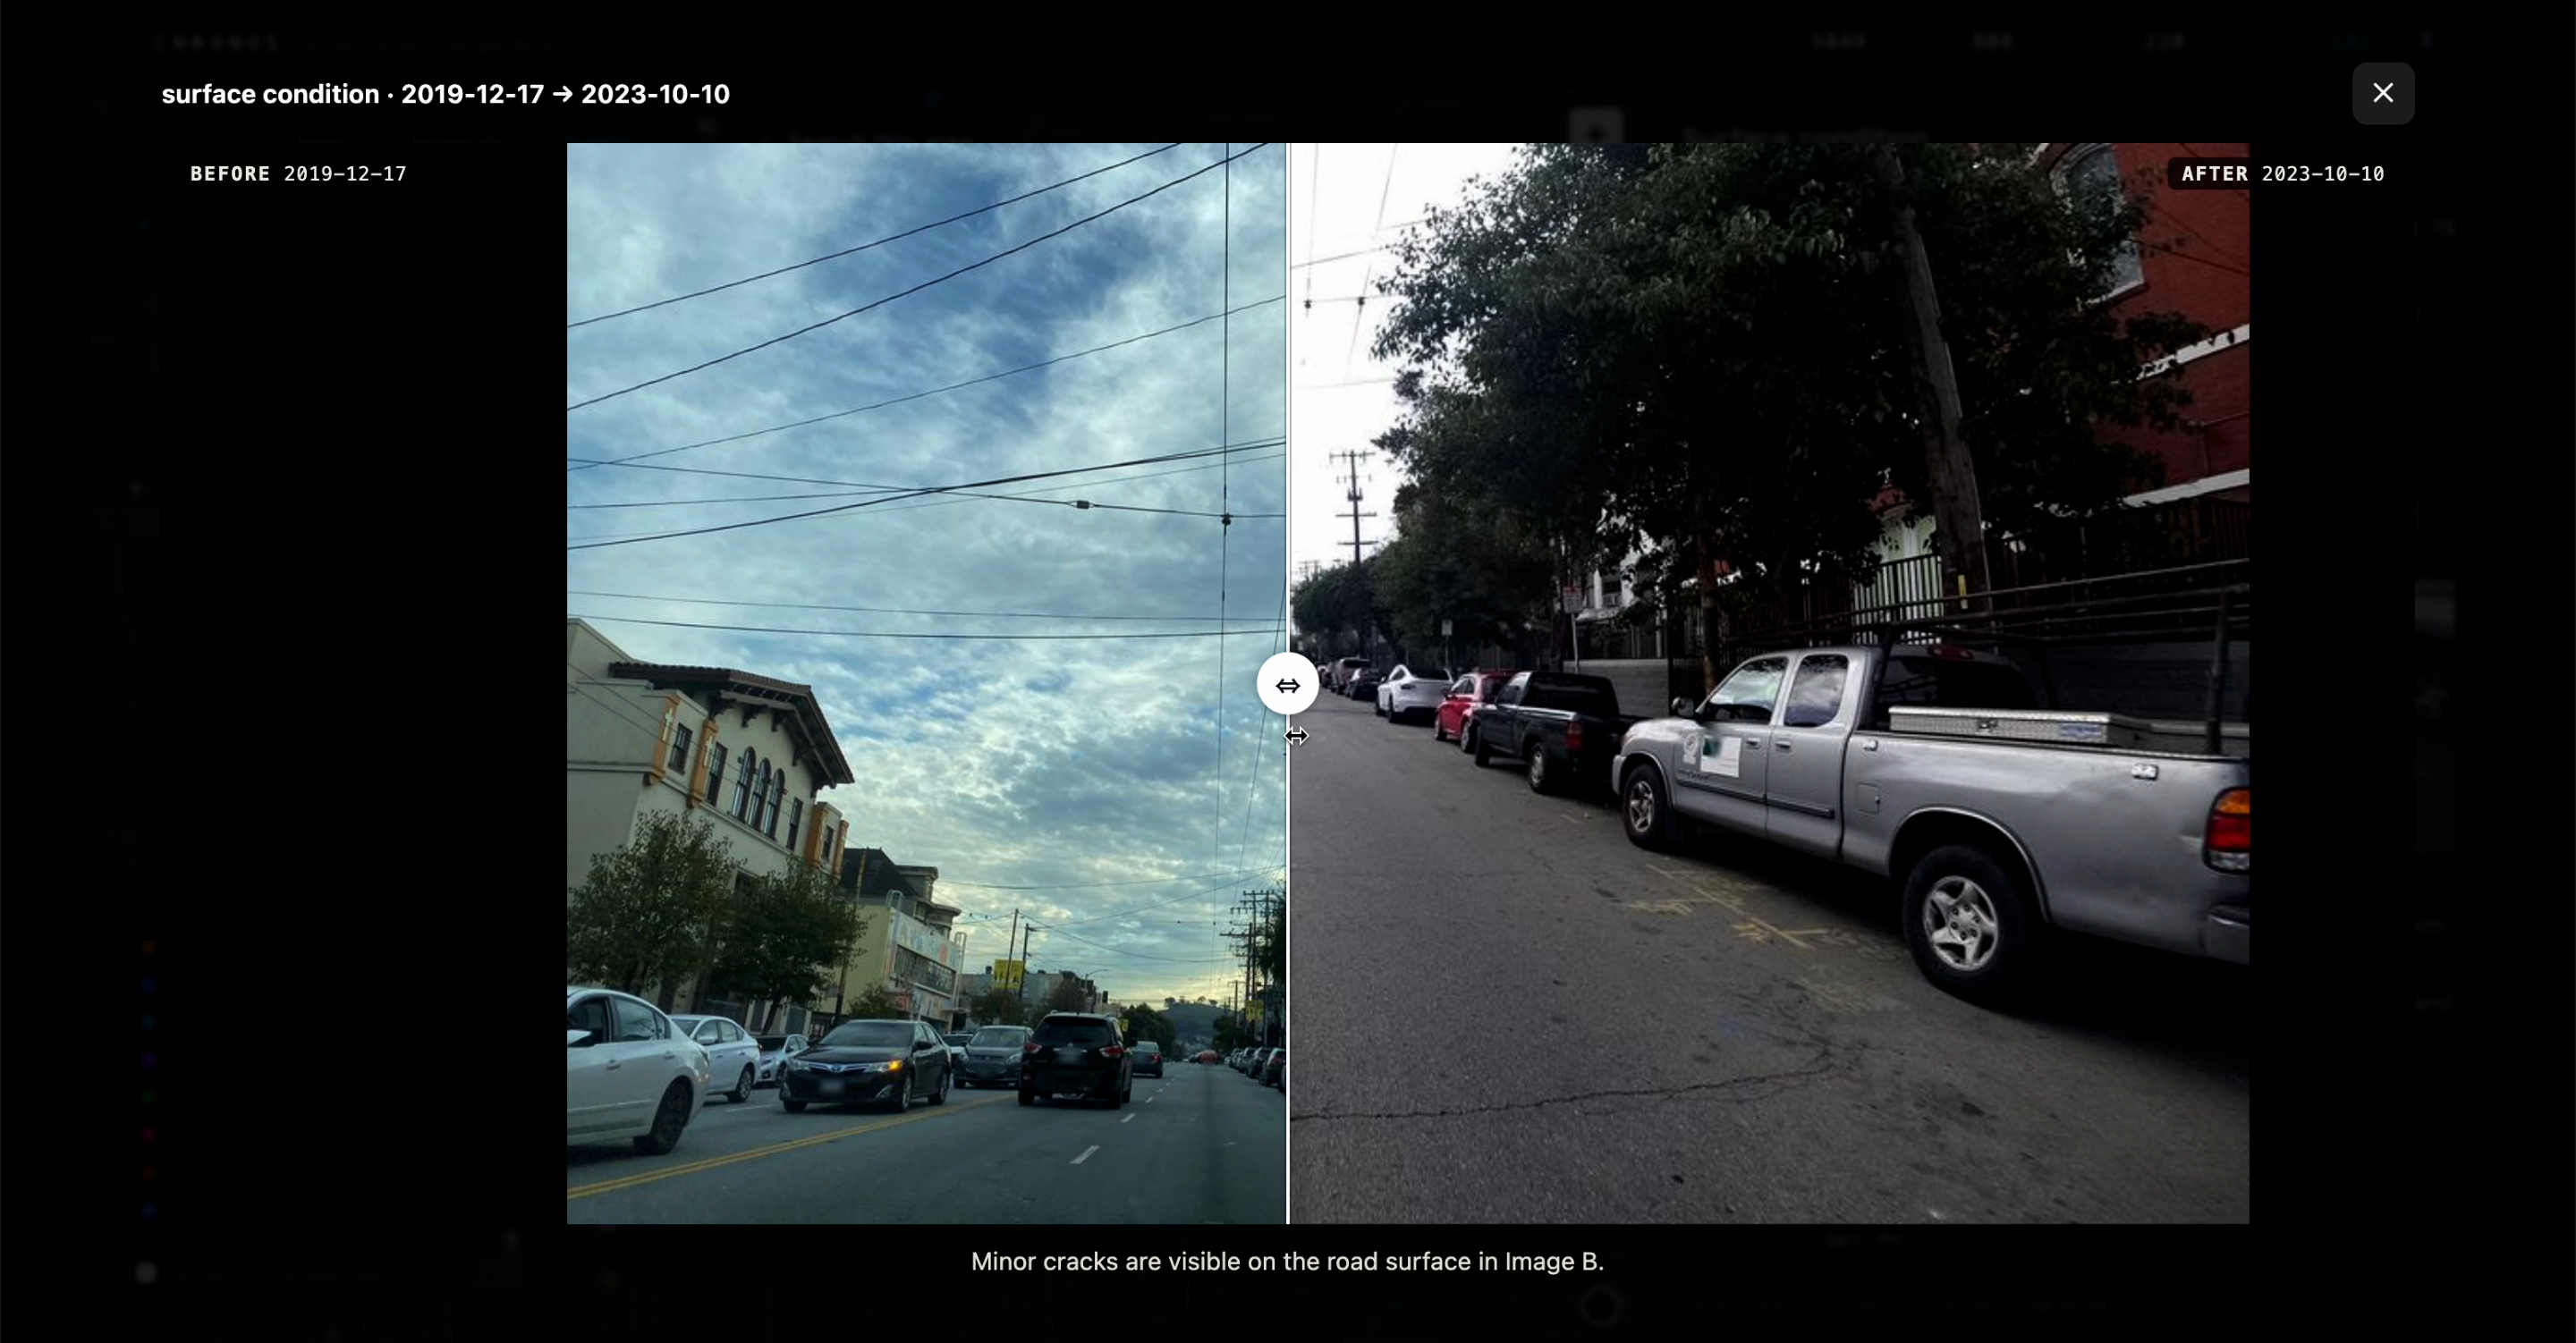
Spotting the Diff
-
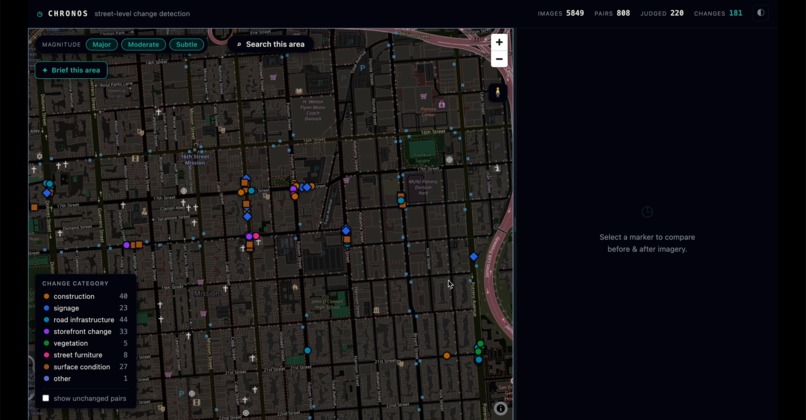
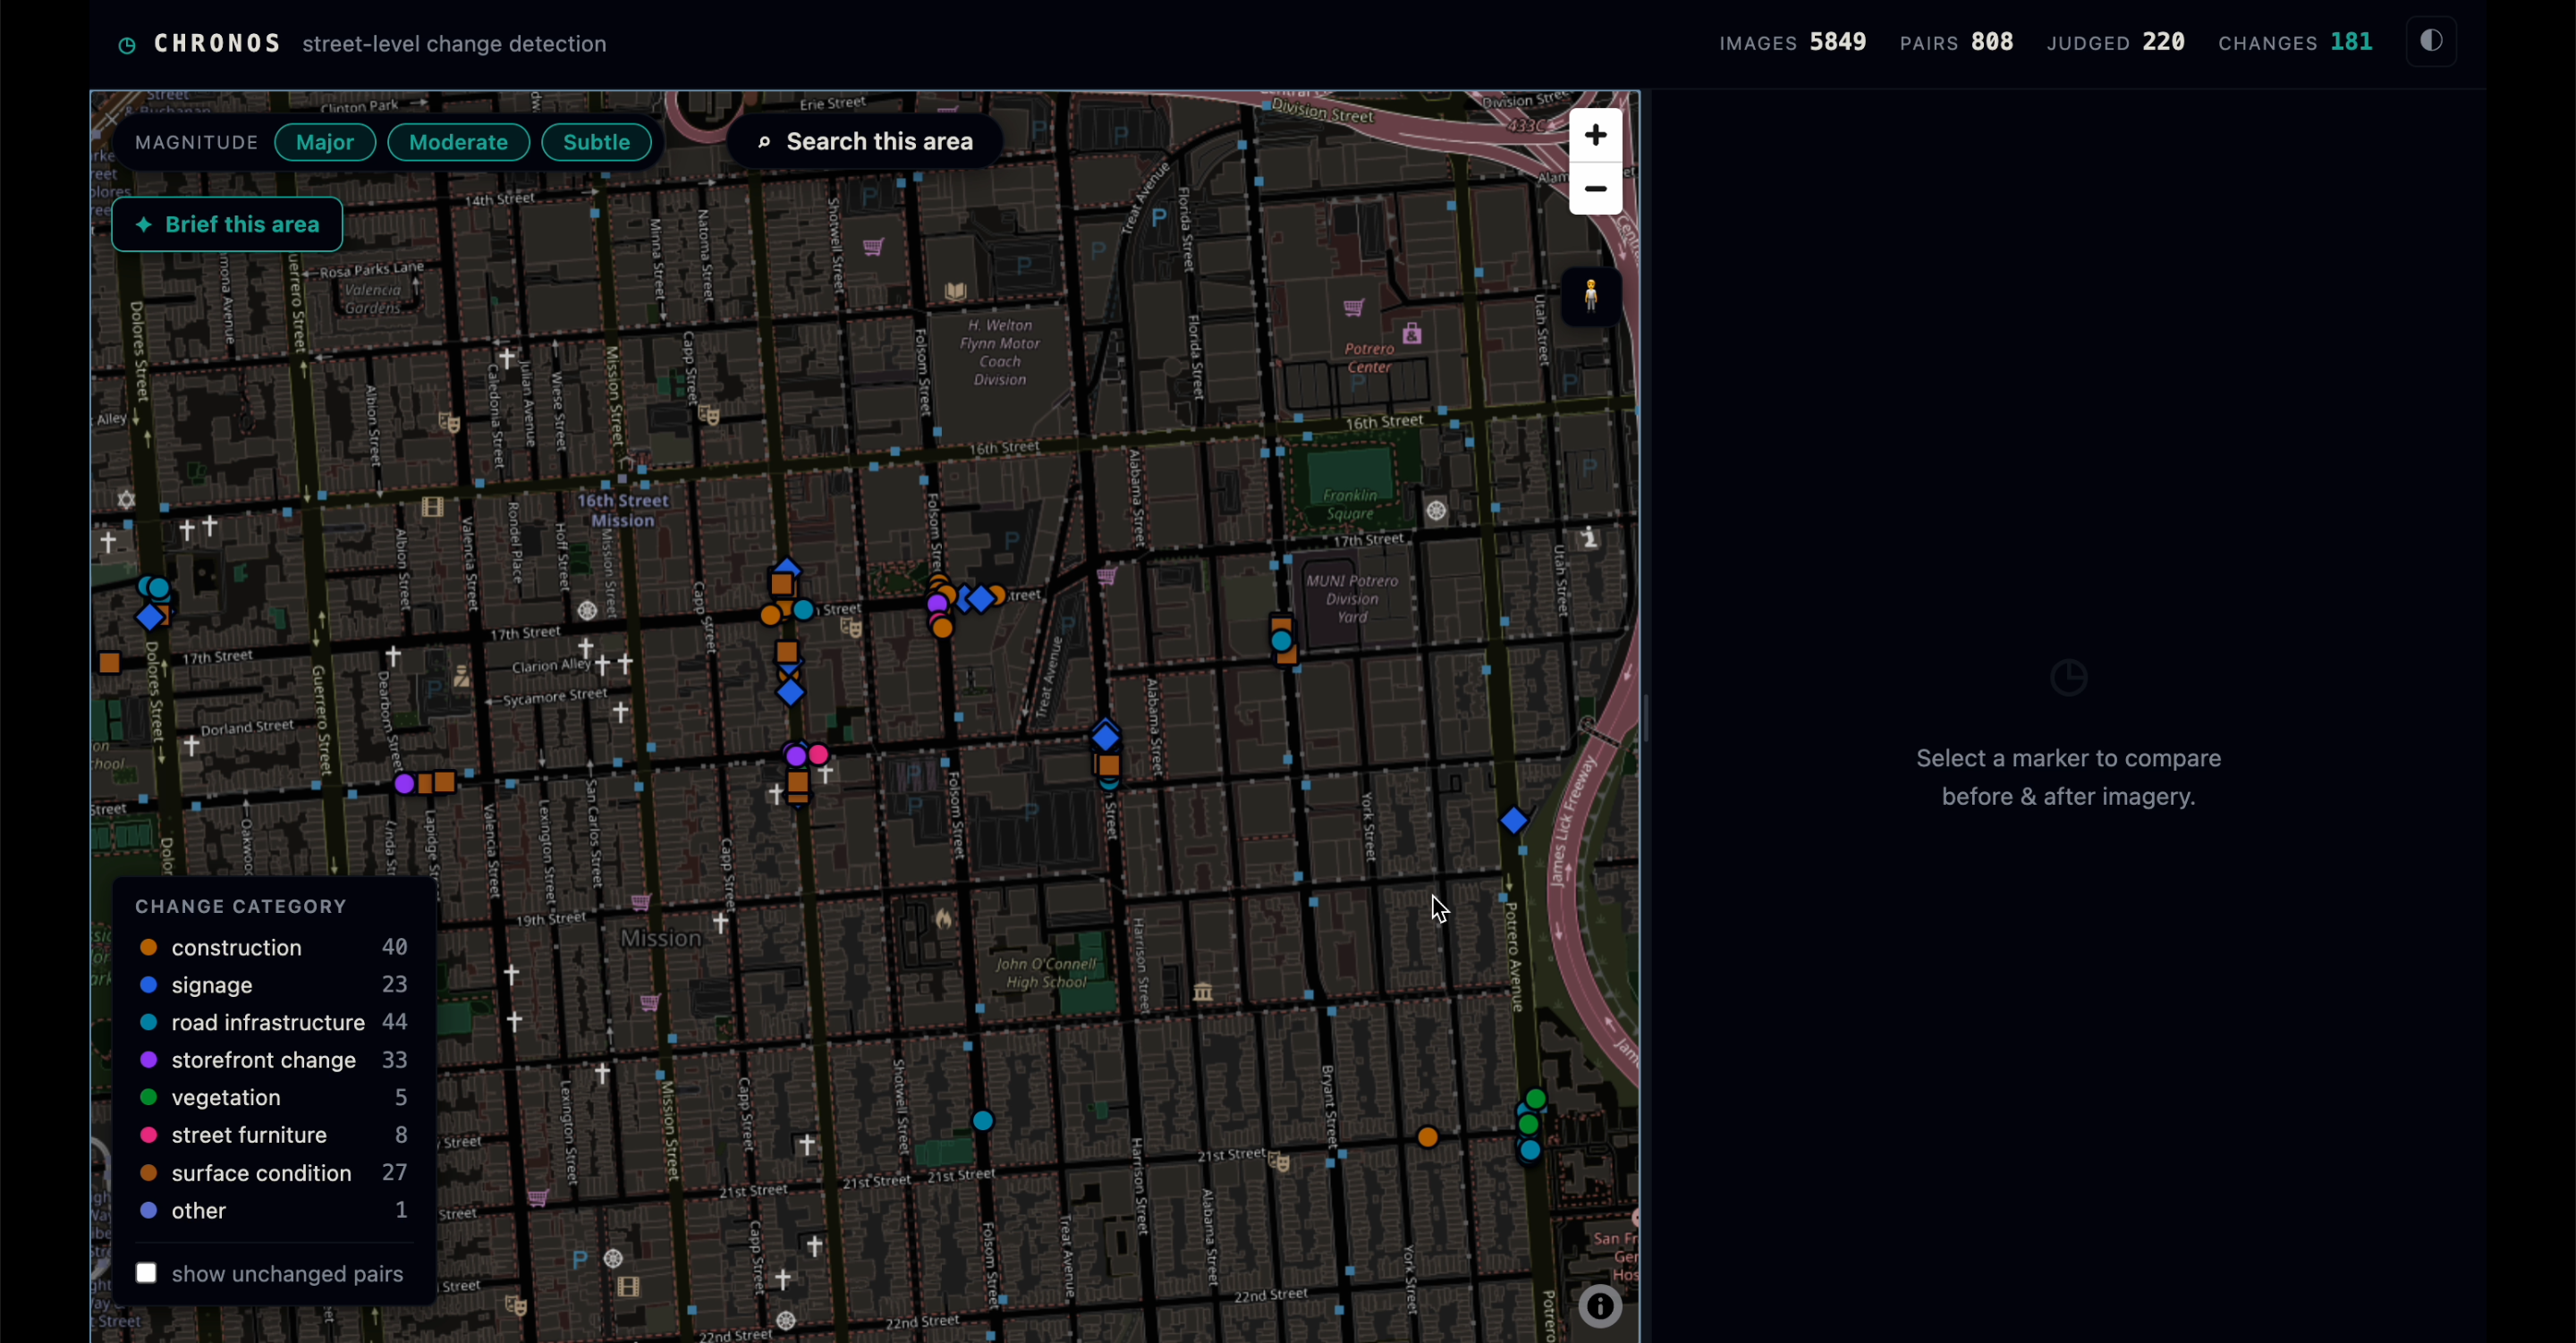
This is our starting screen with us being in Mission
-
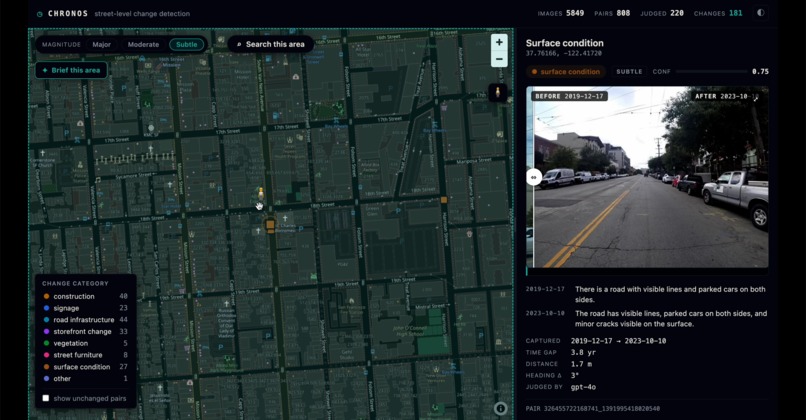
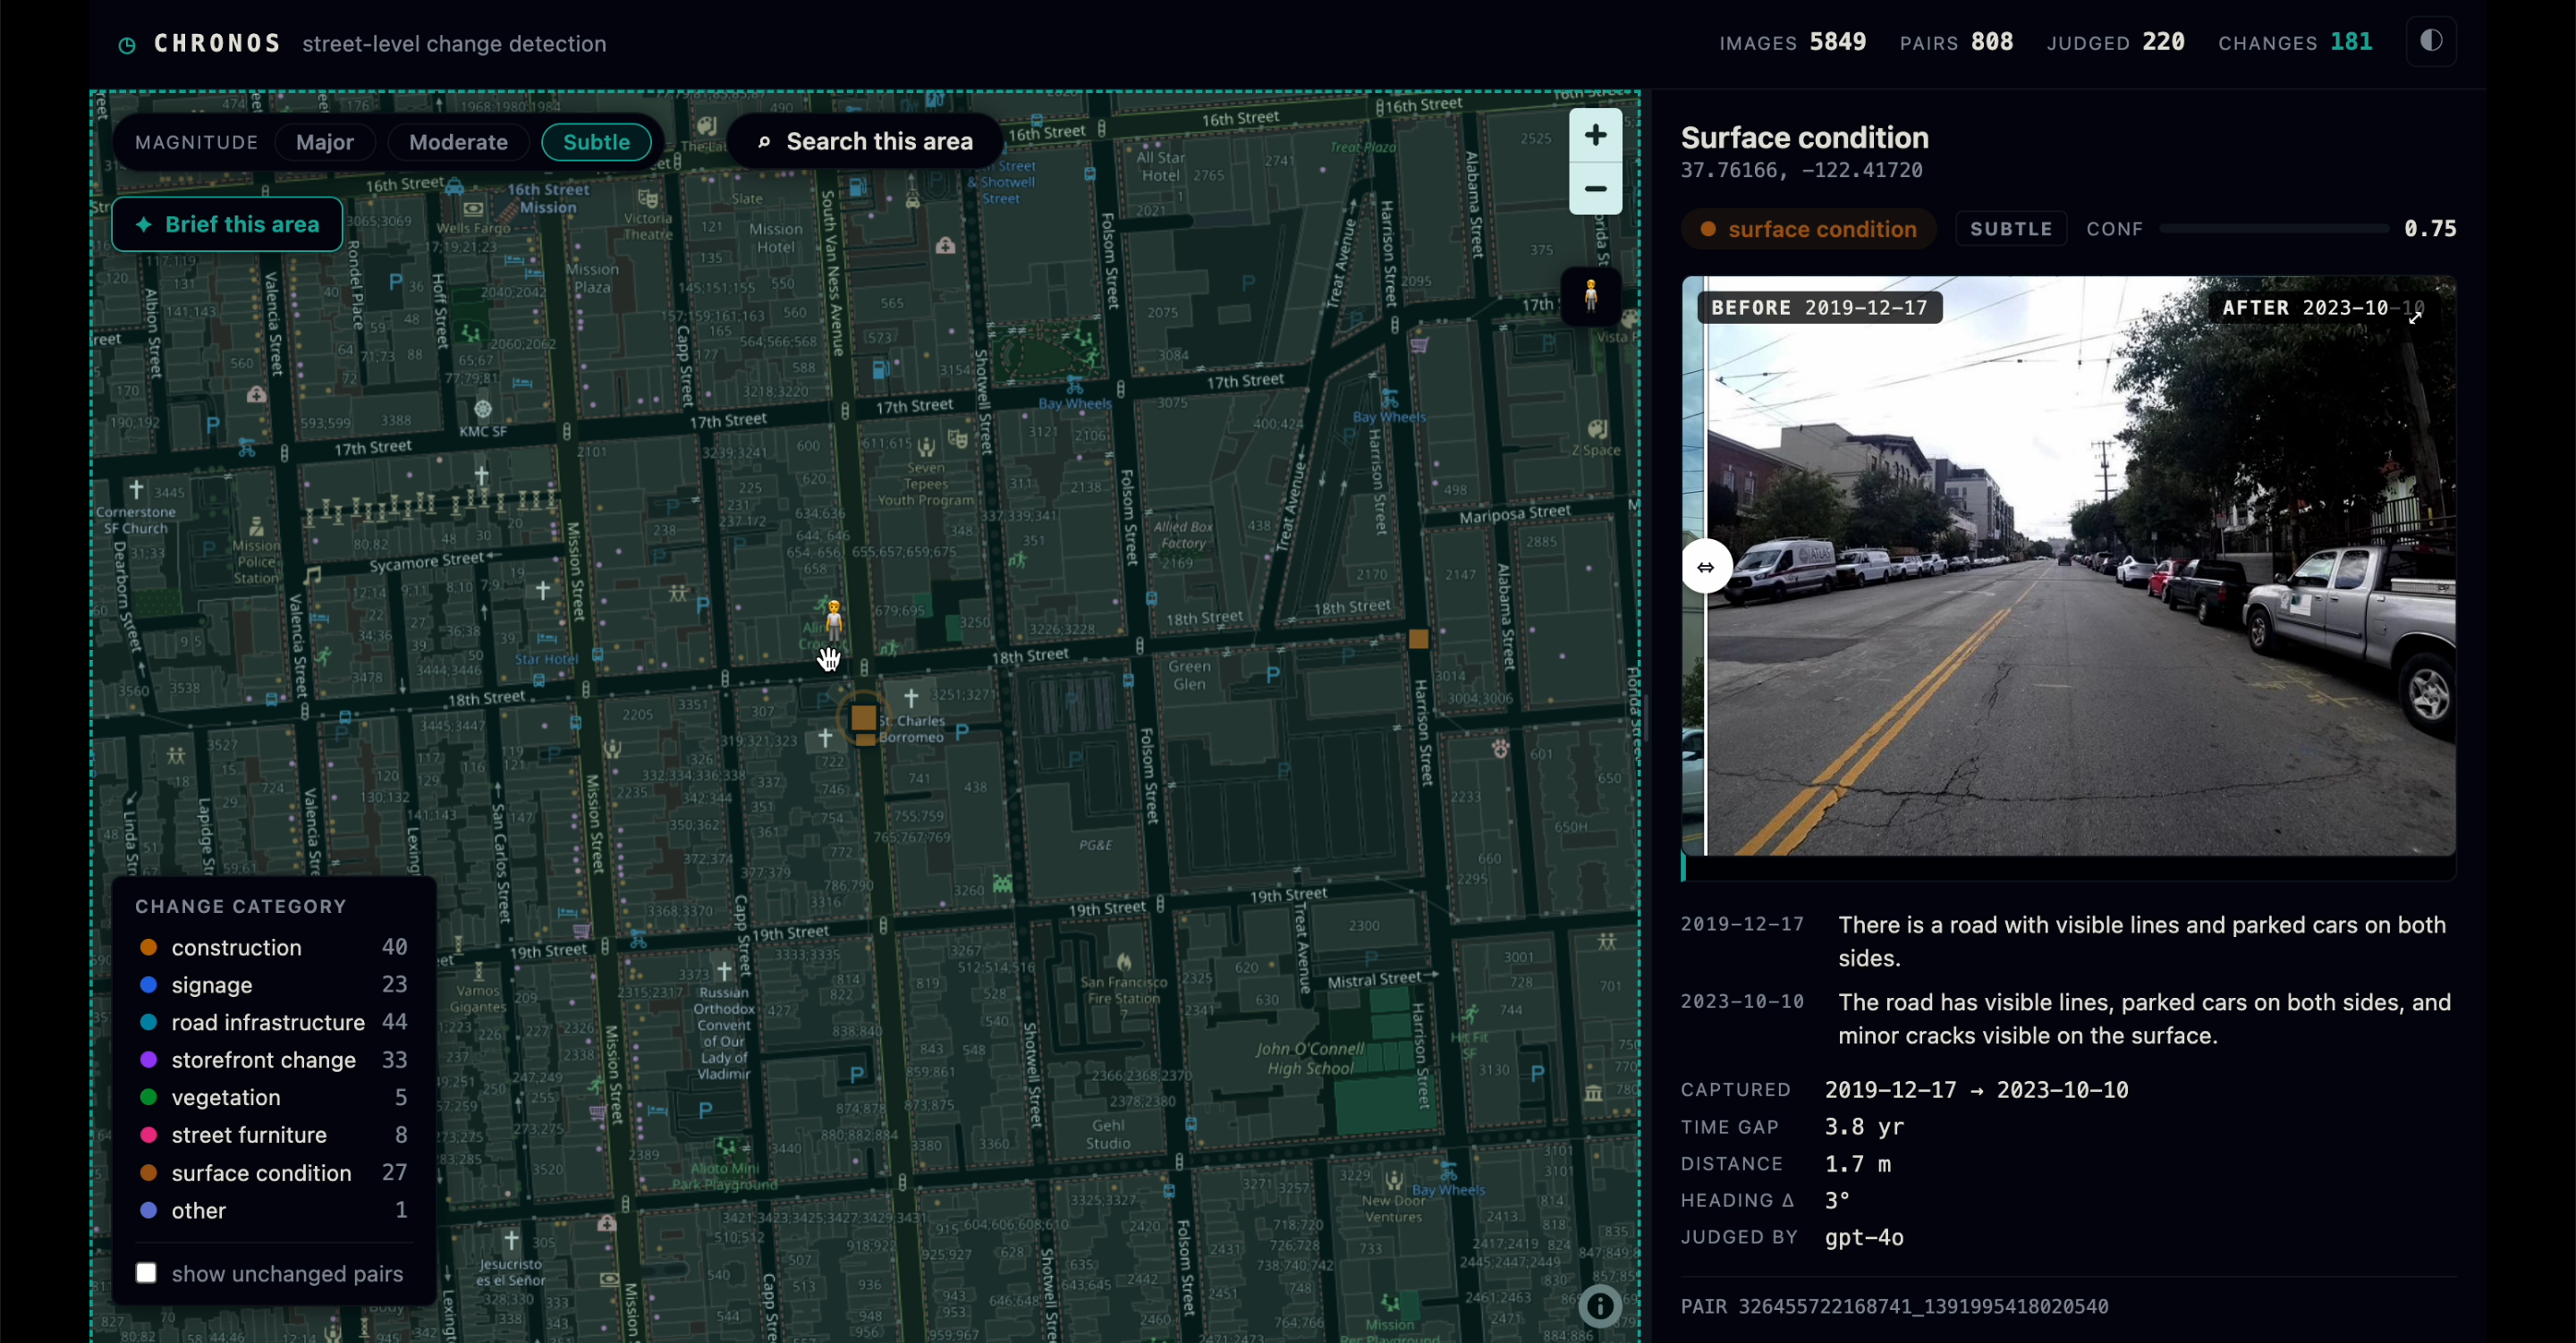
Dropping a Pegman on to the map
-
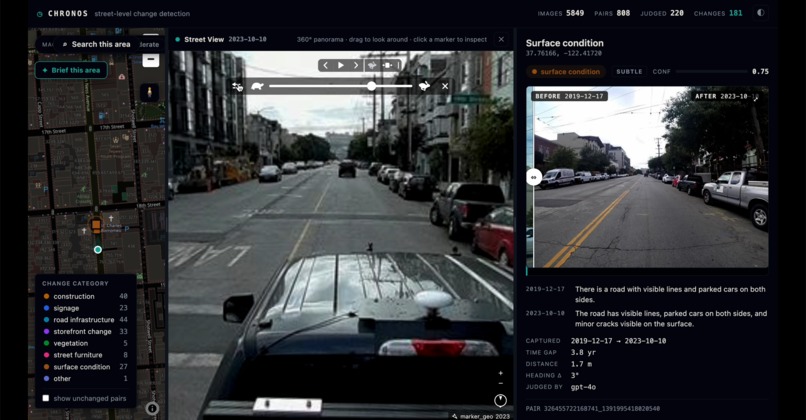
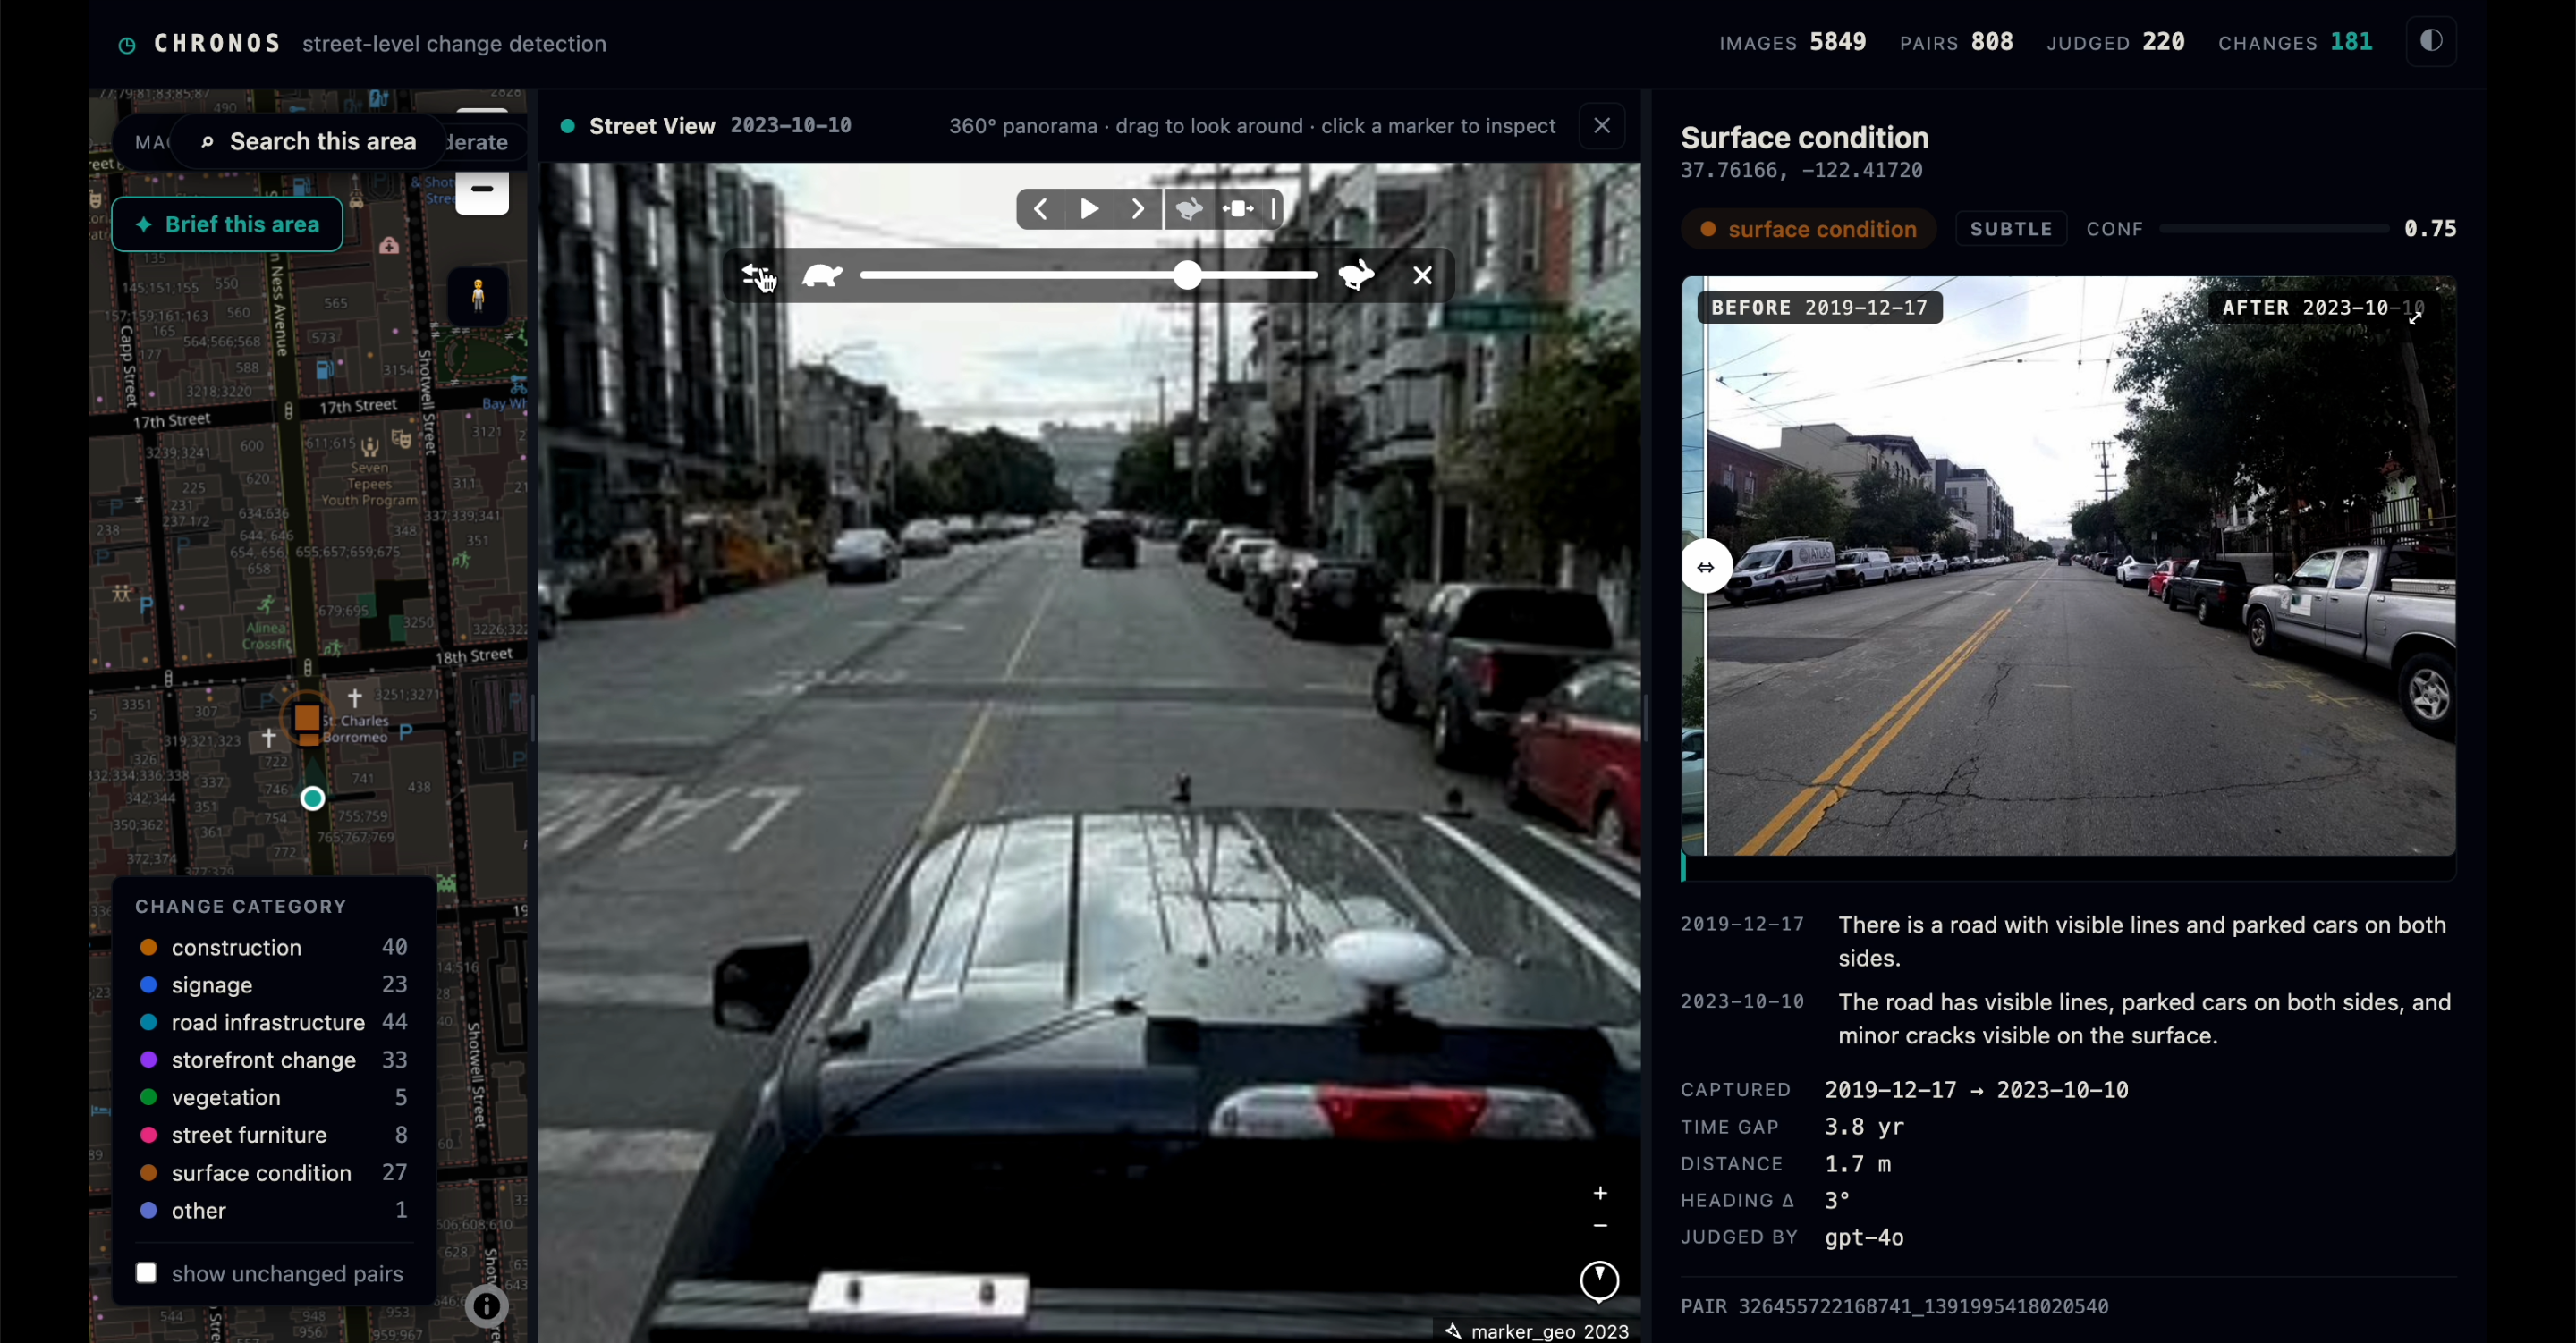
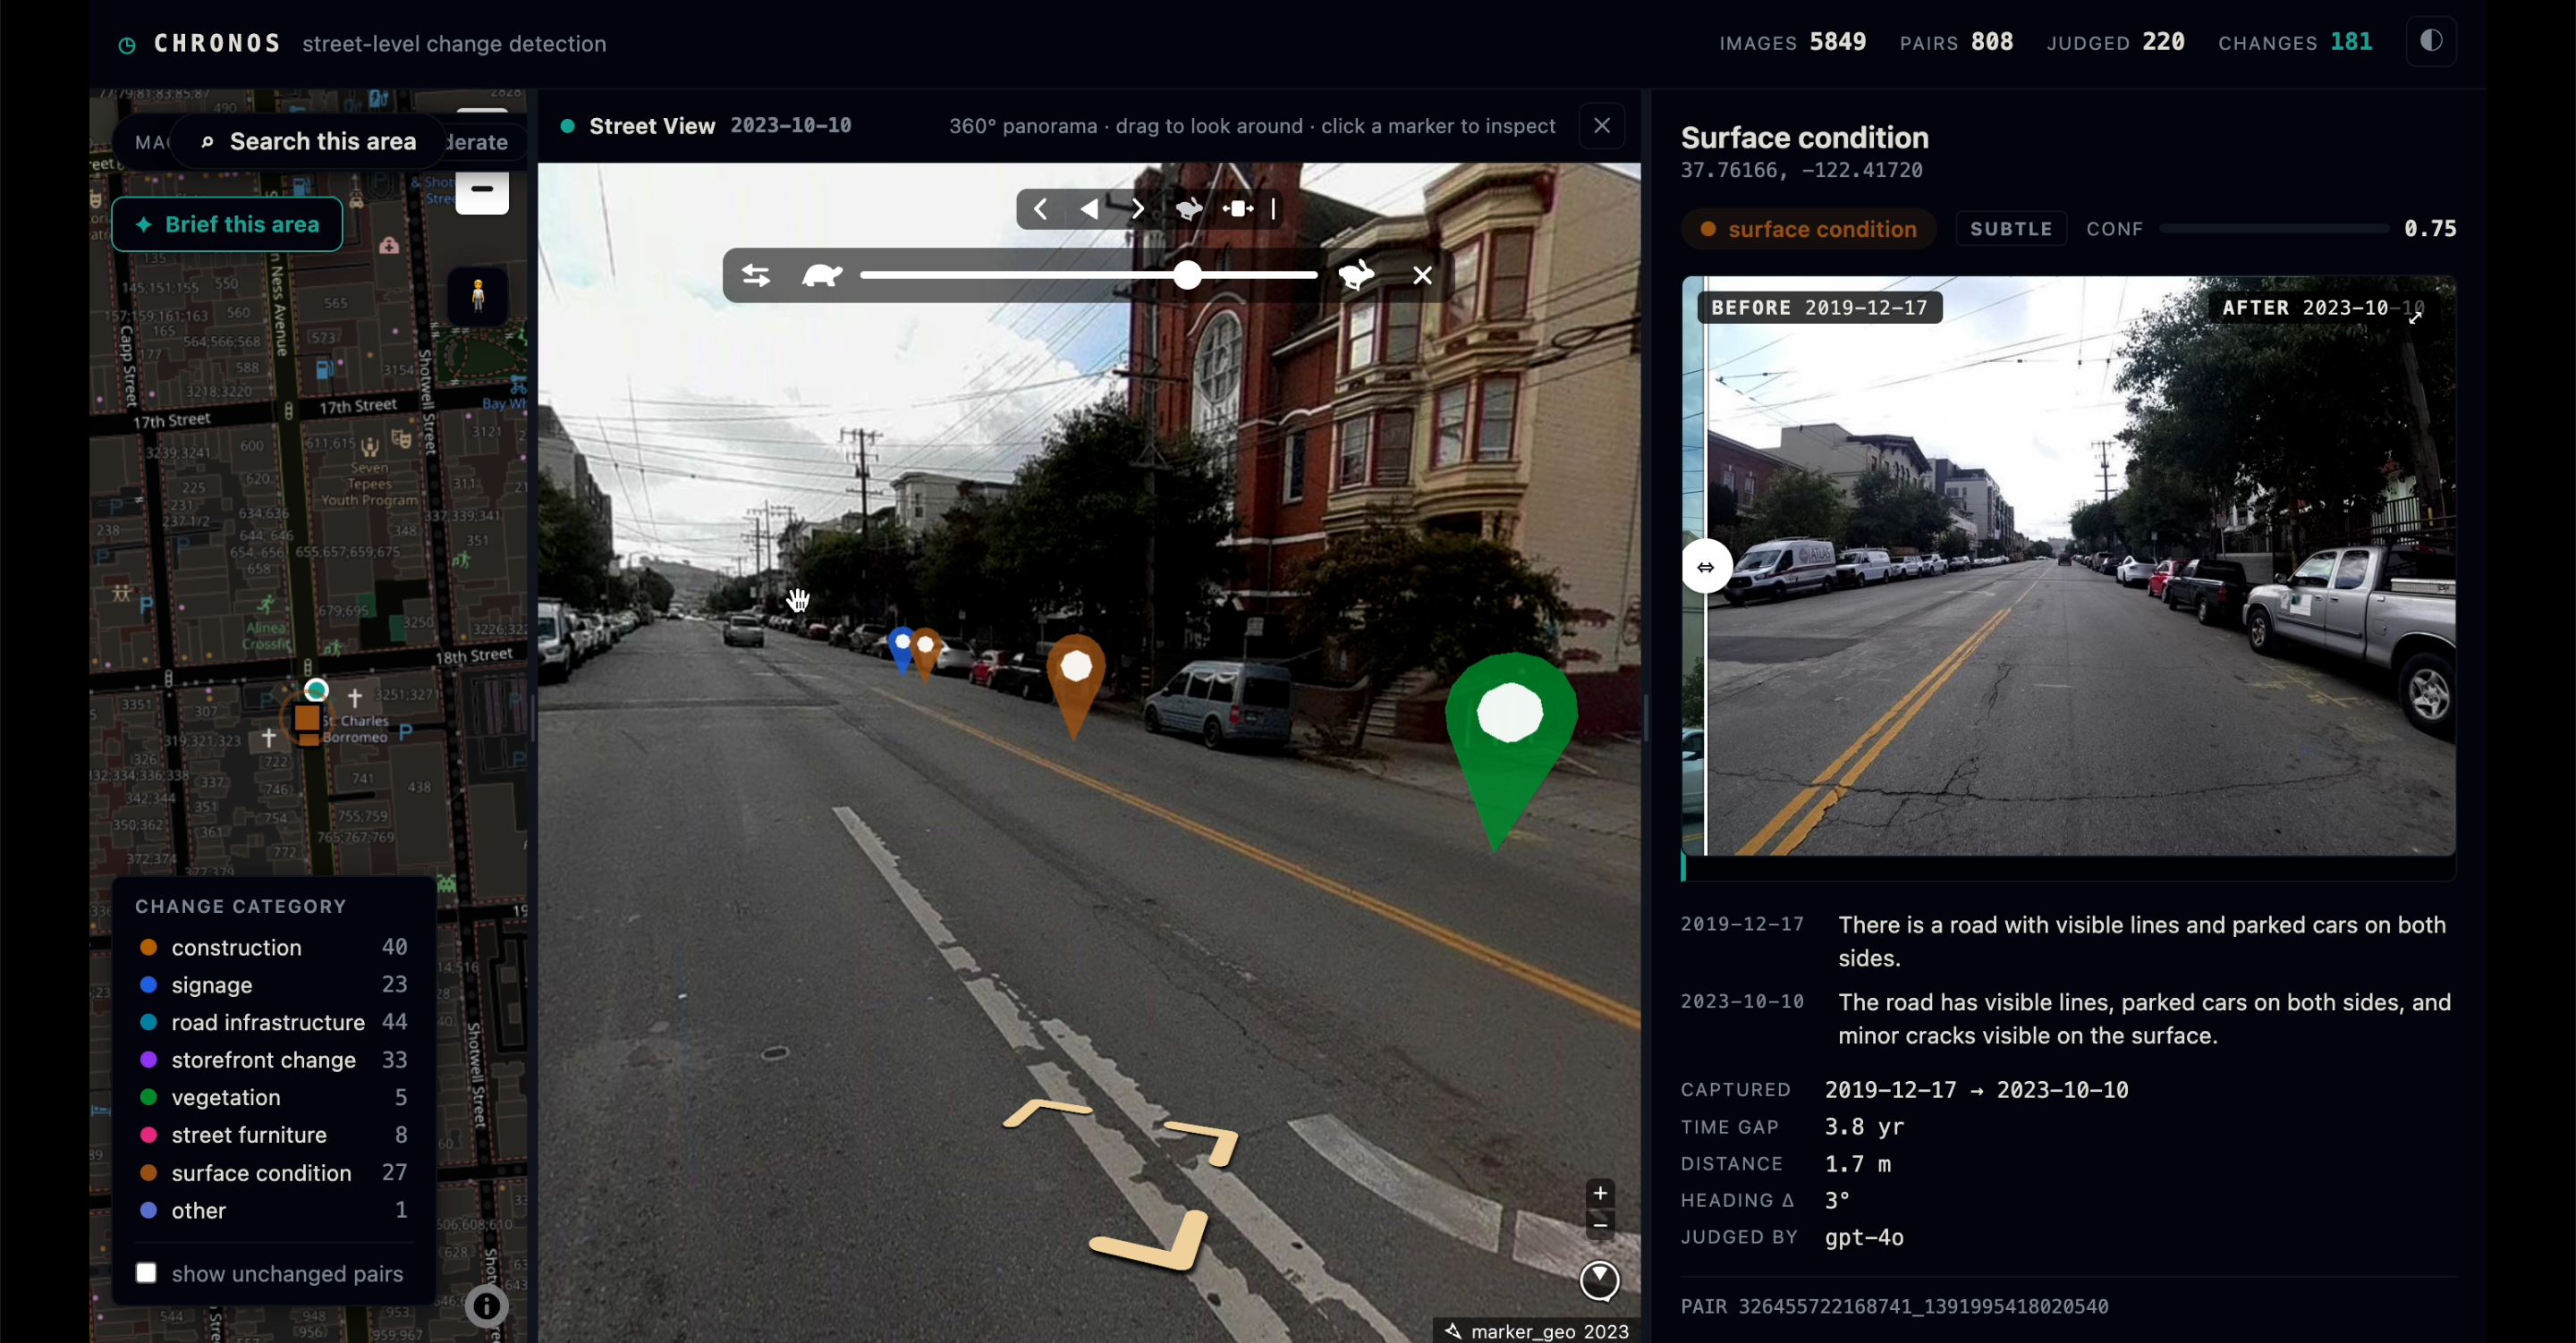
360 Panorama Viewing that is interactive
-
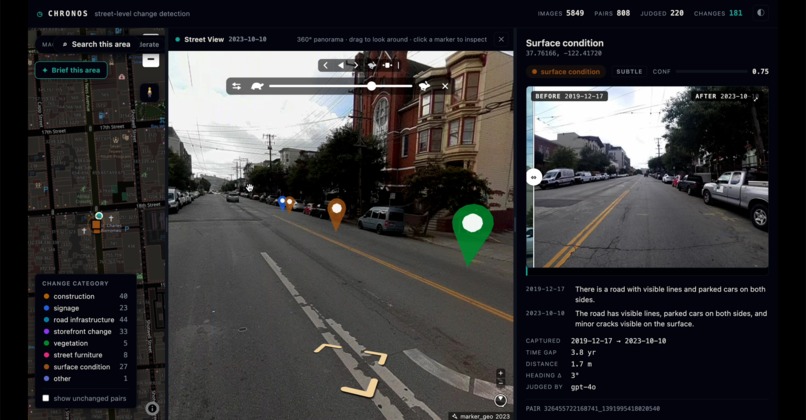
Live View of the Damages area
Inspiration
Cities know the instant a building goes up. It's in the permit database the same day. But when a crosswalk fades, a curb ramp cracks, a bollard disappears, or a bike lane quietly shows up, nobody is really tracking that. That layer of information just doesn't exist in any dataset, public or private.
The strange part is that the evidence already exists. Millions of people drive, bike, and walk their cities with dashcams and phones, and a lot of that footage ends up on platforms like Mapillary. The same corners get photographed over and over, sometimes years apart. Every one of those repeat captures is basically a before and after photo pair sitting there unused. I kept thinking, nobody has turned this pile of imagery into an actual record of how streets change over time. So I decided to try.
What it does
Chronos pairs street-level photos of the same spot taken years apart, uses a vision model to figure out what actually changed, and drops every verified change onto an interactive map. From there you get a before and after wipe slider and a 360 degree street view.
The idea I care about most is what I call the detection floor. The big stuff, like construction and demolition, is already tracked in permit records. Where Chronos earns its keep is the layer underneath that: a repaved crosswalk, a spreading pavement crack, a missing accessibility ramp. You can filter the map by magnitude (major, moderate, subtle) and dial straight into the small changes no city keeps records of.
A quick tour of what you can do:
- Evidence map. Every dot is a verified change, colored by category. The palette is validated for color-vision deficiency in both light and dark themes.
- Before and after slider. The two captures, years apart, with the model spelling out what changed.
- 360 street view. Drag a pegman onto the map and walk through navigable Mapillary panoramas, with detected changes floating as markers in the scene.
How I built it
The whole thing is deliberately small and runs locally. Python 3.12 with FastAPI and SQLite on the backend, plain vanilla JavaScript with MapLibre GL and mapillary-js on the frontend, no build step, only a handful of dependencies. It runs as one CLI with three commands: python -m chronos {ingest, inspect, serve}. Every stage is idempotent, so images, pairs, judgments, and raw API responses all live in SQLite and nothing ever gets re-fetched or re-judged.
Finding two photos of the same place, years apart. This was the hardest part and it comes down to geometry. For each candidate photo I have a position \( (\varphi, \lambda) \), a compass heading \( \theta \), a capture timestamp \( t \), and a sequence id \( s \) that says which trip it came from. Two photos \( i \) and \( j \) only count as a valid pair when all four of these hold:
$$ \text{pair}(i,j) \iff d_{ij} \le 15\,\text{m} \;\wedge\; \Delta\theta_{ij} \le 30^\circ \;\wedge\; |t_i - t_j| \ge 730\,\text{d} \;\wedge\; s_i \ne s_j $$
Distance is the haversine great-circle distance:
$$ a = \sin^2!\left(\frac{\Delta\varphi}{2}\right) + \cos\varphi_1 \cos\varphi_2 \sin^2!\left(\frac{\Delta\lambda}{2}\right), \qquad d = 2R\,\arcsin!\left(\sqrt{a}\right) $$
Heading has to be compared on a circle so that \( 359^\circ \) and \( 1^\circ \) read as \( 2^\circ \) apart instead of \( 358^\circ \):
$$ \Delta\theta = \min\big(\,|\theta_1 - \theta_2|,\ 360^\circ - |\theta_1 - \theta_2|\,\big) $$
The 730 day gap makes sure I'm catching a durable change and not seasonal noise, and the rule that the sequence ids have to differ stops a single drive-through from matching against itself.
Checking every possible pair is \( O(n^2) \), which falls apart at thousands of images. So I bucket photos into a spatial grid sized to the distance threshold and only compare candidates in neighboring cells, which brings pairing close to linear. Then a greedy 1-to-1 matching pass keeps only the single best-aligned partner per location, so one corner produces one clean pair instead of a pile of near-duplicates. That also keeps my judging costs down. This whole module is pure, with no network and no disk, so I could unit test it properly. That was on purpose. The one piece of logic I really can't get wrong is the one I can test in isolation.
Judging each pair. Every surviving pair goes to a vision model under a strict JSON schema with structured outputs, so I get typed results I can trust instead of free-form text I have to parse. The prompt makes the model describe both images before it's allowed to give a verdict, which noticeably cut down on made-up changes. It returns a category, a magnitude, a calibrated confidence, and one sentence of evidence. Then a backstop runs in code, not in the prompt:
$$ \text{verdict} = \begin{cases} \texttt{no_change}, & c < 0.40 \ \text{model verdict}, & c \ge 0.40 \end{cases} $$
If the model isn't confident, I overrule it. For a tool that's supposed to be an accountability layer, a false alarm is worse than a miss, so I'd rather stay quiet than invent something.
The explorer. The frontend is a MapLibre map with markers colored by category, a magnitude filter, a clip-path before and after slider, a fullscreen lightbox, and the 360 street view built on mapillary-js. Every view is deep-linkable (?pair=, ?sv=, ?c=, ?theme=) so any state is shareable.
Challenges I ran into
The wall I hit early nearly sank the project. Mapillary's Graph API lets you ask for every image inside a bounding box, but on any dense urban area it just returns HTTP 500 with "reduce the amount of data." It didn't matter what limit I set. The region itself was too heavy to serve in one shot, since a single downtown block can hold thousands of captures. My clean "fetch this neighborhood" call was dead on arrival exactly where I most wanted to look.
The fix was to stop treating the map as one request and start treating it as a recursive subdivision problem. When a bounding box fails, I split it into four quadrants and fetch each one on its own:
$$ B \;\longrightarrow\; {B_{NW},\; B_{NE},\; B_{SW},\; B_{SE}} $$
Any child that still fails gets split again, and again, until each tile is small enough that the API answers cleanly. It's basically a quadtree that adapts to how dense an area is, going deep over a busy intersection and staying shallow over a quiet block, with a wall-clock budget so it can never spiral forever.
But chopping the map into chunks creates the second half of the problem, which is stitching it back together. The same photo can show up in two neighboring tiles, and worse, the two halves of a real before and after pair can land in different tiles, split right down a seam I invented. So after fetching I deduplicate every image on its primary key as tiles merge, reassemble everything into one global dataset, and only then run pairing over that unified set so matches can form across tile boundaries. The subdivision is just a fetch-time trick. By the time the geometry runs, it has no idea the map was ever cut apart. Getting that split right, chop aggressively for the network but reassemble completely for the logic, is what took Chronos from "works on a toy bounding box" to "works on a real city."
This part was made with Codex. I worked through the chunk-and-stitch fight with Codex, but the call to chop for the network and stitch for the logic was mine, and getting that boundary right was the whole game.
A few other things fought back:
- Rate limits during judging. Running judging in parallel got roughly two-thirds of my calls throttled with 429s. Because every result is cached and re-judgeable, this cost me nothing but time. The idempotent design just absorbed it, and it convinced me to cache everything.
- A CSS ghost. Markers drifted off their coordinates on zoom because my stylesheet's
.marker { position: relative }was quietly overriding MapLibre's ownposition: absolute. Same specificity, my sheet loaded later, so it won. Deleting one line re-anchored every marker. The bug was never in the map logic at all.
Accomplishments that I'm proud of
Honestly, the first one is personal: this is a piece of tech I've wanted to build for a long time, and I finally got around to actually messing with maps and making it real instead of leaving it as a someday idea.
Beyond that, I got a genuinely broad system working end to end in a hackathon window: ingestion, geometric pairing, vision judging, and a polished explorer with a 360 street view. It runs locally with a tiny dependency list and no build step. I built it in close partnership with Codex, and I'm proud of how much a clear set of decisions and constraints let us ship this fast.
The chunk-and-stitch pipeline is the piece I'm proudest of, because it's the difference between a demo that only works on a hand-picked box and something you can actually aim at a real city. I'm also proud that the model-driven parts are built to be trustworthy rather than flashy. The structured outputs, the describe-before-judge prompt, and the confidence floor in code all exist so the system can't quietly lie to you, and for an accountability tool that matters more than anything.
What I learned
- The data plumbing was the real work. The vision model is the shiny part, but the project lived or died on getting clean, deduplicated, correctly paired imagery out of a fussy API.
- If you want to trust a system that leans on a model, you build the trust into the scaffolding around the model, not the model itself. Structured outputs, a describe-first prompt, and a code-level confidence floor did far more than any clever wording.
- Idempotency is a quiet superpower. Because every stage caches to SQLite, rate limits and crashes and retries turned into non-events, and I could iterate without fear.
- Working with Codex well is a decision-making skill, not a delegation trick. I built Chronos in close partnership with Codex, and the collaboration only worked because I owned the calls it couldn't see. The architecture decisions were mine: keep pairing pure and testable, make every stage idempotent, and put the confidence floor in code instead of trusting the prompt. The chunk-and-stitch fight was the clearest example. I'm the one who diagnosed that the region was too dense and decided to segment the bounding box, and Codex helped me turn that into working recursive code fast. Left alone it would have happily handed back four disconnected tiles. The output tracked directly with the judgment and constraints I brought to it.
What's next for Chronos
Chronos already turns imagery that already exists into a change layer that no city currently has, with no new sensors, no field crews, and no new data collection. Point it at any street in a city with coverage and you get an accountability layer for public space: early warning on maintenance backlogs, faded crossings and broken curb ramps that fail the people who depend on them, and a longitudinal record for planners and researchers.
Next up: temporal trends beyond simple pairs, so three, four, or five captures over a decade tell a story instead of just two. After that, routing inspect findings straight to the right municipal department, and expanding to any city Mapillary reaches, which is most of them.
A note on the live demo
The version I deployed on Render is a read-only explorer, and that's on purpose. It runs off a curated snapshot of already-judged changes and has no API access wired up. That means the real-time features, like searching a fresh area and running new detection, are not part of the public link. The reason is simple: the link is public, and I don't want anyone accidentally draining my API budget on my behalf. The full live pipeline still runs locally with your own keys. The deployed demo is just the safe, static face of it so you can explore the map and the before and after evidence without any cost or setup.


Log in or sign up for Devpost to join the conversation.