-
-
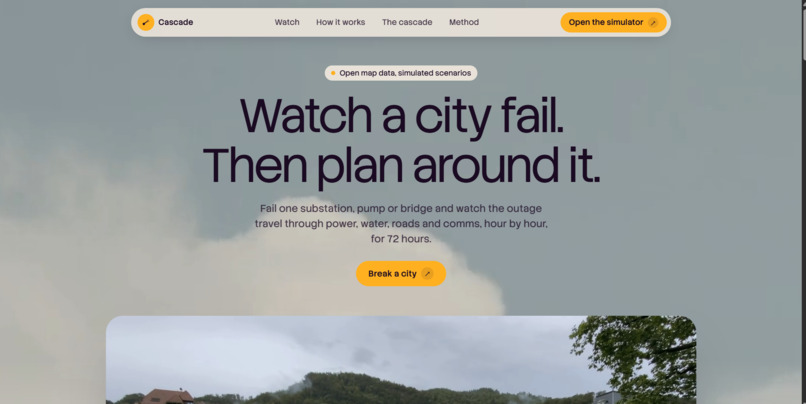
Thumbnail and Hero
-
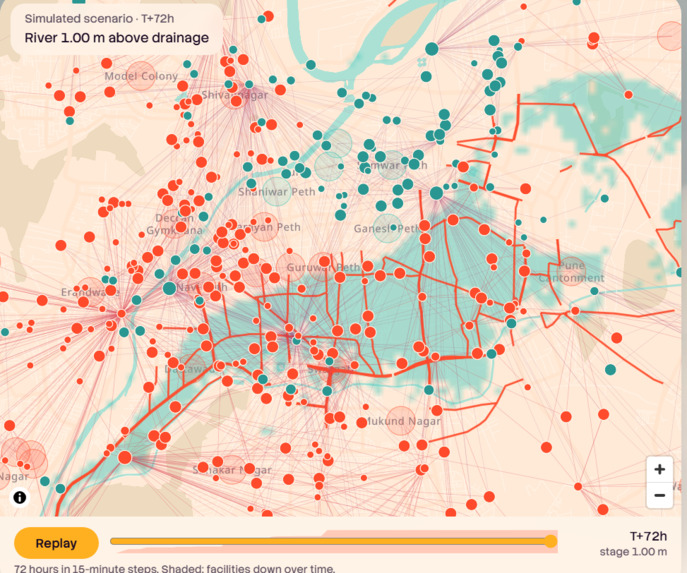
Dependency graph on the Pune map
-
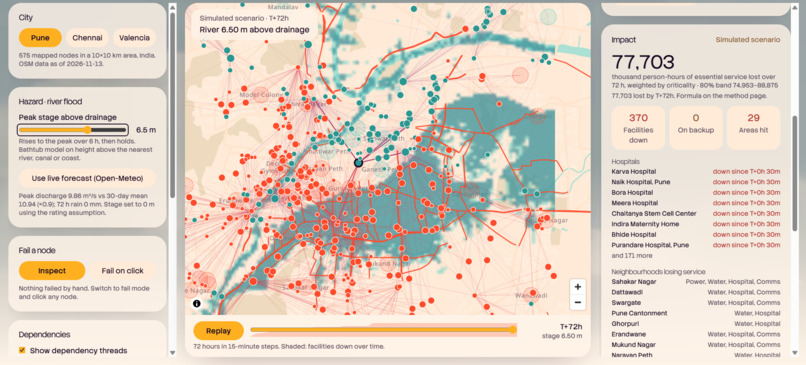
The cascade running
-
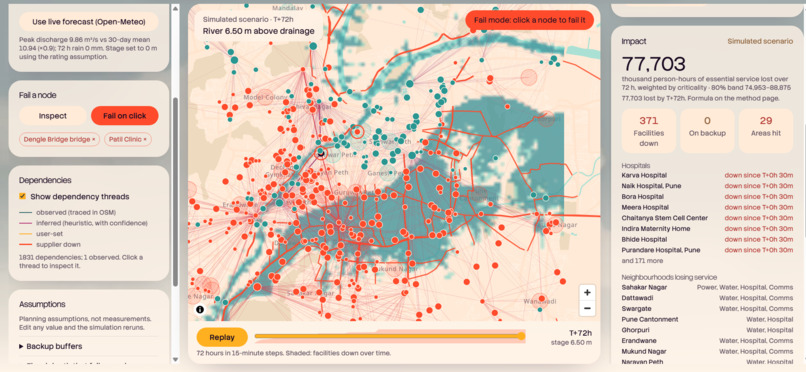
Why did this fail
-
-
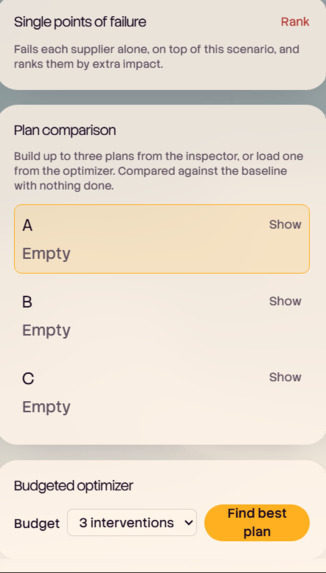
Plan comparison A/B/C
-
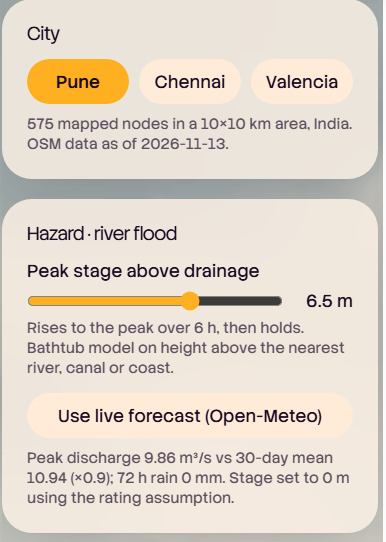
City switcher
-
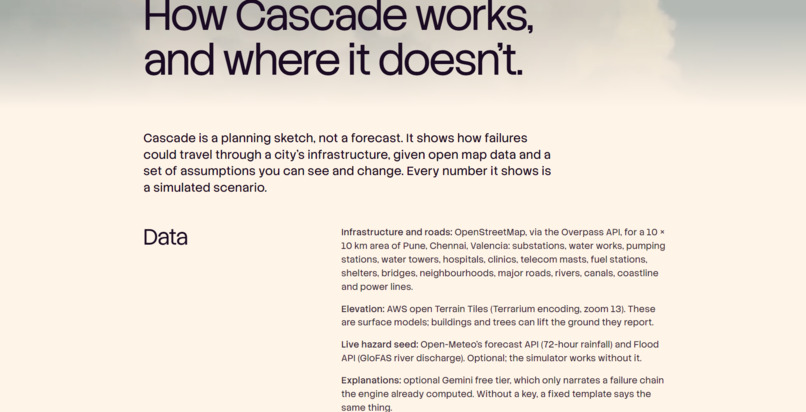
Method Page
-
How it works
-

Video Explaination(60s)

Inspiration
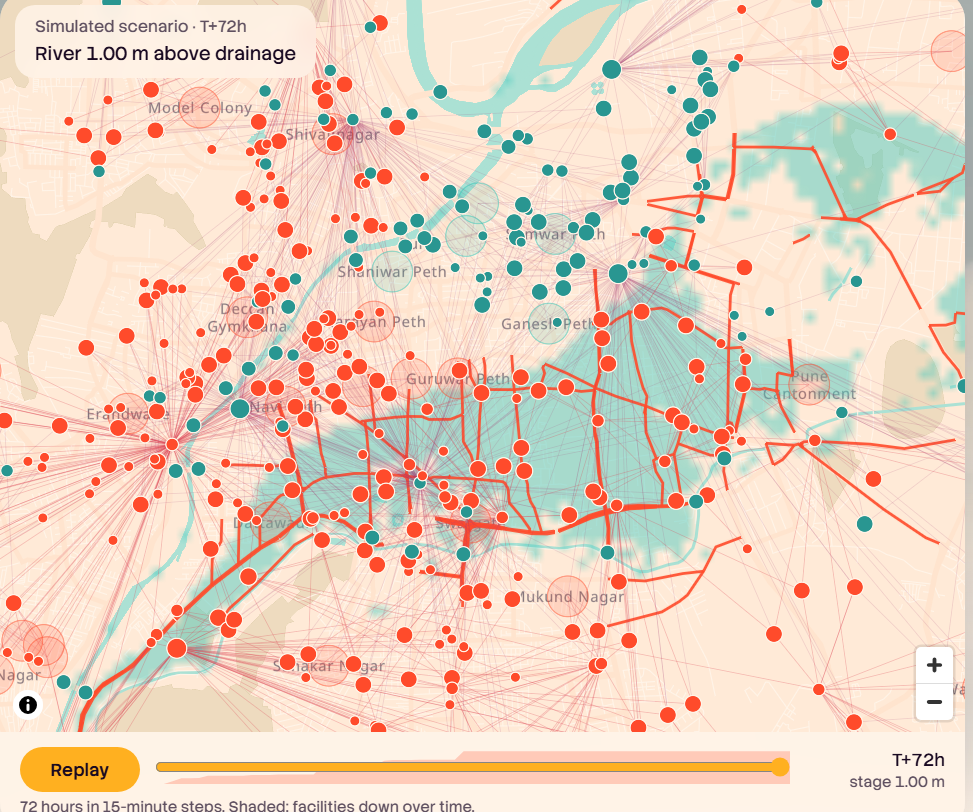
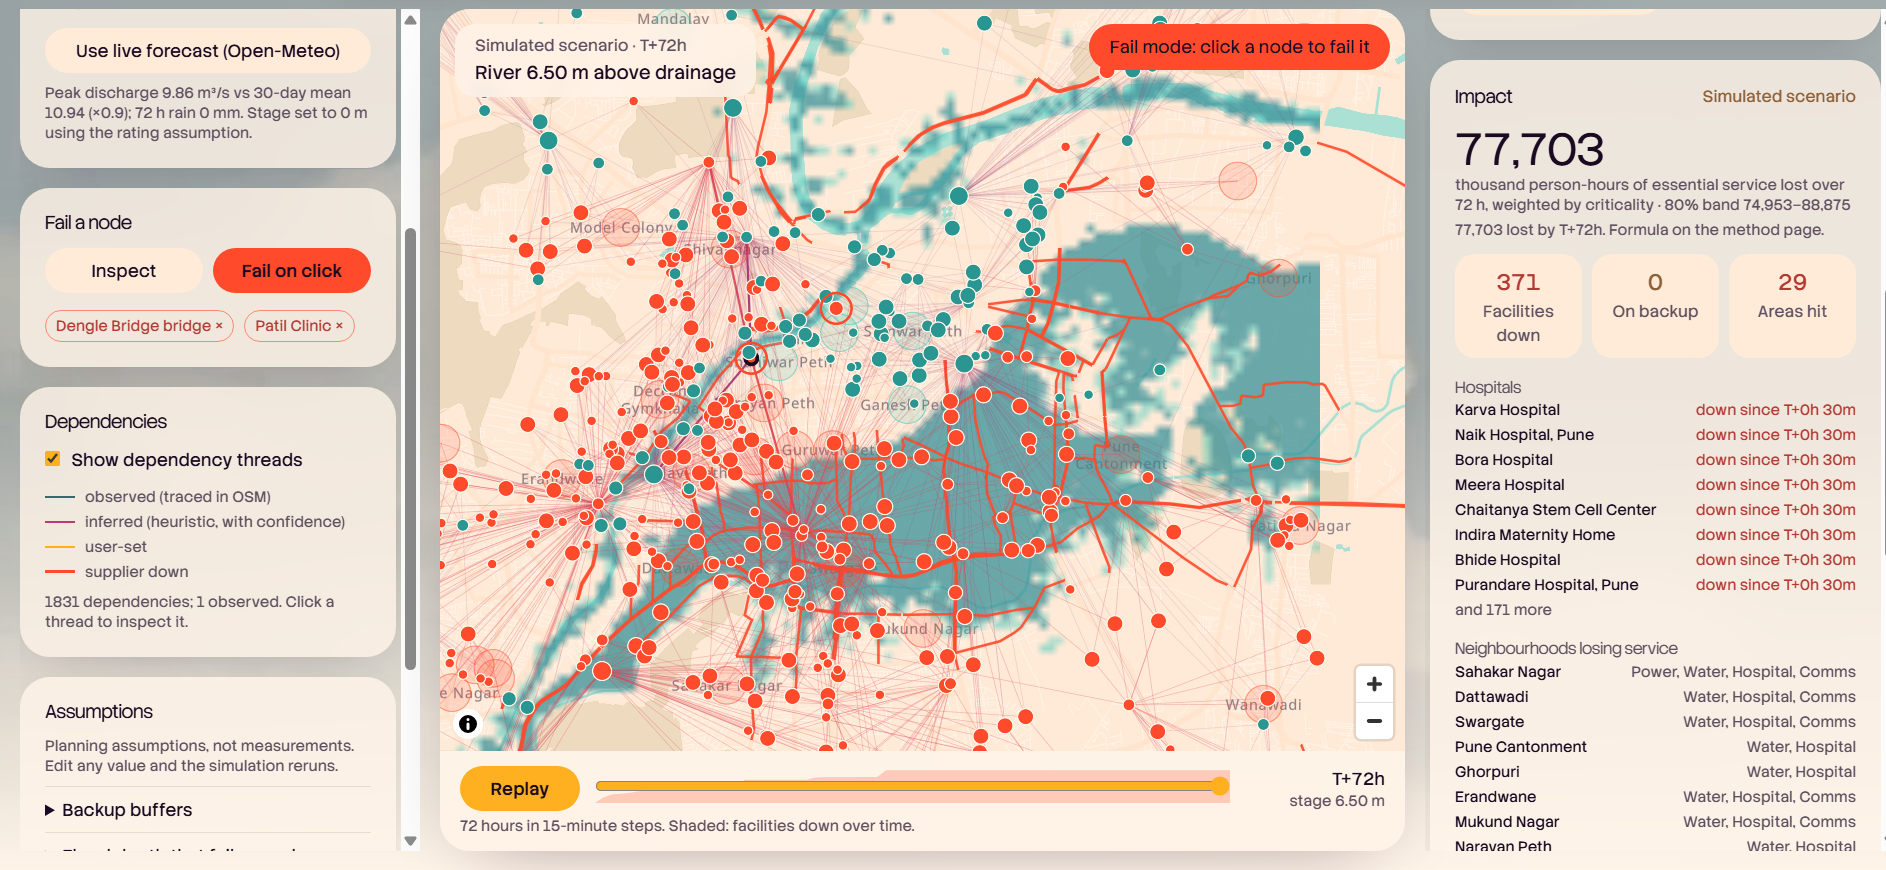
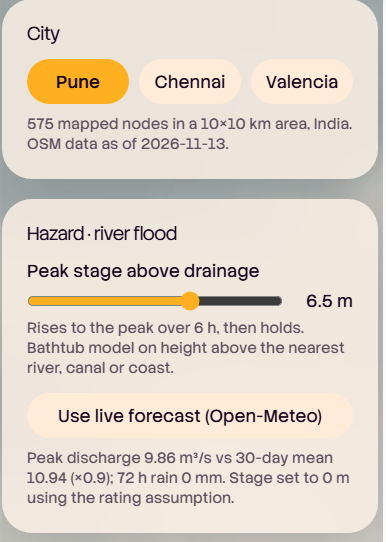
When a flood hits a city, nothing fails alone. A flooded substation stops a pumping station, the pumping station stops a water tower, and hours later a clinic or hospital runs out of backup. Planners can see each system on its own map, but almost nobody can see the chain between them. We wanted to make that chain visible, and make it something anyone can try without installing or paying for anything. We started with Pune, a city we know, and added Chennai and Valencia.
What it does
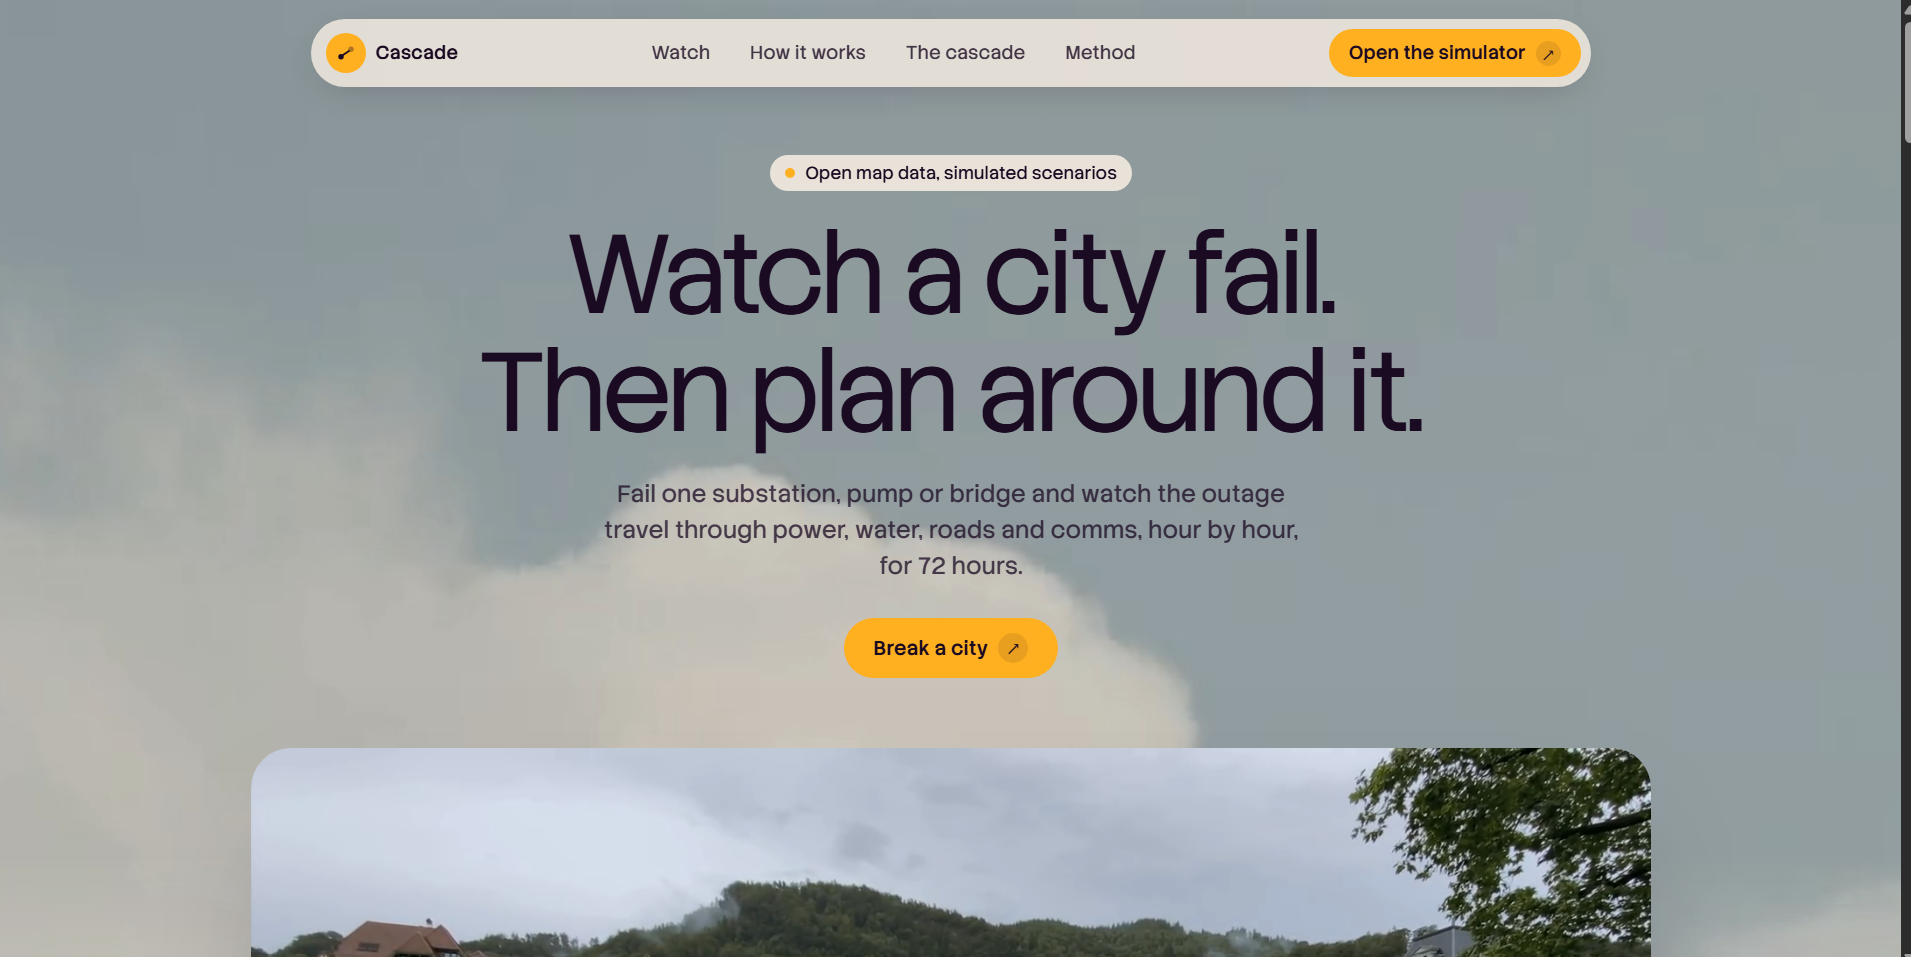
Cascade is a browser-based simulator for failures spreading through a city's power, water, roads and comms over 72 hours.
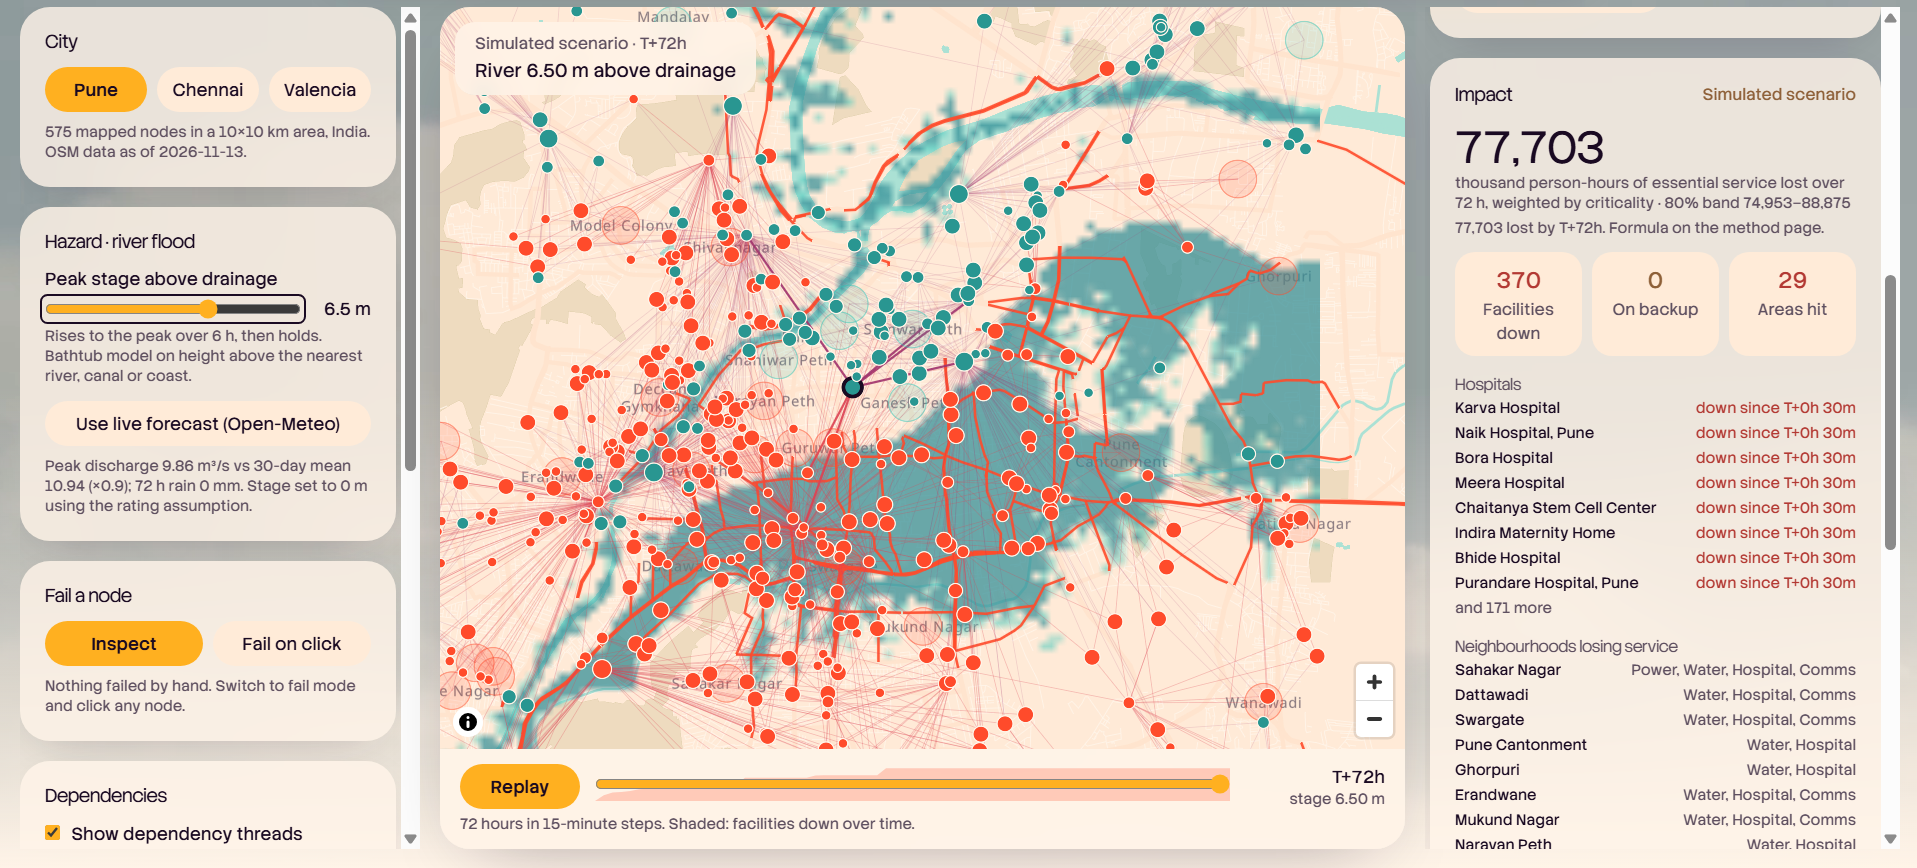
- Break something. Fail a substation, pump or bridge, or let a river rise over six hours.
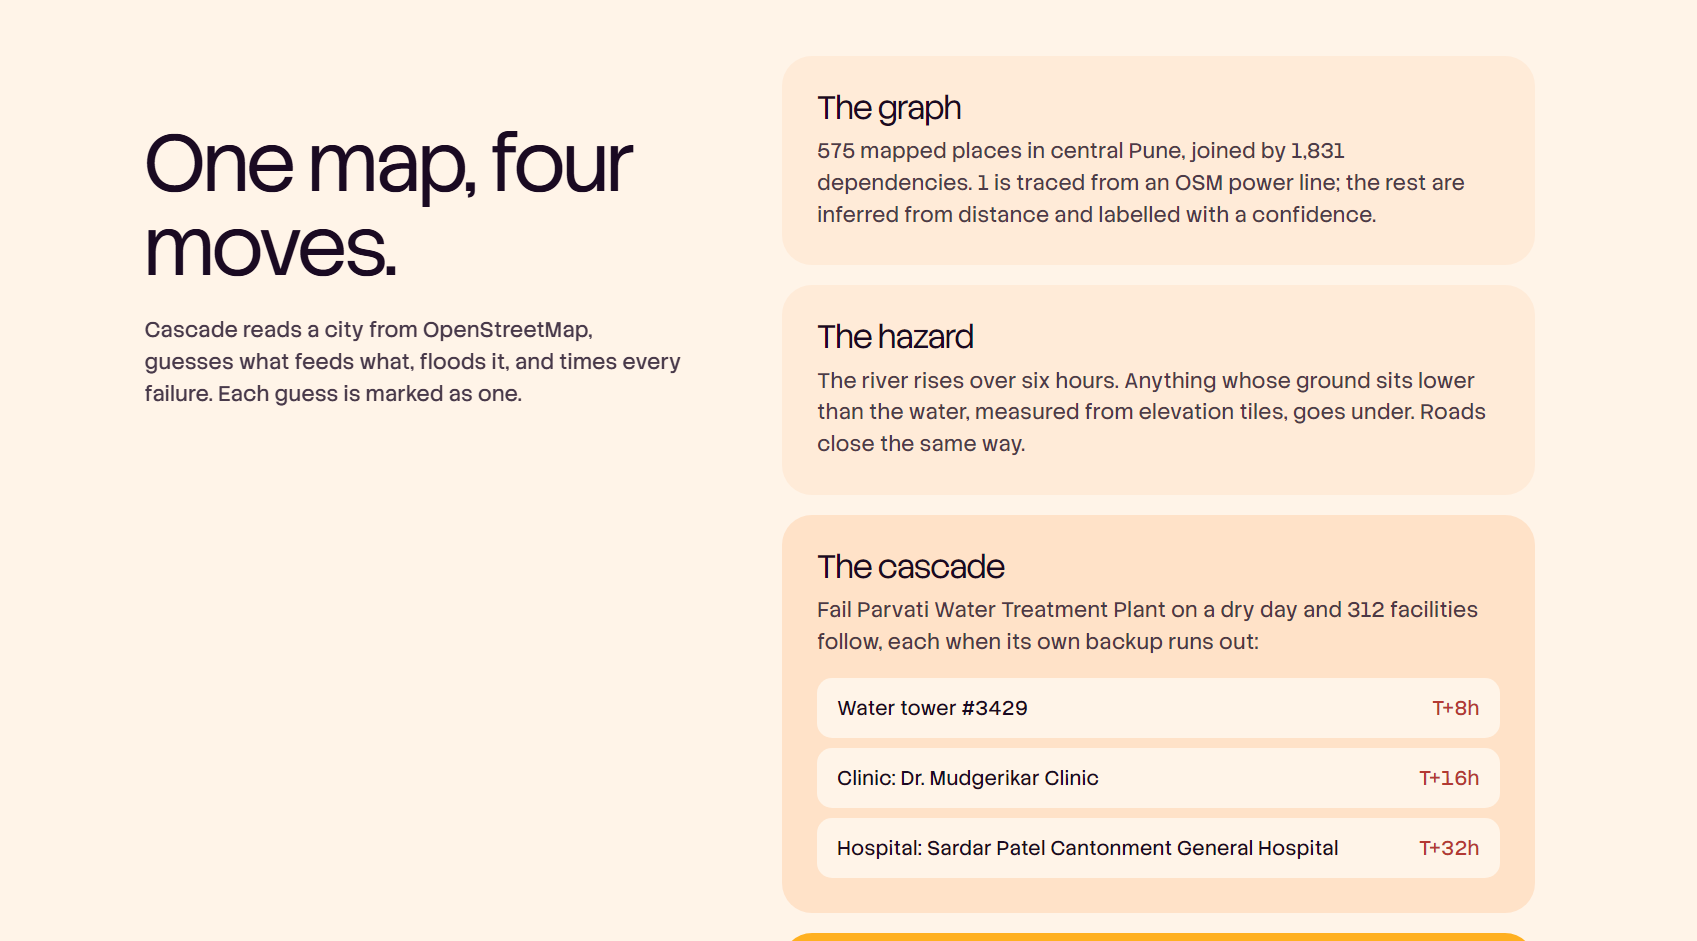
- Watch the timeline. Each facility fails at the moment its backup (generator, battery, tank) runs out, so you see when each one fails, not just whether.
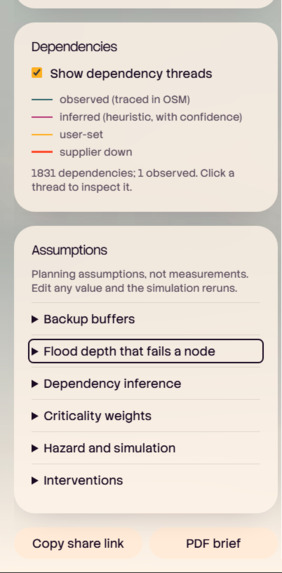
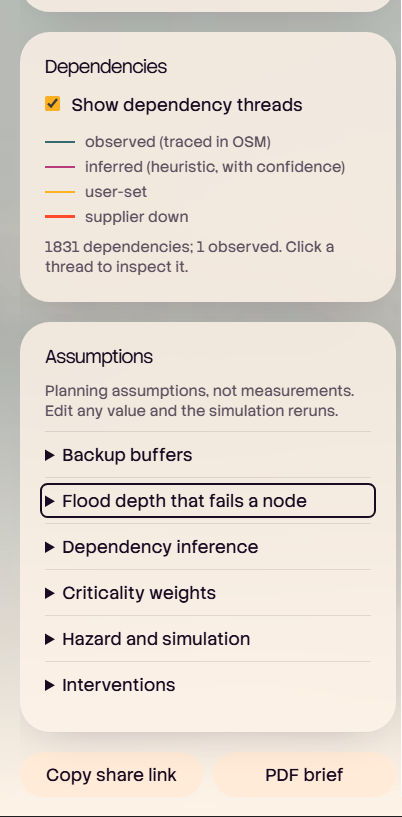
- Know what to trust. Every dependency is labelled observed(traced in OpenStreetMap), inferred (guessed from geography, with a confidence score) or user-set.
- Ask "why did this fail?" Click any failed node to trace the exact chain that caused it.
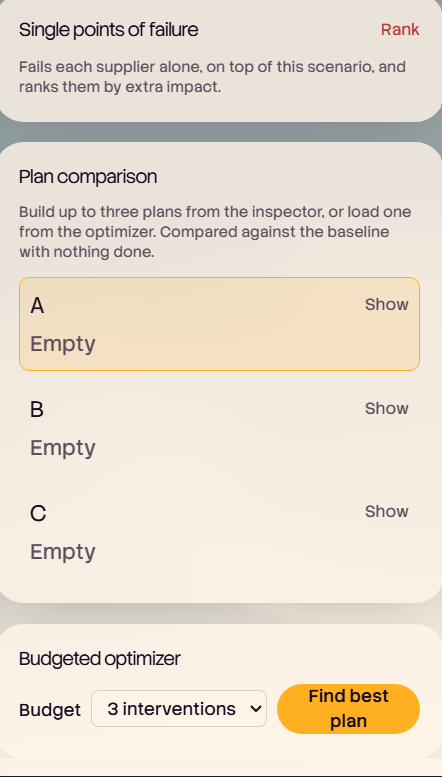
- Plan around it. A budgeted optimizer suggests interventions, and you can compare up to three plans side by side.
- See the uncertainty. 200 Monte Carlo runs vary the flood stage and which supplier an inferred link actually uses.
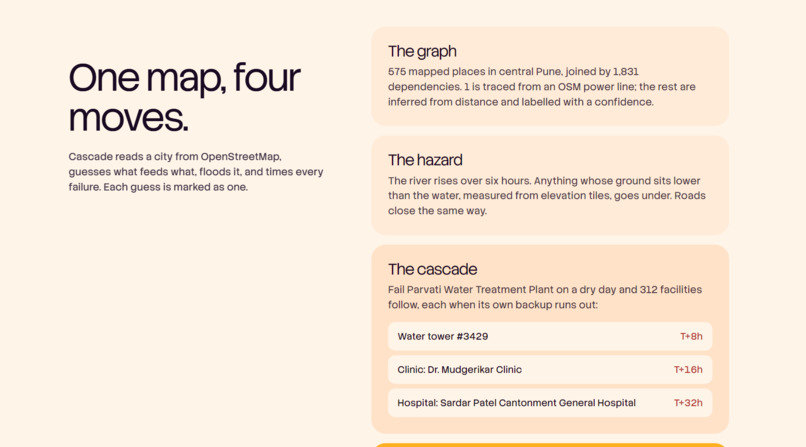
In our Pune model (575 mapped places, 1,831 dependencies), failing the Parvati water treatment plant on a dry day triggers 312 knock-on failures: a water tower at T+8h, a clinic at T+16h, a hospital at T+32h. The optimizer tested 89 plans and cut simulated impact by about 10%. All figures are simulated scenarios.
How we built it
- Next.js, React and TypeScript on Vercel, with no database and no accounts.
- A discrete-event cascade engine in 15-minute steps over 72 hours, with AND/OR dependency logic and backup buffers.
- A bathtub flood model on AWS Terrain elevation tiles.
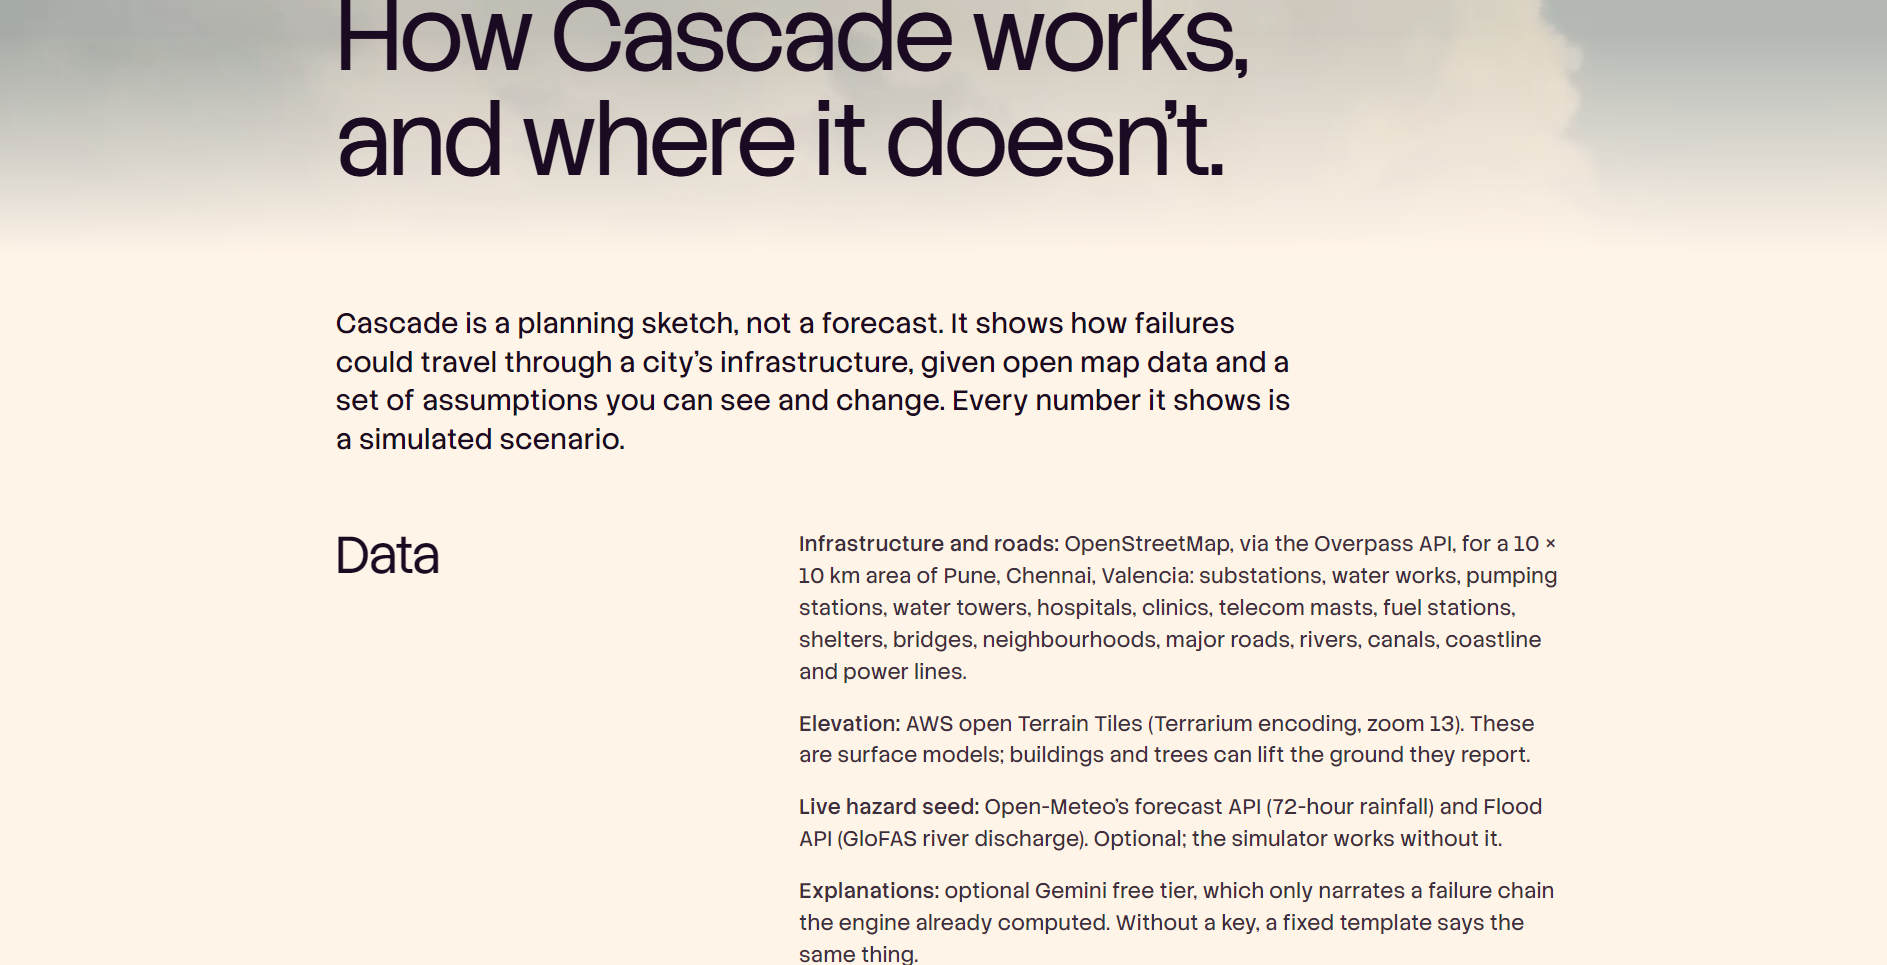
- Infrastructure from OpenStreetMap via the Overpass API, basemap from OpenFreeMap, rainfall and river discharge from Open-Meteo and GloFAS.
- MapLibre GL for the map, Lenis for smooth scrolling.
- Gemini's free tier only narrates the engine's output; a fixed template is used without a key. The engine is plain code, with no ML training.
- Vitest unit tests for chains, AND vs OR logic, exact backup expiry, flood thresholds, road access, determinism and a golden replay.
Challenges we ran into
- Open data is thin. OSM has only 8 substations and 2 masts in our Pune area, so a single substation can look more critical than it really is. We labelled every guessed link instead of hiding it.
- Most real dependencies aren't public. Feeder networks, mains and backhaul are not open data, so most edges are inferred.
- Keeping it honest. Existing tools such as InfraRisk and CReDo do serious work in this space. Cascade doesn't replace them. It is a zero-install, explainable planning sketch, and we state its limits on the Method page.
Accomplishments that we're proud of
Every number on screen can be traced back to a visible assumption, and every assumption can be edited in the dashboard.
What we learned
Showing when things fail changes the conversation more than showing whether they fail. Backup durations drive almost everything.
What's next for Cascade
Surveyed facility data in place of generic defaults, repair-crew and failover modelling, drainage-aware flooding, and more cities.
Built With
- aws-terrain-tiles
- css
- geminiapi
- glofas
- lenis
- maplibre
- next.js
- open-meteo
- openfreemap
- openstreetmap
- overpassapi
- playwright
- react
- tailwind
- typescript
- vercel
- vitest
