-
-
CareAtlas NJ brings care locations, a doctor-office pilot and tract evidence into one New Jersey map.
-
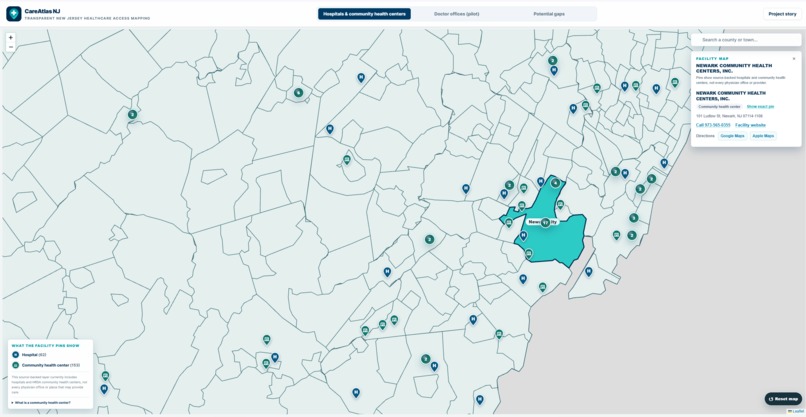
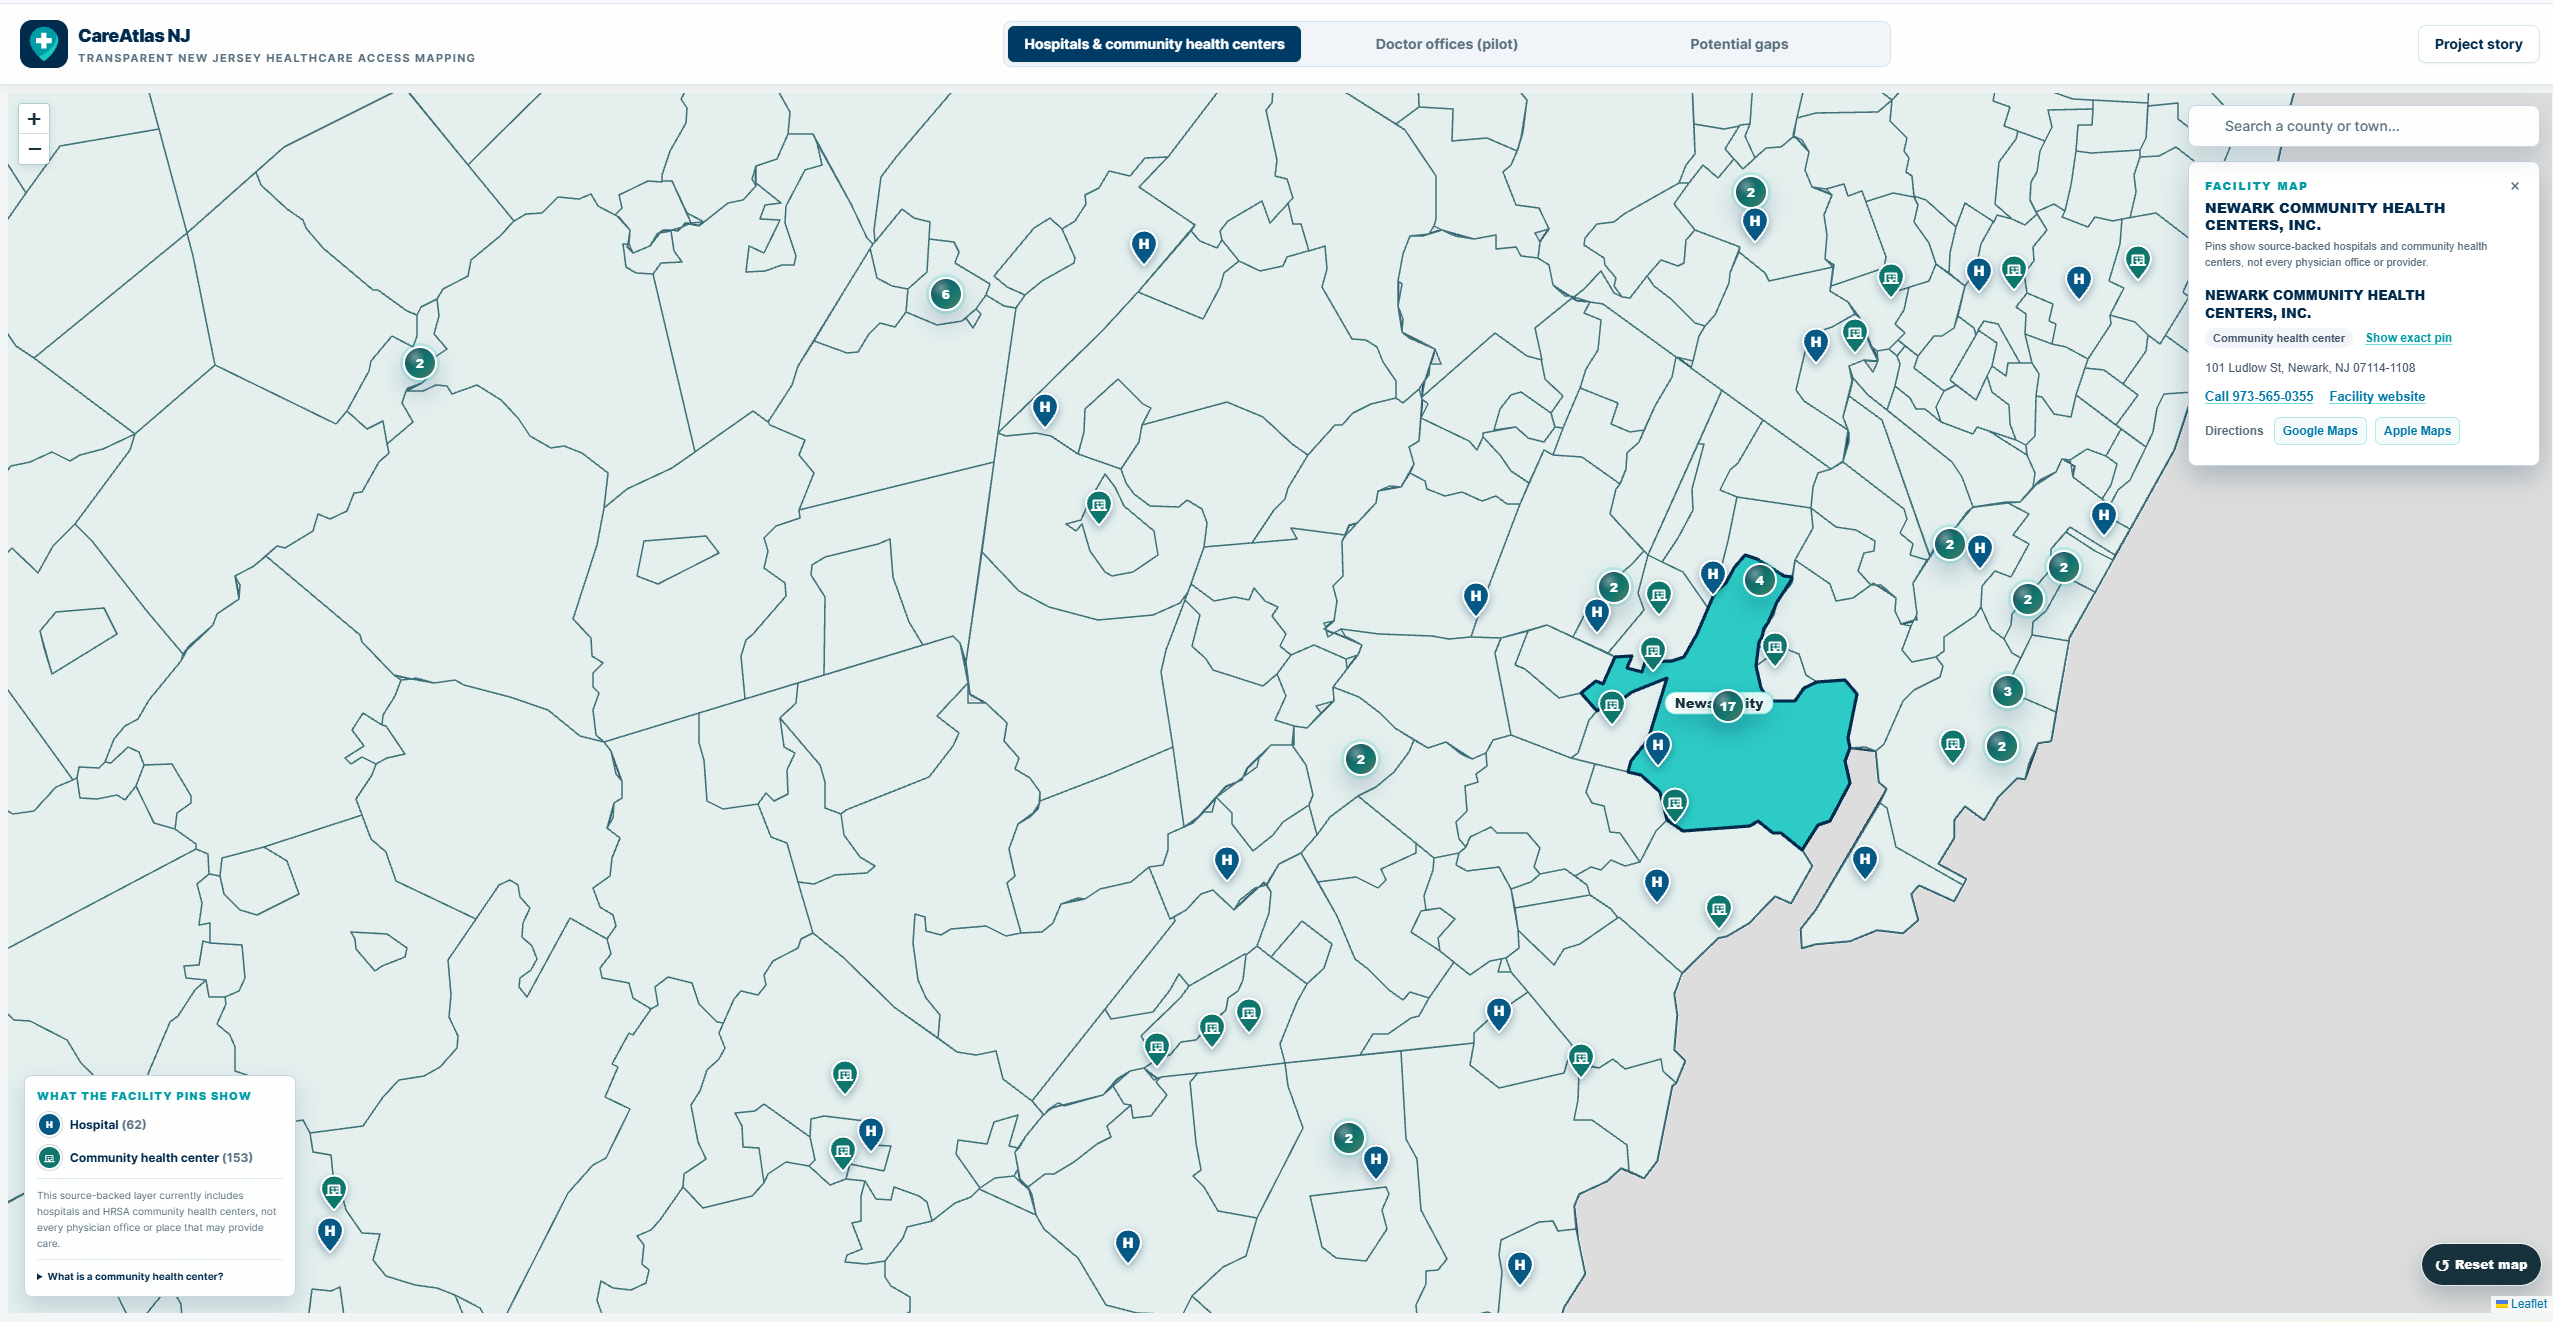
Newark City facility layer: inspect a recorded community health center's address, phone, website and directions alongside nearby care sites.
-
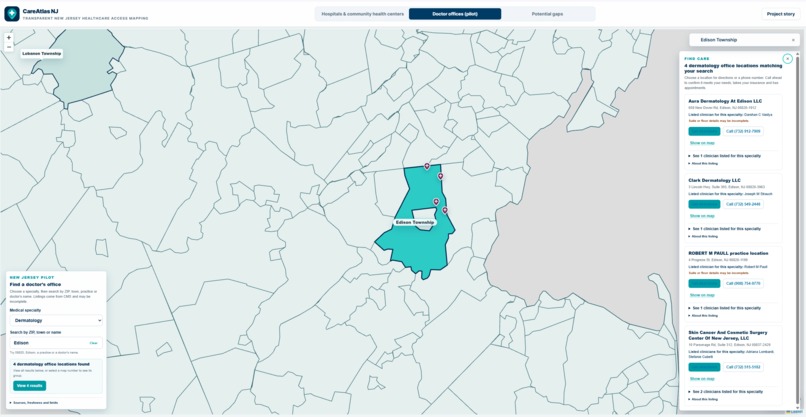
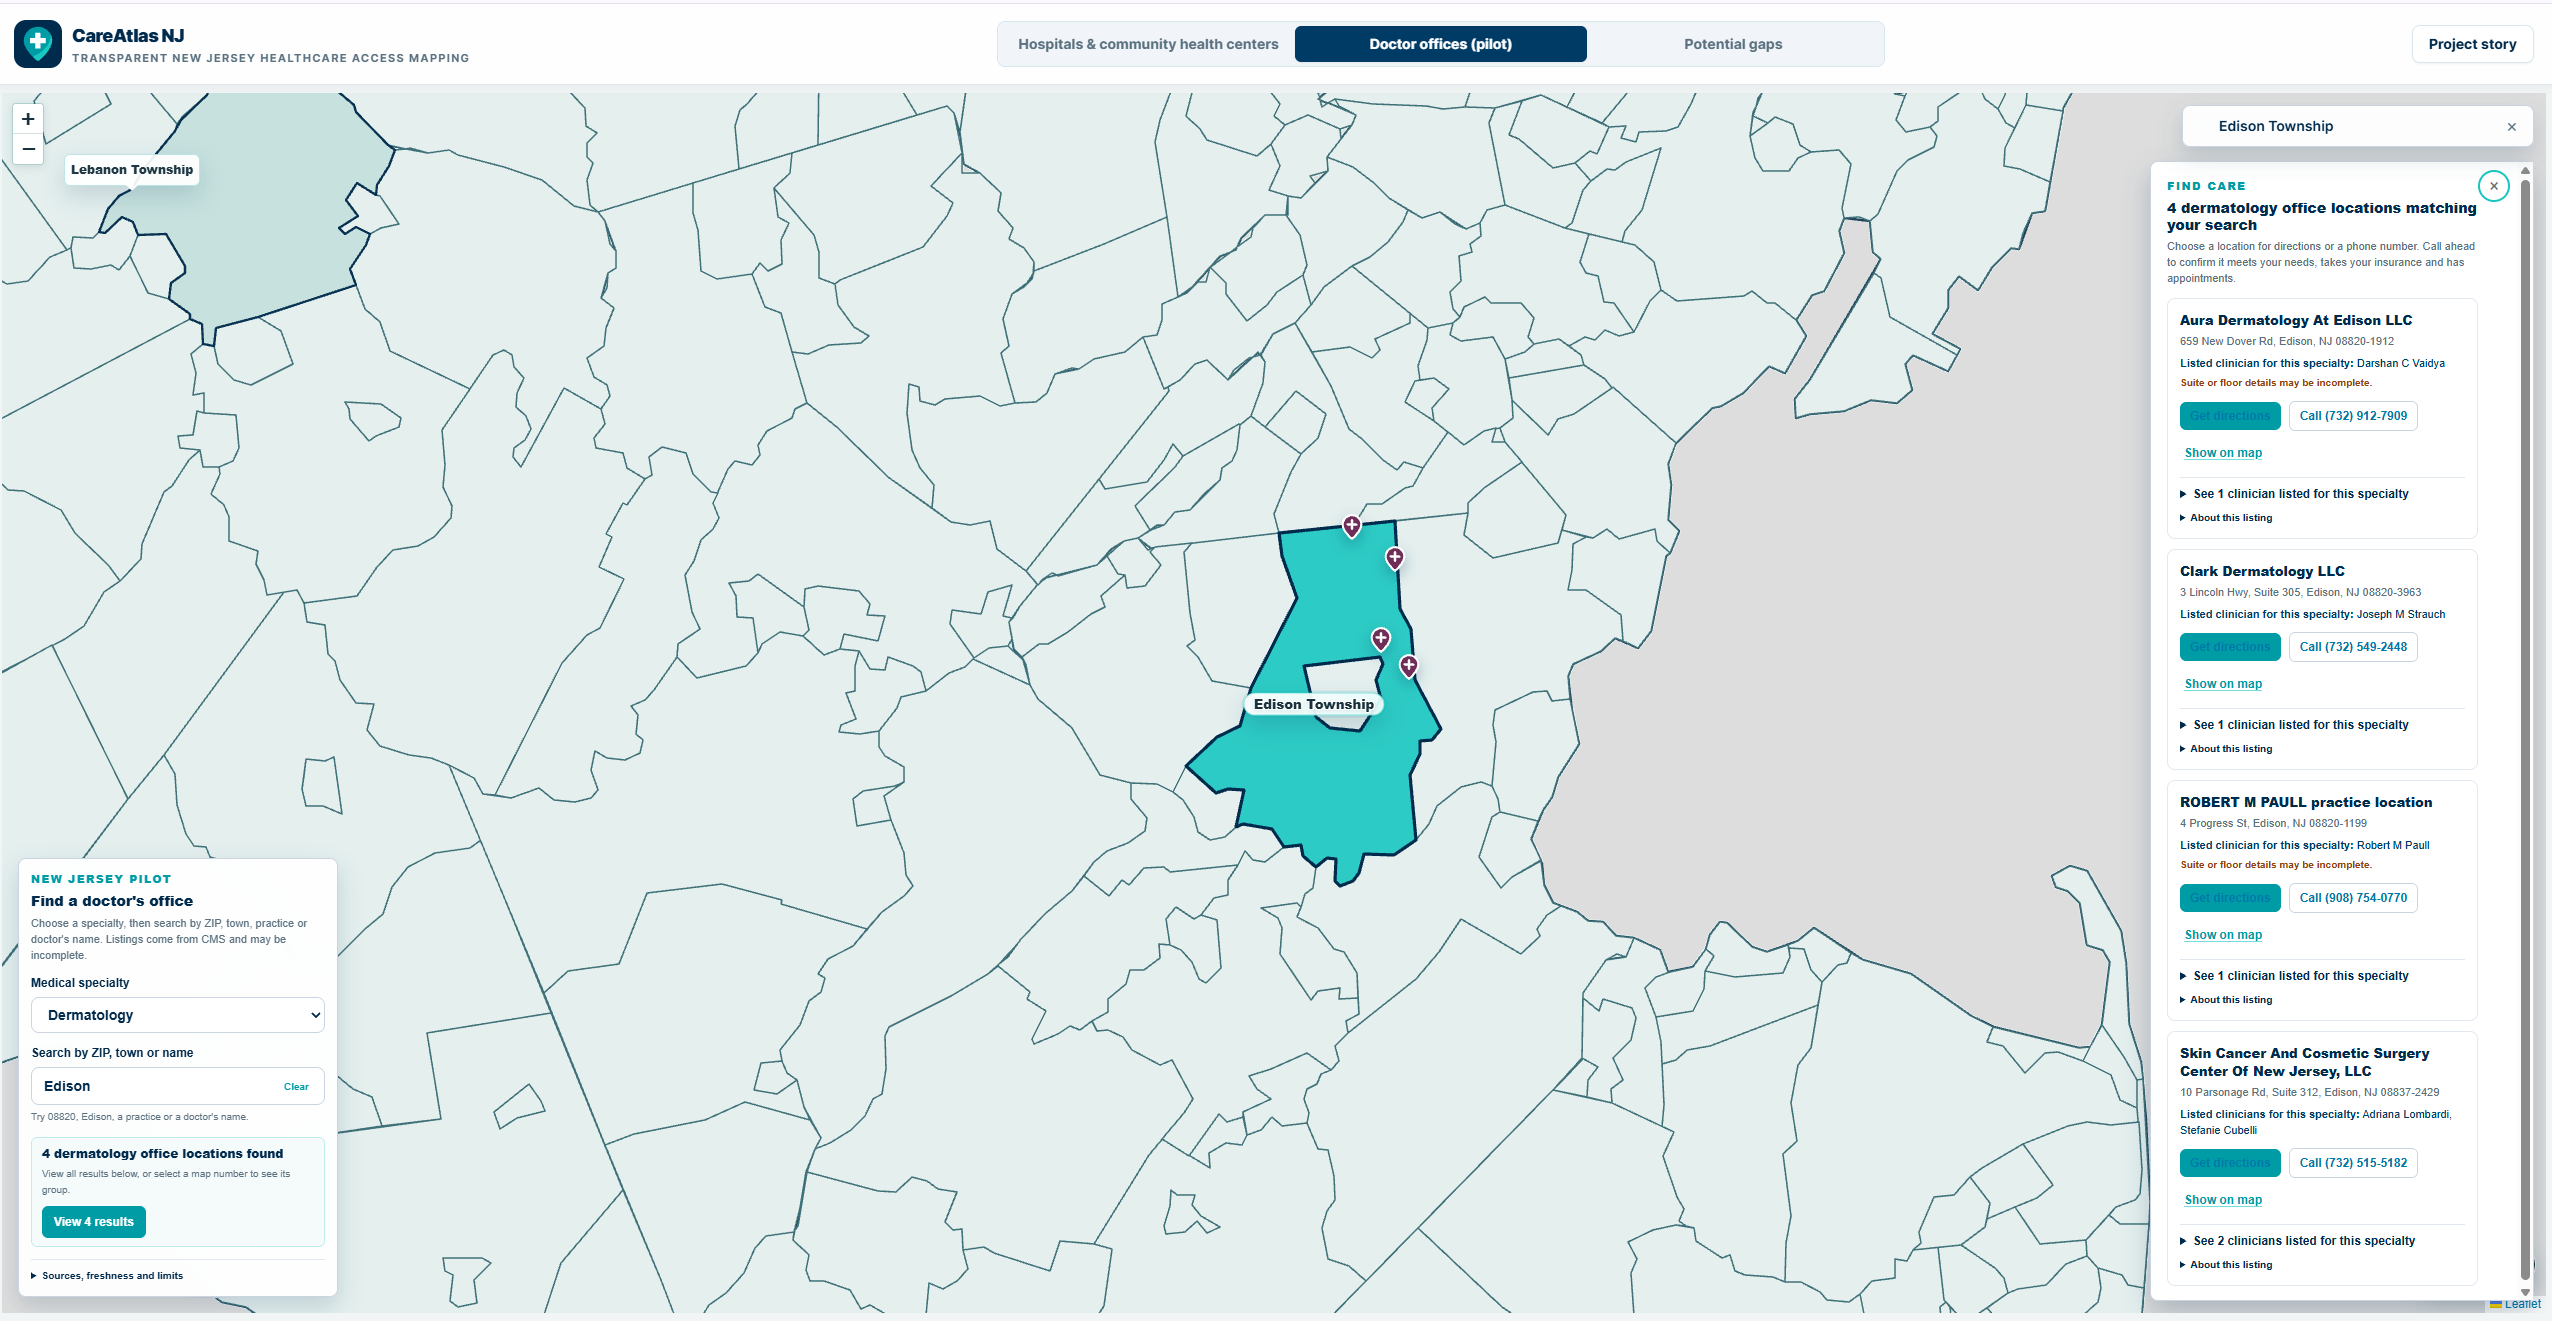
Edison dermatology search: four CMS-listed office locations with clinician names, phone numbers and directions. Call ahead to confirm.
-
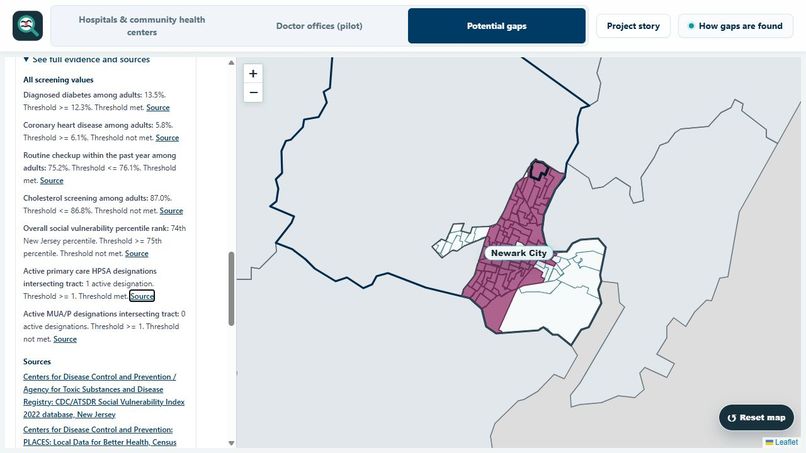
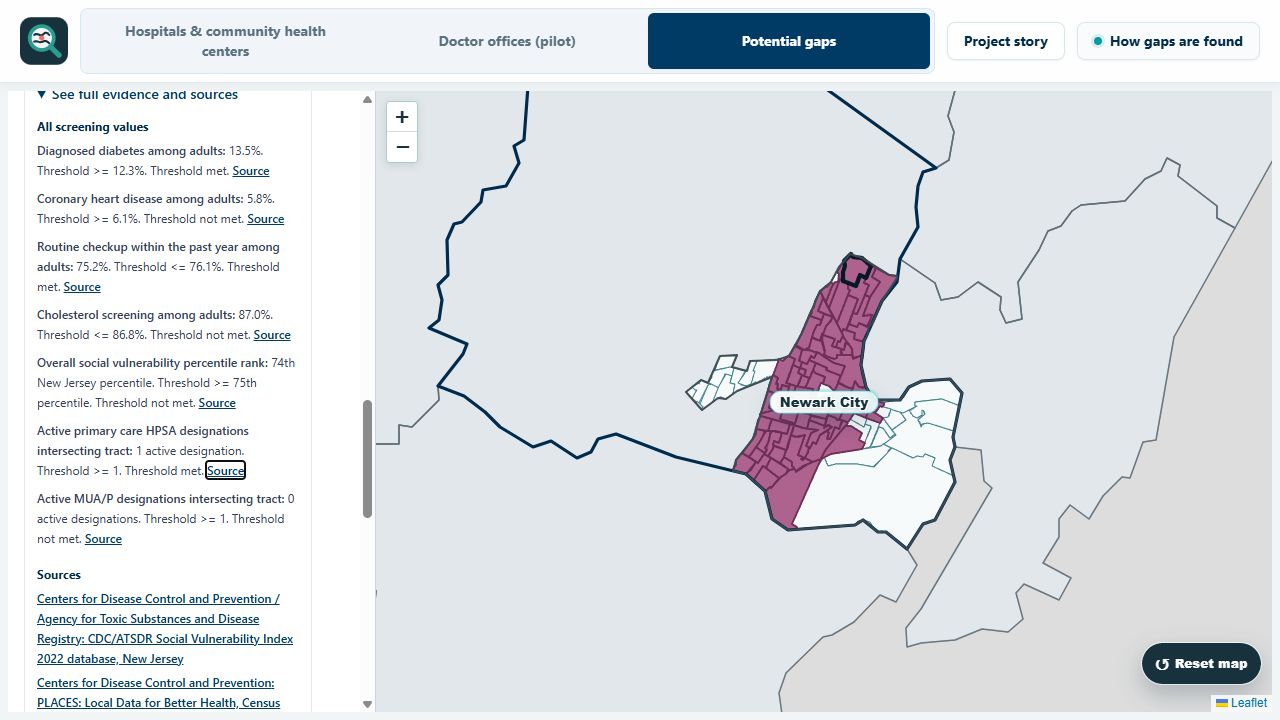
Inspect the reason for a flag: screening values, thresholds, source links and New Jersey-relative SVI ranks.
Track 03 — Open (General Technical Invention)
CareAtlas NJ turns fragmented public healthcare-access data into one transparent, explorable map.
The deployed app covers all 21 New Jersey counties, 564 municipalities and 2,181 census tracts, plus 215 source-backed hospitals and community health centers and a clearly labeled 734-location doctor-office pilot. A visitor can start with a town or address, inspect a screening result and trace its inputs, rule version, source dates and limitations.
Why Track 03: CareAtlas is a general technical invention in public-data integration and explanation—not a diagnostic tool, predictive medical model or provider ranking. Its contribution is the reproducible pipeline and interface that preserve provenance and missing values, keep care-location pins separate from tract screening, validate published records and turn official evidence into shareable briefs.
Inspiration
Finding care should not require knowing which agency publishes each part of the answer. Facility directories, community-health estimates, social-vulnerability measures, shortage designations and Census geography are published separately, use different units and dates, and can be easy to misread once combined. A map pin alone cannot establish access, while a screening flag without its evidence is hard to trust.
I built CareAtlas NJ to connect those pieces without hiding their differences. The goal is practical: help someone move from a familiar town or street address to recorded care locations and a separate, inspectable tract-level screening result, with official sources, dates, missing evidence and limitations kept visible. It does not claim that a flag proves care is unavailable or that an unflagged area has adequate access.
What it does
Start with a New Jersey town or township, or locate a tract from a street address. Three views answer different questions:
- Hospitals & community health centers: Explore 62 hospitals and 153 HRSA community health centers. Zoom from county groups to individual locations, then inspect the recorded name, contact details and directions.
- Doctor offices (pilot): Search 734 CMS-listed office locations across pediatrics, dermatology and oncology by town, ZIP, practice or clinician. Open the filtered results directly, inspect the listed clinicians, and find available phone details or directions. The snapshot is incomplete and does not confirm appointments, insurance acceptance or current operation.
- Potential gaps: Choose a county or town to explore screening results across 2,181 census tracts and New Jersey's 564 municipalities. Open a tract to read the rule's inputs, explanation, source dates and limitations. Copy a link, print a brief where offered or download the published record.
A quick tour is Newark's recorded care sites, an Edison dermatology office search, and a Newark tract's evidence brief. Each view stays distinct: the presence or absence of facility and office pins never determines a tract's screening result.
CareAtlas is a planning and explanation tool. A flag is not a diagnosis or proof that care is unavailable; no current flag is not proof that access is adequate; and a missing marker does not mean no provider exists.
How I built it
Two source-backed data paths meet in one interface. The care-location layer uses reviewed HRSA health-center and CMS hospital records, keeping per-listing provenance and contact details. The separate office pilot groups CMS clinician rows into locations, checks provider status and maps only addresses with accepted Census geocodes. The map groups nearby or colocated listings while still letting people open each one.
For the screening view, the pipeline joins official Census geography, CDC PLACES estimates, New Jersey-relative CDC/ATSDR Social Vulnerability Index ranks, and HRSA shortage designations. It preserves missing values and source provenance, applies a versioned rule, validates tract records and publishes county-sized files. Census ACS measures add context, and a geographic crosswalk connects familiar town names to tract evidence. Care-location counts do not enter the screening rule.
The interface uses React, TypeScript, Vite, Tailwind CSS and React Leaflet. Node.js supports local development; Cloudflare Workers serves the deployed app. The public repository includes setup instructions, runtime data, tests and validation scripts. The core map and checks require no private API key.
Challenges and decisions
The care directories needed careful wording: a source listing is useful for discovery, but it does not establish that an office is open or accepting a patient. I kept the office pilot's scope and source dates visible, and made filtered results reachable without hunting through map clusters. Grouped facility markers still reveal the individual recorded locations and contact options.
The screening view posed a different problem: geographic units, source dates and missing observations had to remain understandable together. A review found that the imported SVI ranks are relative to New Jersey, so I corrected the labels and explanations without changing the values or classifications. I also moved tract source dates and links closer to each result and kept facility pins separate from the rule.
Accomplishments and what I learned
CareAtlas is a working, deployed application with a reproducible local setup. Someone can start with a familiar town, open a recorded hospital or health center, search a specialty-office snapshot, and then inspect a separate tract screening result with its sources. Links and eligible printable briefs make findings easier to revisit or share. Automated checks cover data consistency, rule behavior, interface behavior and deployment packaging. An offline sensitivity analysis shows how classifications change under alternative thresholds; it does not claim the chosen thresholds are empirically validated.
This project taught me that correct computation and trustworthy interpretation are separate tasks. Unknown evidence must stay unknown, source dates must remain visible, and an explanation must preserve the limits of the original measurements.
What's next
Run resident usability sessions and obtain an independent public-health or GIS methods review, then use those findings to improve the interface and screening explanations. Neither review has been completed yet.
Development and AI assistance
I began implementation on August 1, 2026 and have not entered substantially the same project in another hackathon. GitHub history begins September 5 because I uploaded an existing local worktree in installments; those commits are an upload chronology, not a day-by-day build record. Some imported source, review and generated artifacts retain earlier June/July date fields. Those fields do not record CareAtlas implementation activity; I preserve and disclose them rather than silently rewriting historical metadata. The August 1 start is my author attestation and cannot be independently reconstructed from the later Git history.
OpenAI ChatGPT/Codex assisted with development, debugging, tests, documentation and submission preparation. Google Gemini is an optional explanation integration, disabled in the demonstrated deployment; it does not calculate screening results.
Methods, source versions, reuse notes and sensitivity analysis are available in the repository.
Built With
- carto
- cdc-places
- cdc-svi
- census
- census-acs
- census-geocoder
- cloudflare-workers
- cms
- google-gemini
- hrsa
- leaflet.js
- node.js
- nppes
- openstreetmap
- react
- react-leaflet
- tailwindcss
- tigerweb
- typescript
- vite
- vitest

Log in or sign up for Devpost to join the conversation.