-
-
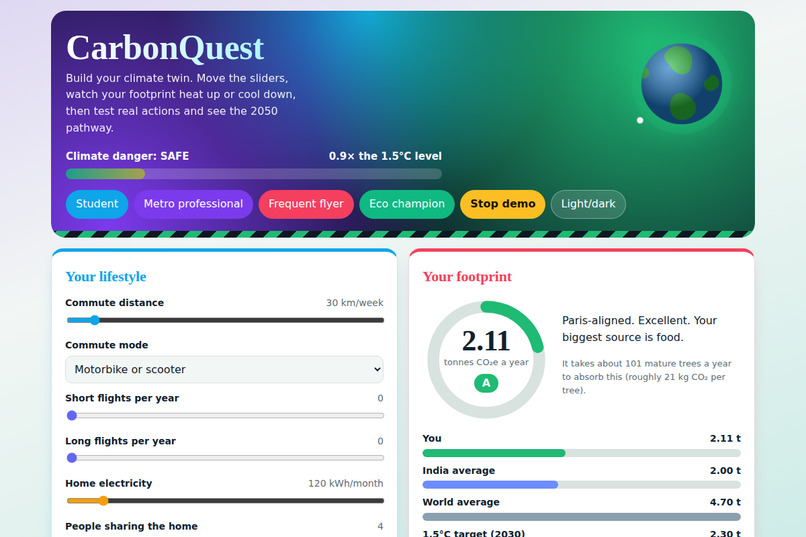
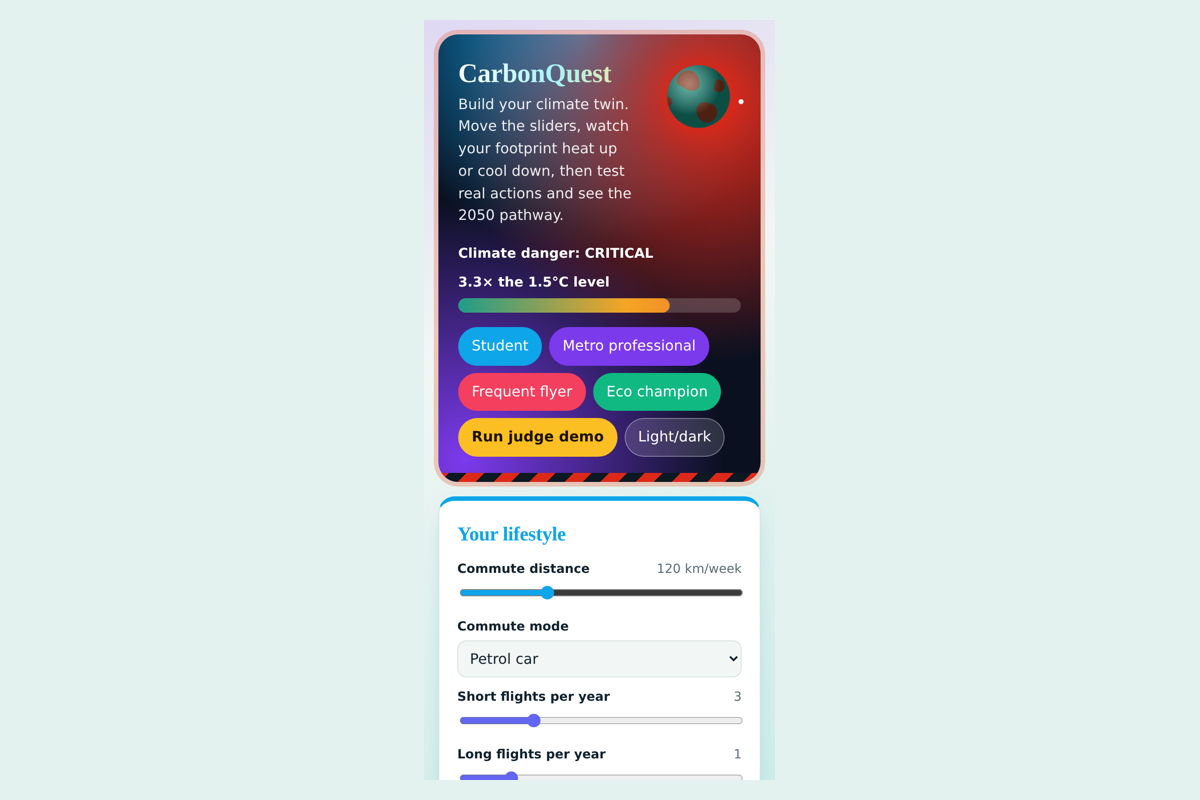
Build your climate twin. Pick a persona or move the sliders and watch the page heat up or cool down with your footprint.
-
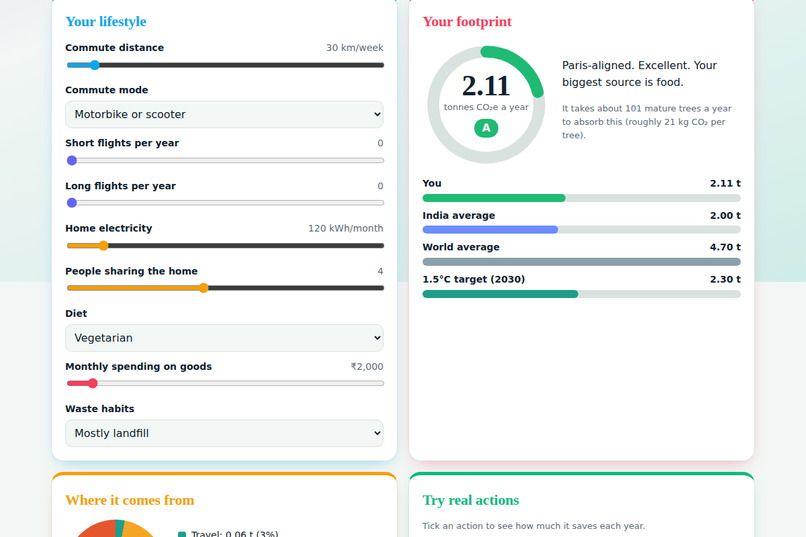
One-click judge demo with a live climate danger meter, footprint ring and letter grade.
-
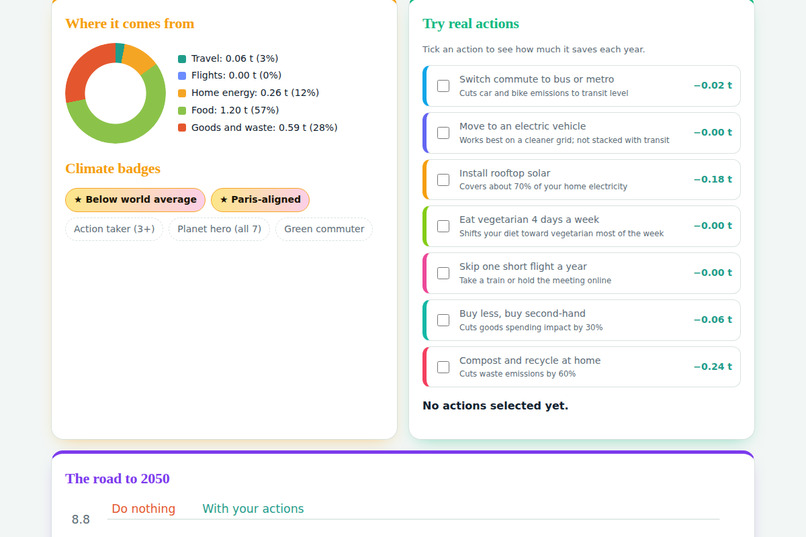
Tick real-world actions to see what each saves per year, and earn climate badges along the way.
-
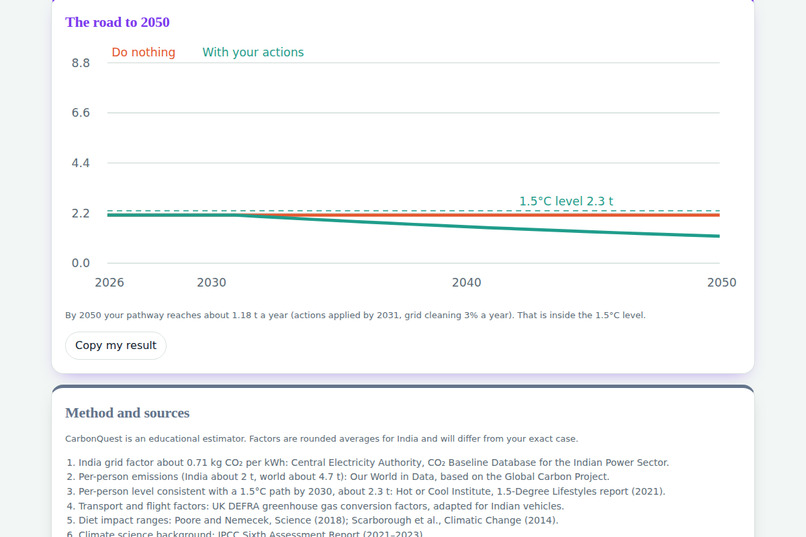
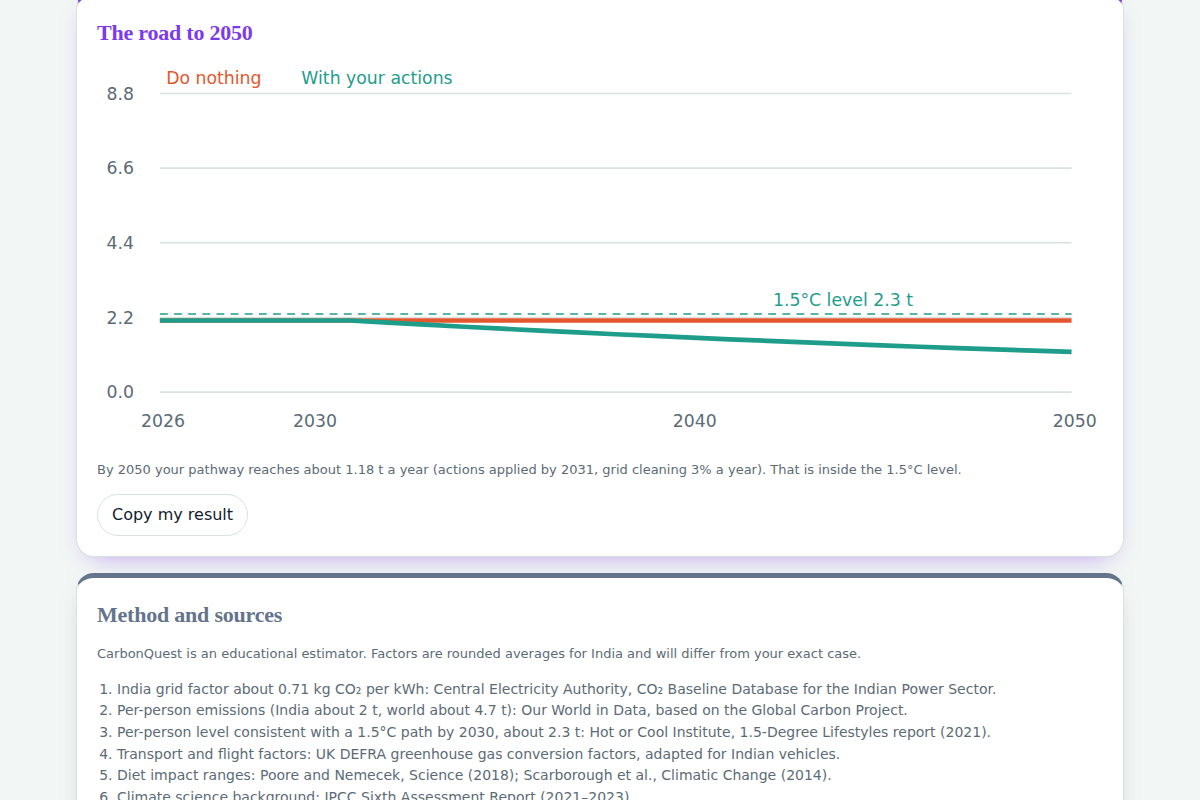
The road to 2050: see where your current habits lead and how much your chosen actions change that path.
-
The road to 2050: see where your habits lead and how actions change the path.
-
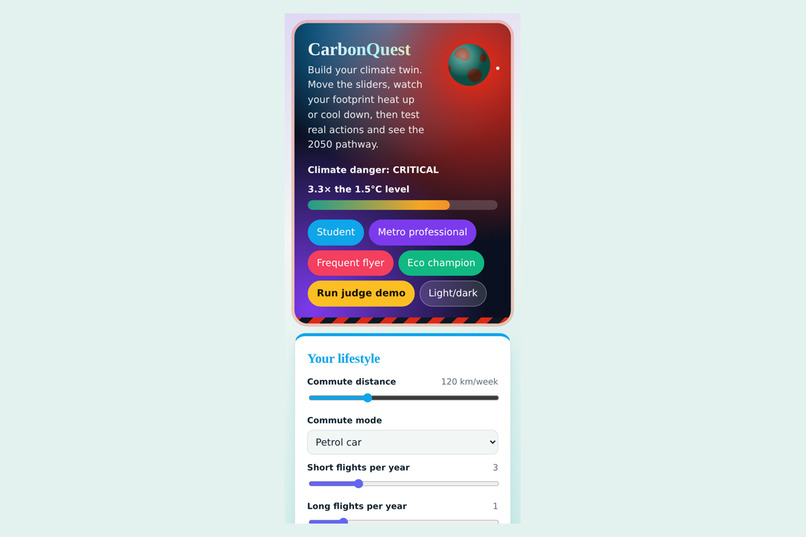
The same experience on a phone, built as a single lightweight page with no installs.
Inspiration
Most carbon calculators give you one number and leave you there. You find out you emit "4.2 tonnes" a year, feel a bit guilty, and close the tab. We wanted something that answers the question people actually ask: "What would my life look like if I changed one thing?"
CarbonQuest builds a climate twin: a living model of your year that heats up or cools down as you move the sliders. It is designed for India, using the Indian grid, Indian vehicles, scooters, metros and rupee spending, so the result feels like your life rather than a Western default.
What it does
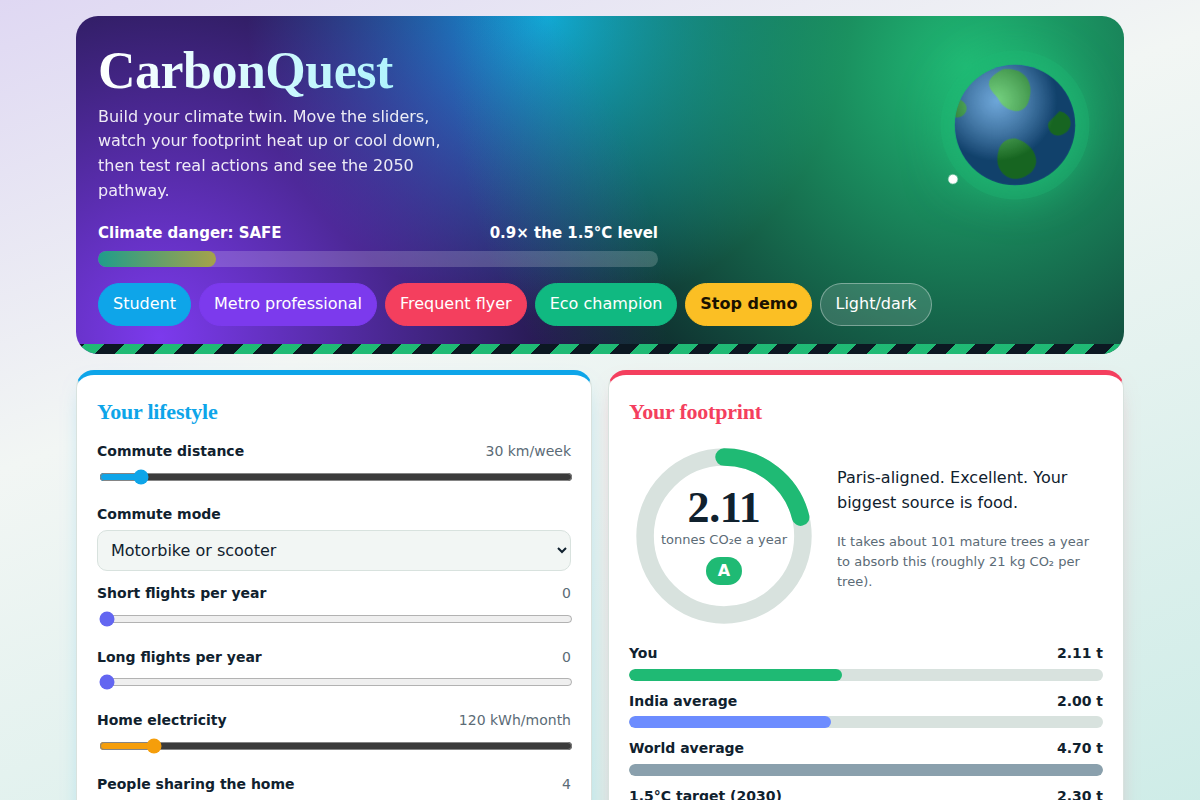
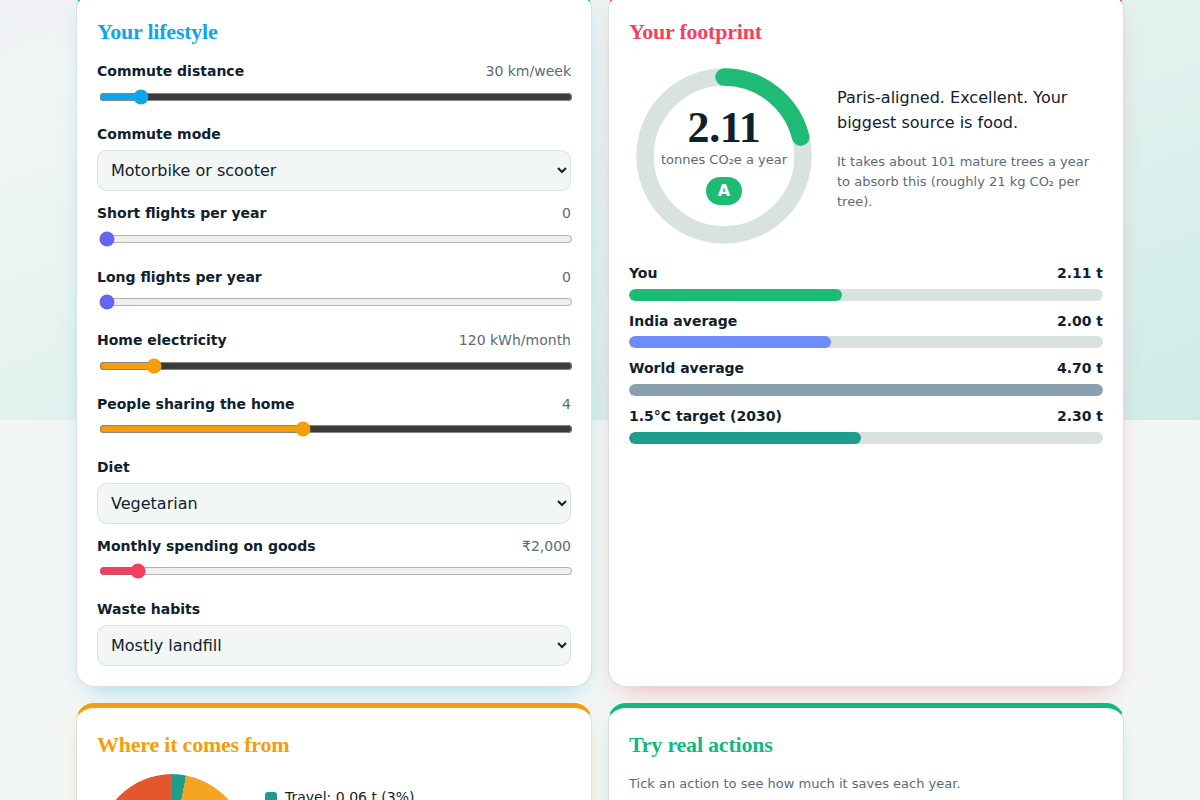
- Lifestyle sliders: commute distance and mode (petrol, diesel, electric, motorbike, bus or metro, walk or cycle), short and long flights, home electricity, people sharing the home, diet, monthly spending and waste habits.
- Live footprint ring: your annual footprint in tonnes of CO₂e, a letter grade, a plain-language verdict that names your biggest source, and the number of mature trees needed to absorb it.
- Benchmarks you can see: your result is compared with the India average (about 2 t), the world average (about 4.7 t) and the 1.5 °C-aligned level for 2030 (about 2.3 t).
- Climate danger meter: the hero section changes colour and mood with your footprint, from safe to dangerous.
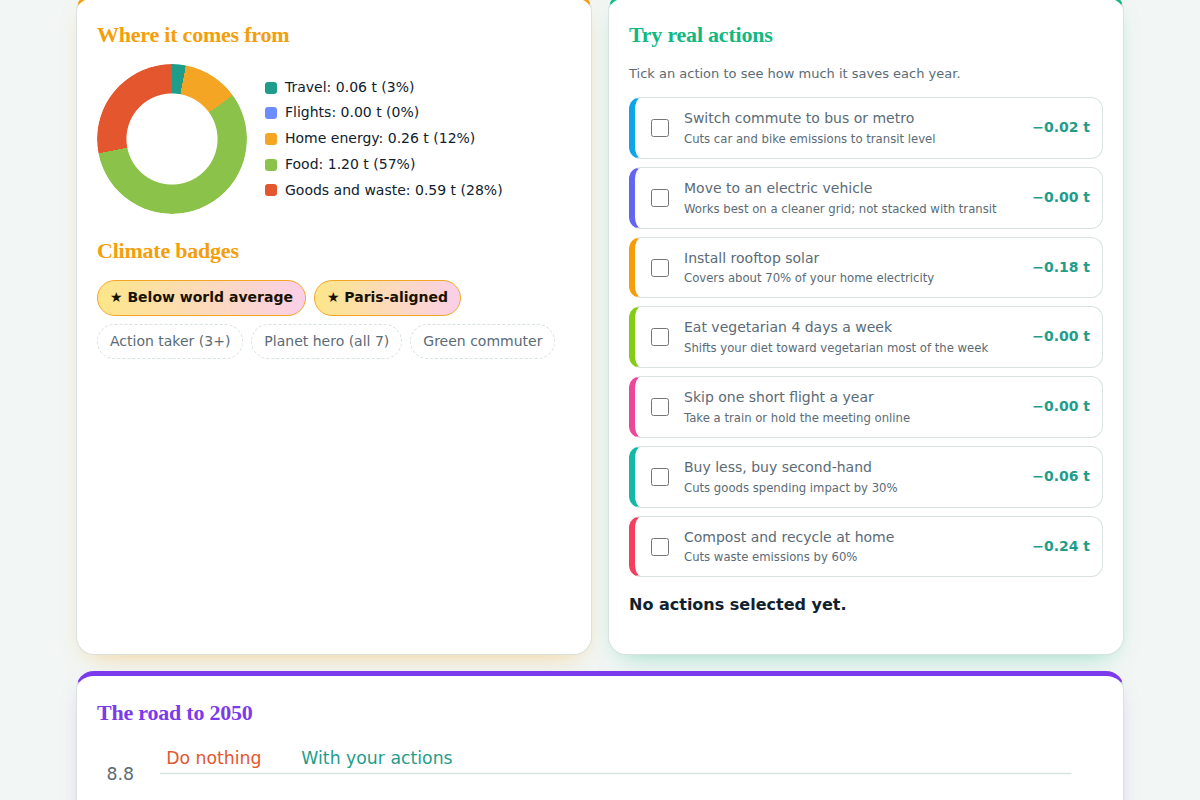
- "Where it comes from": a breakdown of what drives your emissions.
- Personas: one tap loads a Student, Metro professional, Frequent flyer or Eco champion, so you can compare lifestyles instantly.
- Try real actions: tick an action and see how much it saves each year.
- The road to 2050: a pathway view of where your habits lead over time.
- Climate badges, a "Copy my result" button, light and dark mode, and a one-click judge demo that walks through the whole experience.
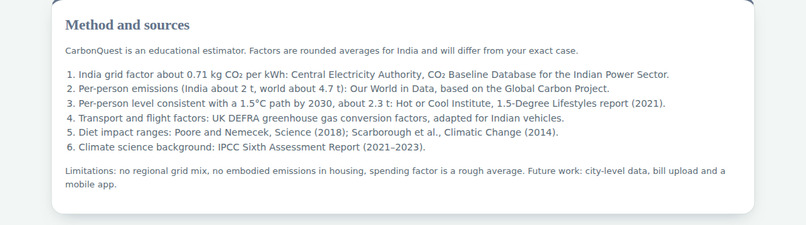
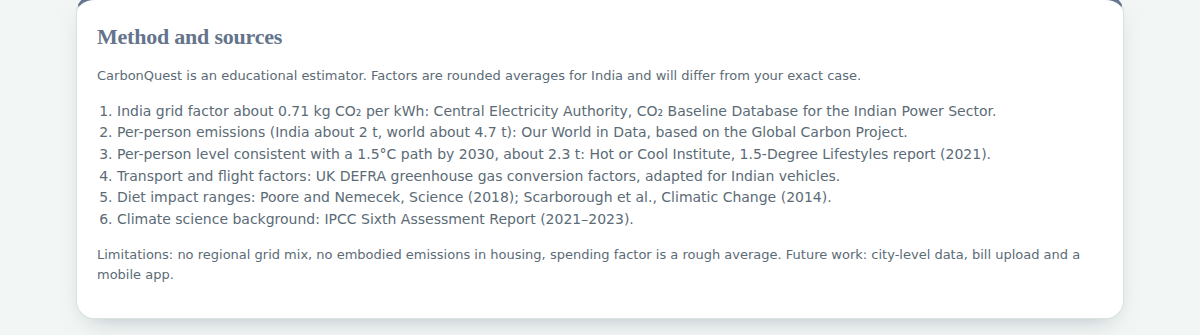
- Method and sources: every factor is documented, with limitations stated openly.
How we built it
CarbonQuest is a single self-contained web page in plain HTML, CSS and JavaScript, with no framework, no build step and no external dependencies. That keeps it fast, easy to open anywhere, and usable on a phone. The footprint model, the grading, the action engine and the 2050 pathway are all written from scratch.
The model adds five categories:
$$ E_{\text{total}} = E_{\text{transport}} + E_{\text{power}} + E_{\text{food}} + E_{\text{goods}} + E_{\text{waste}} $$
For example, home electricity is shared across the household:
$$ E_{\text{power}} = \frac{kWh_{\text{month}} \times 12 \times 0.71}{1000 \times N_{\text{household}}} \ \text{tCO}_2\text{e/year} $$
The emission factors and benchmarks come from published sources:
- Indian grid factor, about 0.71 kg CO₂ per kWh: Central Electricity Authority, CO₂ Baseline Database.
- Per-person emissions for India and the world: Our World in Data, based on the Global Carbon Project.
- The 1.5 °C-aligned level, about 2.3 t per person by 2030: Hot or Cool Institute, 1.5-Degree Lifestyles (2021).
- Transport and flights: UK DEFRA conversion factors, adapted for Indian vehicles.
- Diet ranges: Poore and Nemecek (Science, 2018) and Scarborough et al. (Climatic Change, 2014).
- Climate science background: IPCC Sixth Assessment Report.
Challenges we ran into
- Honest numbers from imperfect data: factors come from different years and mix CO₂ and CO₂e. We kept the model simple, rounded sensibly, and documented limitations inside the app instead of hiding the uncertainty.
- Making it feel alive without being a gimmick: the hero colours, the ring and the grade had to react smoothly while staying tied to real numbers.
- Representing India properly: most public tools assume a Western grid and car-centred commutes, so we adapted vehicle factors and added scooters and metro travel.
- Fitting everything on a phone: a dense, slider-heavy interface had to stay readable and touch-friendly on small screens.
Accomplishments that we're proud of
- A complete, polished experience in one file that works offline and loads instantly.
- A footprint tool that is tuned for Indian users, with every factor traceable to a named source.
- Personas and a judge demo that let anyone understand the product in under a minute.
- Turning a guilt-inducing number into something people can experiment with.
What we learned
A few big levers decide most footprints: commute mode, electricity, flights and diet. Seeing the effect of one change next to a single slider is far more motivating than a total score. We also learned how much household size changes the per-person result, and how important it is to be open about what a simple model cannot capture.
What's next for CarbonQuest
- City-level and state-wise grid data.
- Bill upload, so users can use real electricity and fuel numbers.
- Hindi and Marathi language support.
- Saved progress and weekly challenges.
- A mobile app, so tracking becomes a habit rather than a one-time check.


Log in or sign up for Devpost to join the conversation.