-
-
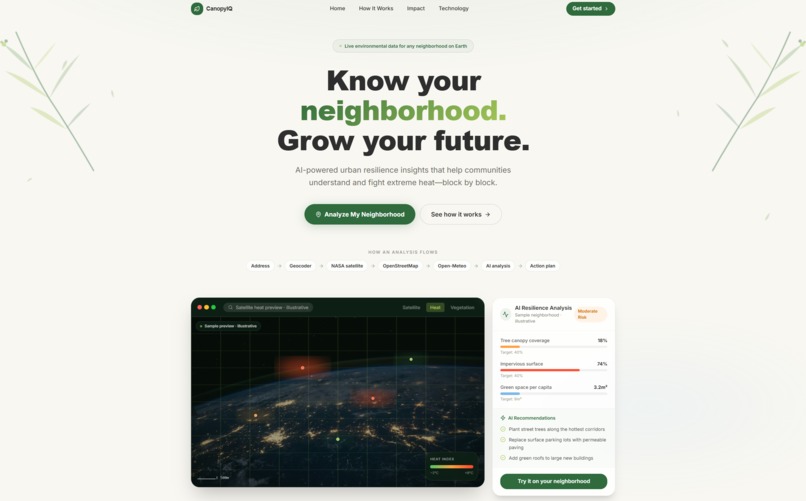
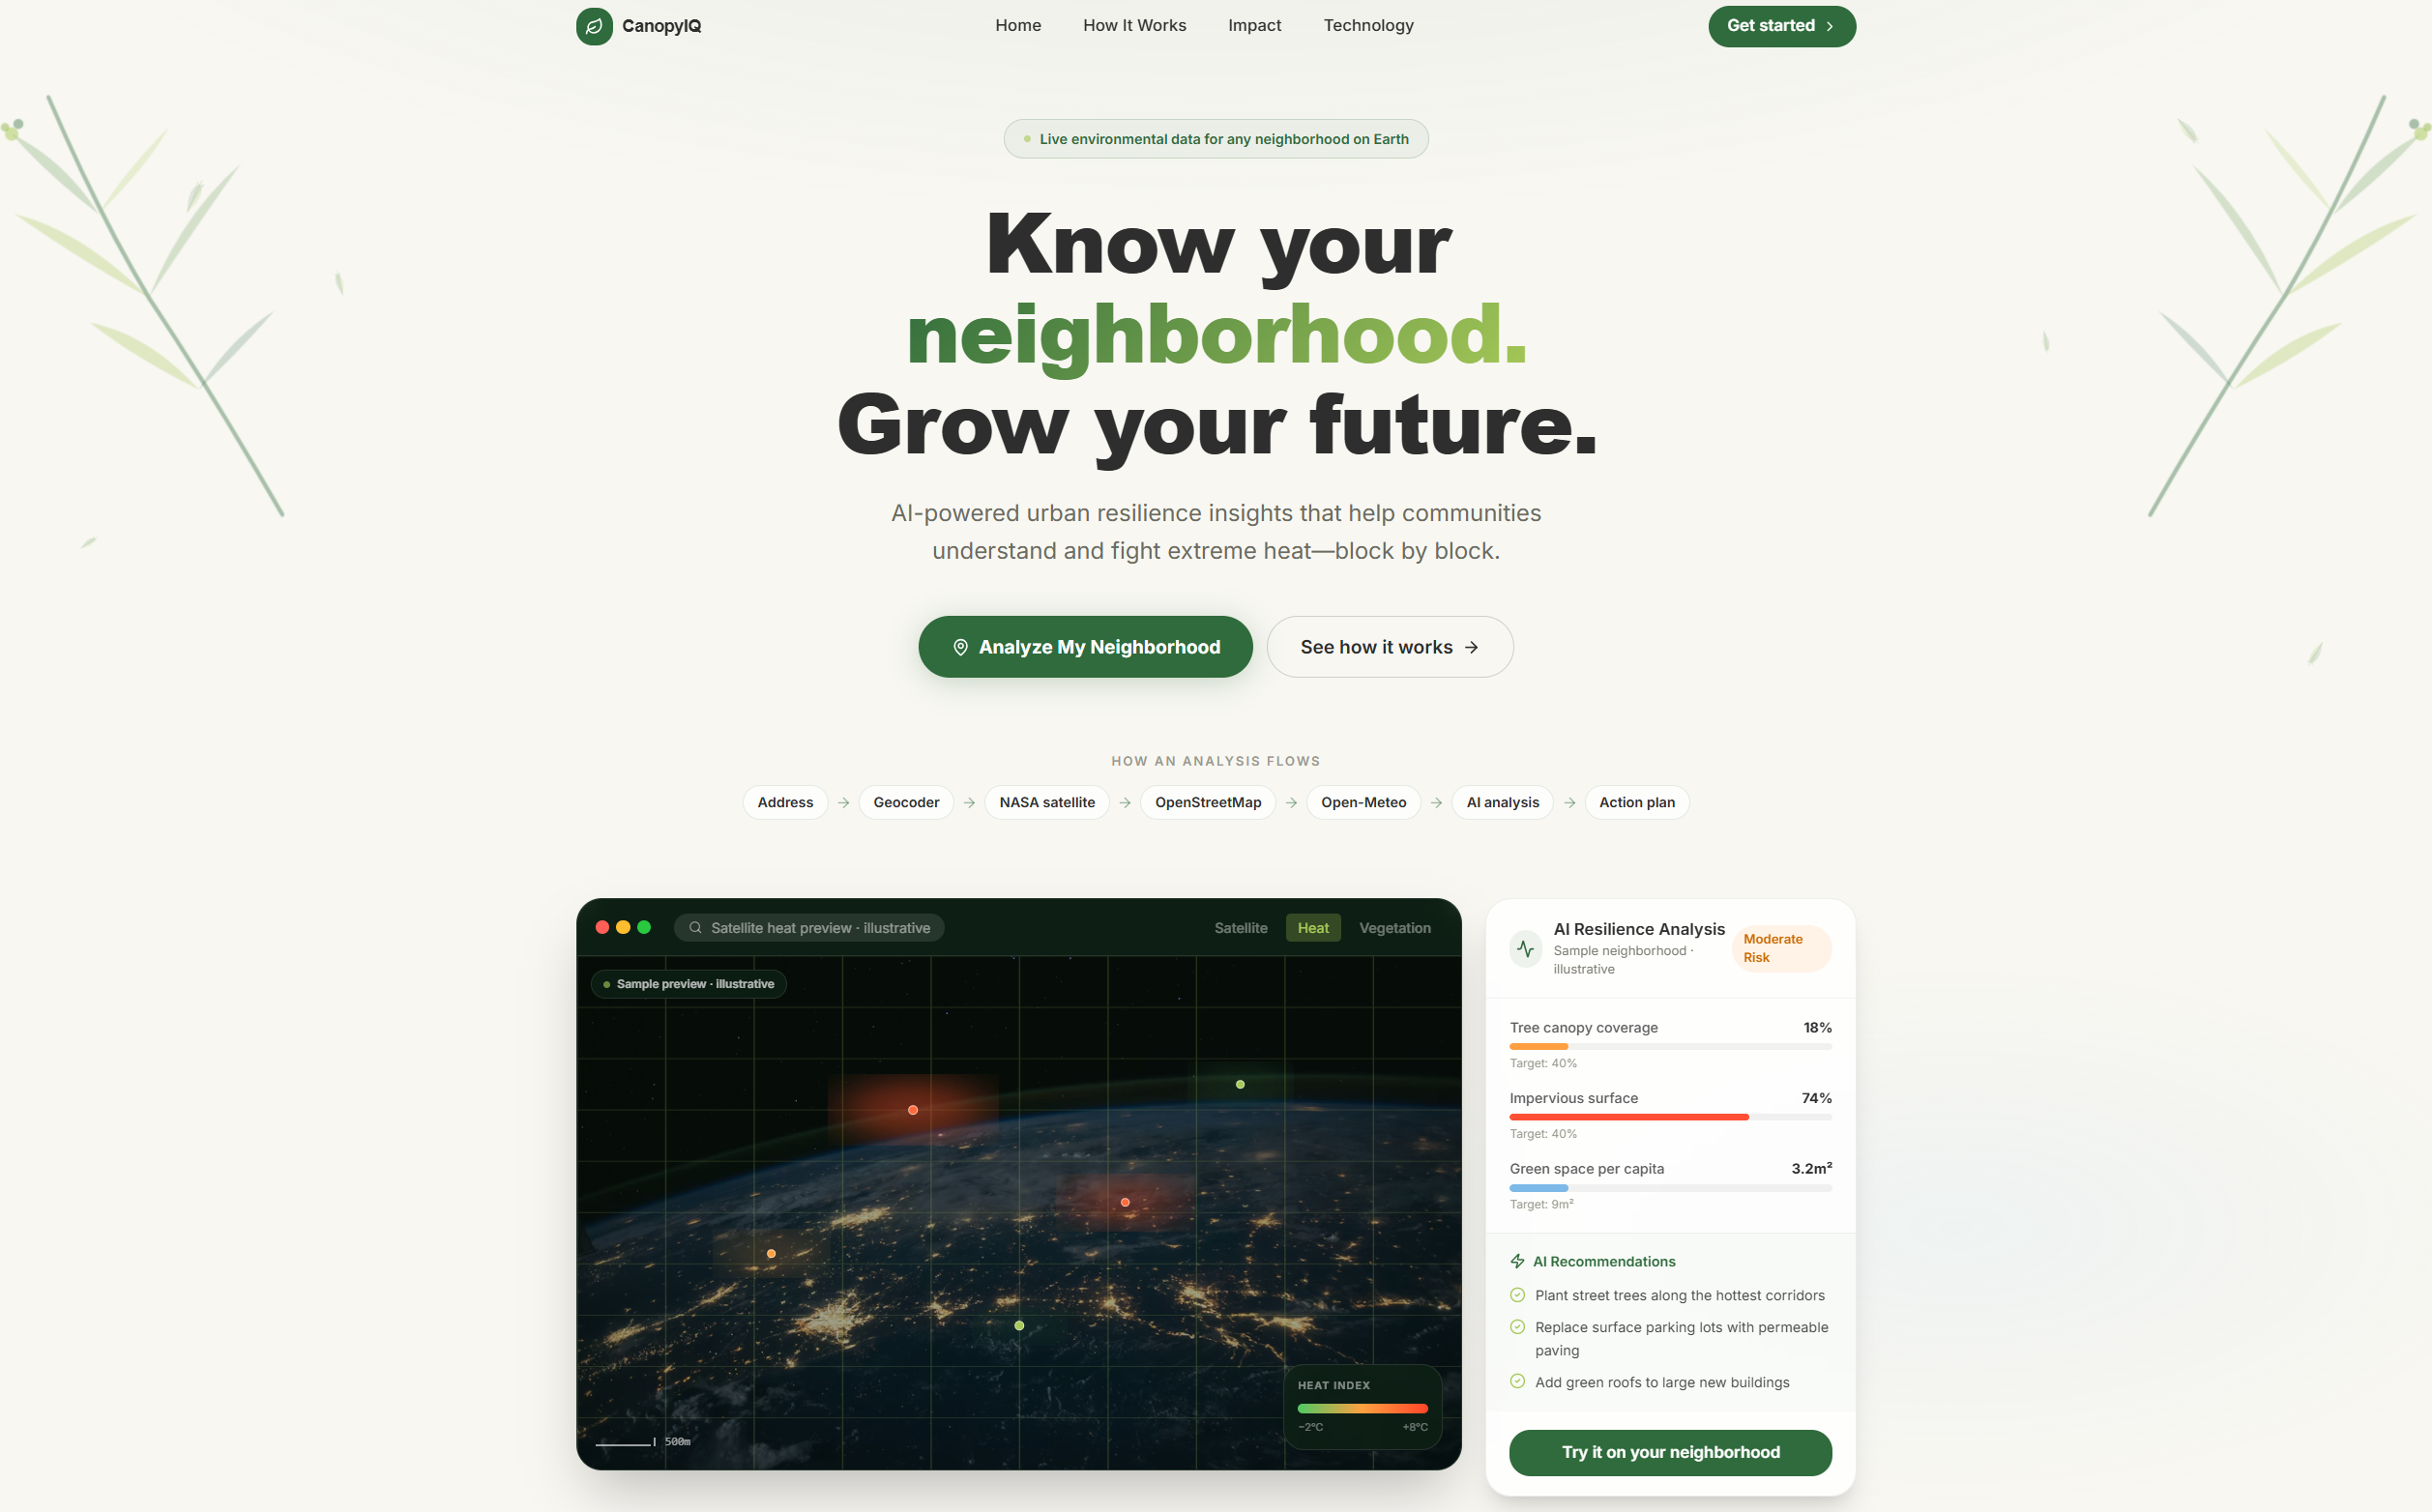
Know your neighborhood. Grow your future.
-
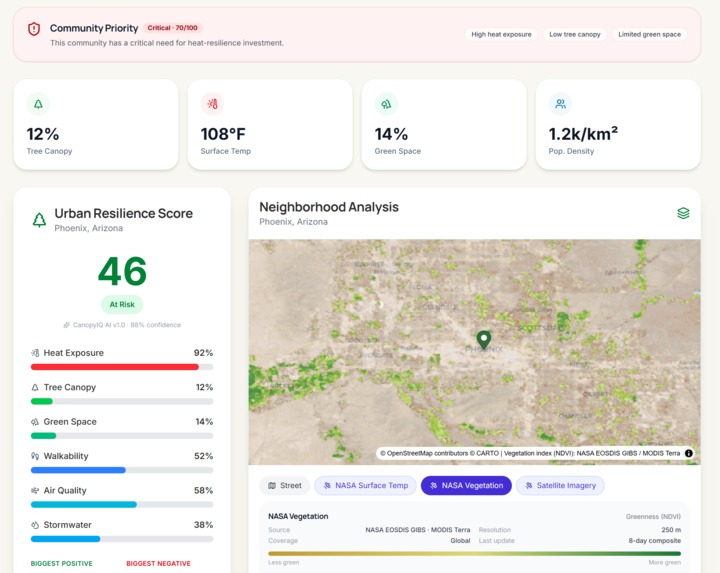
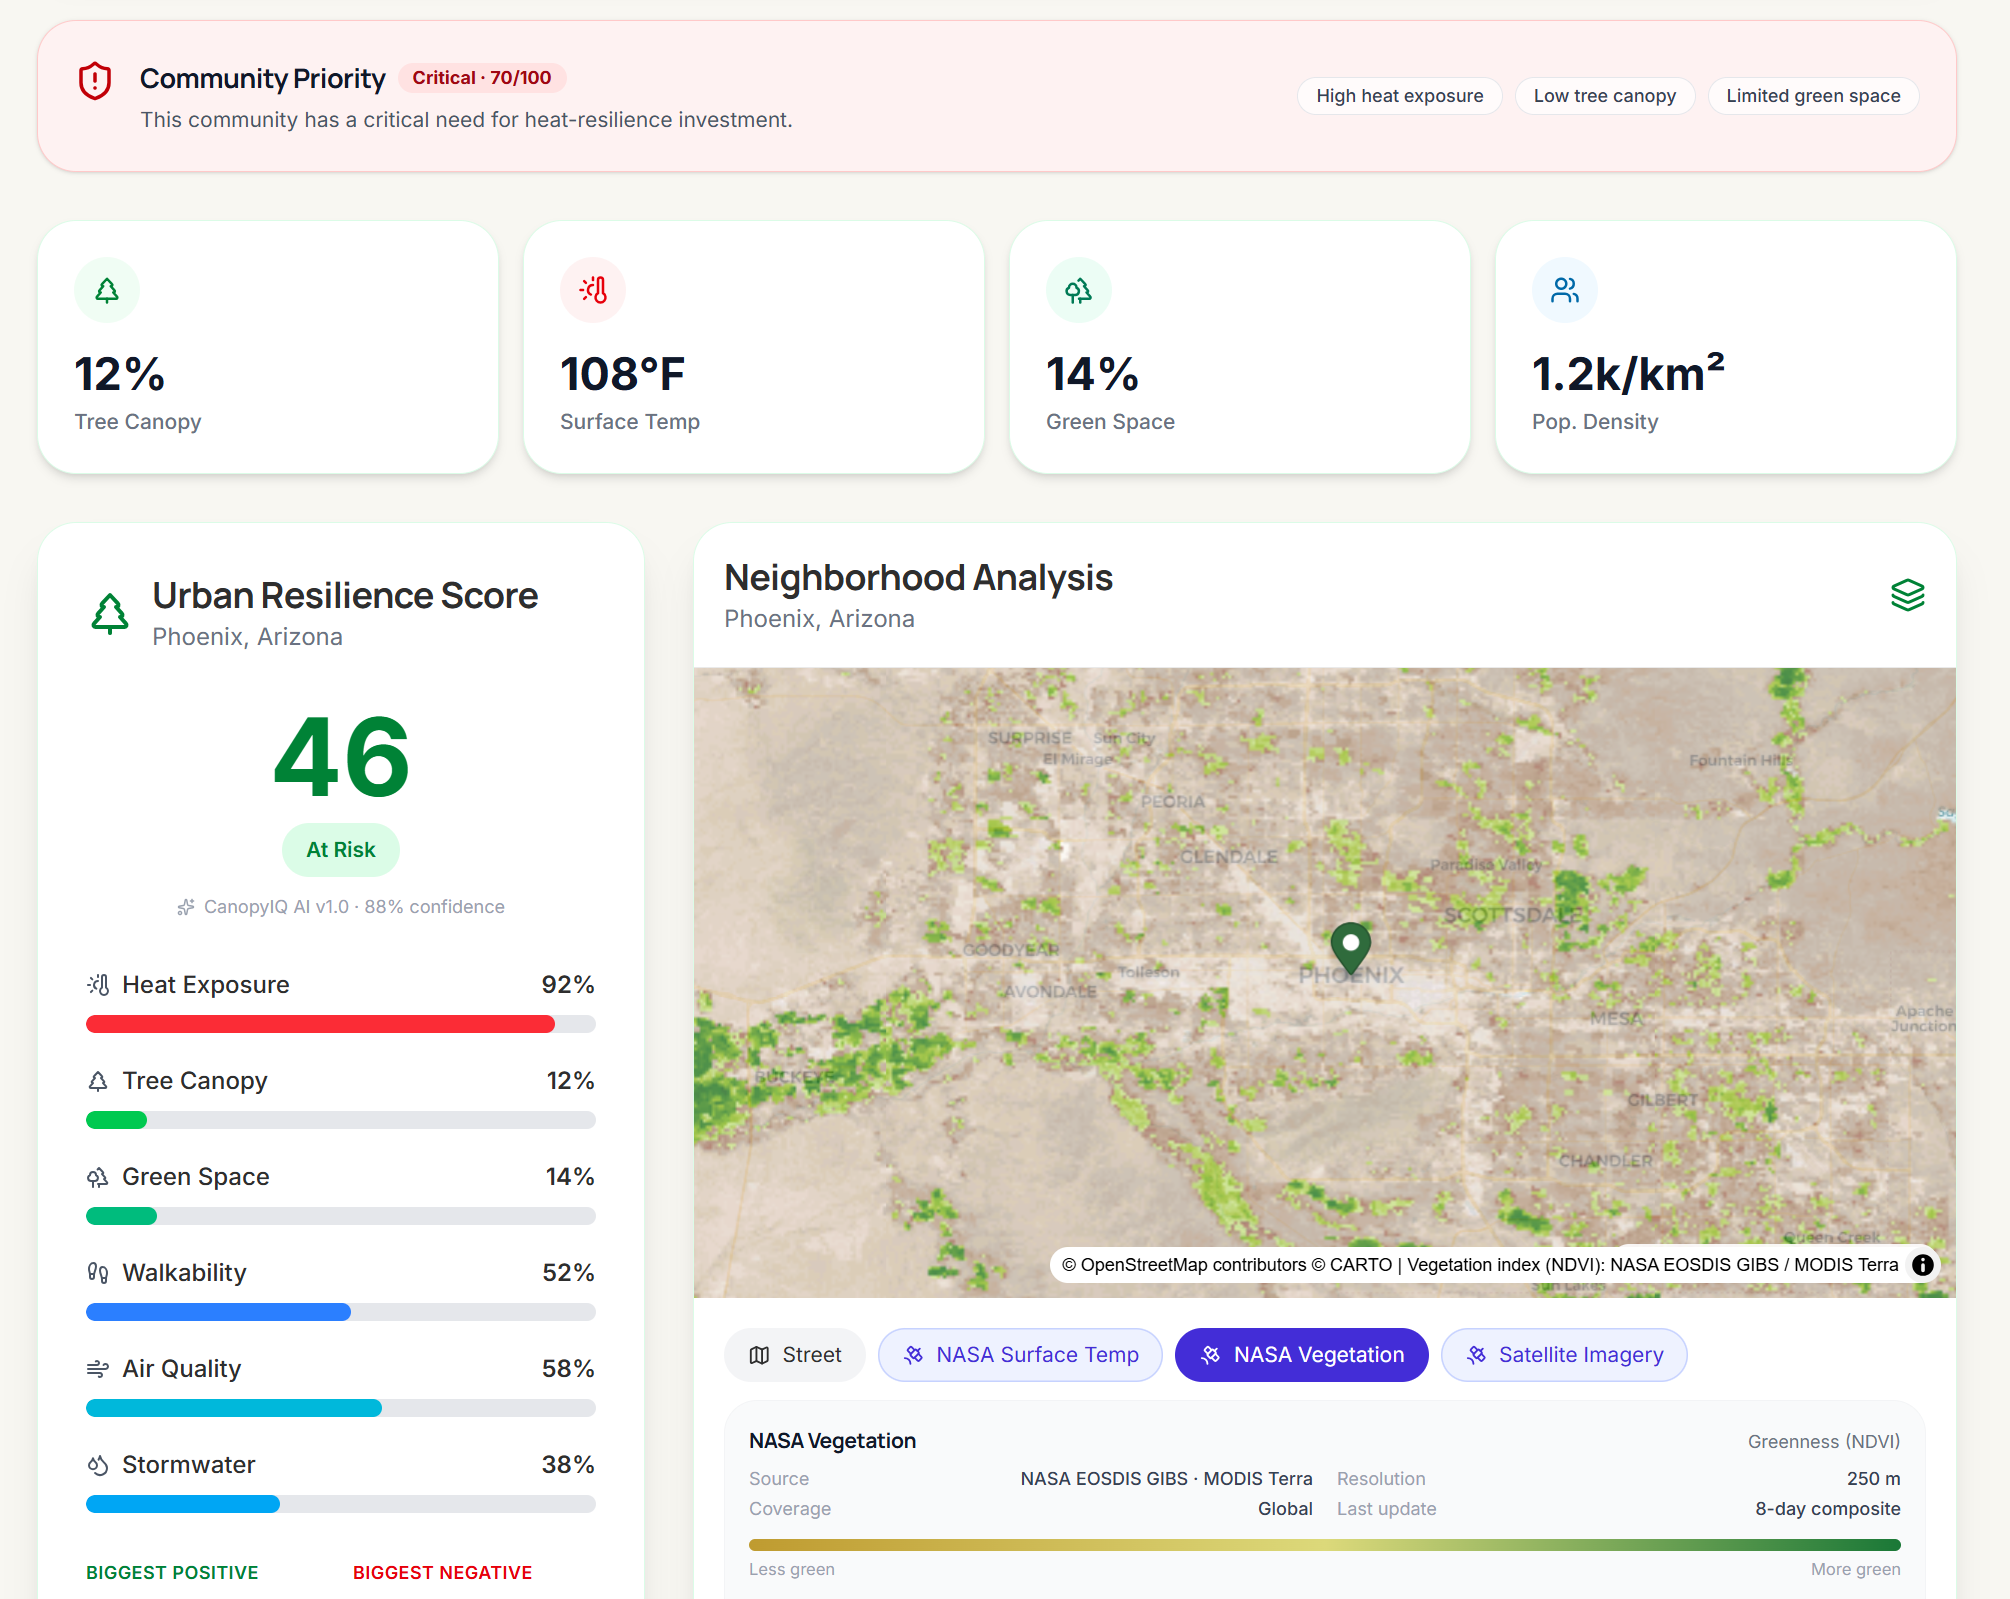
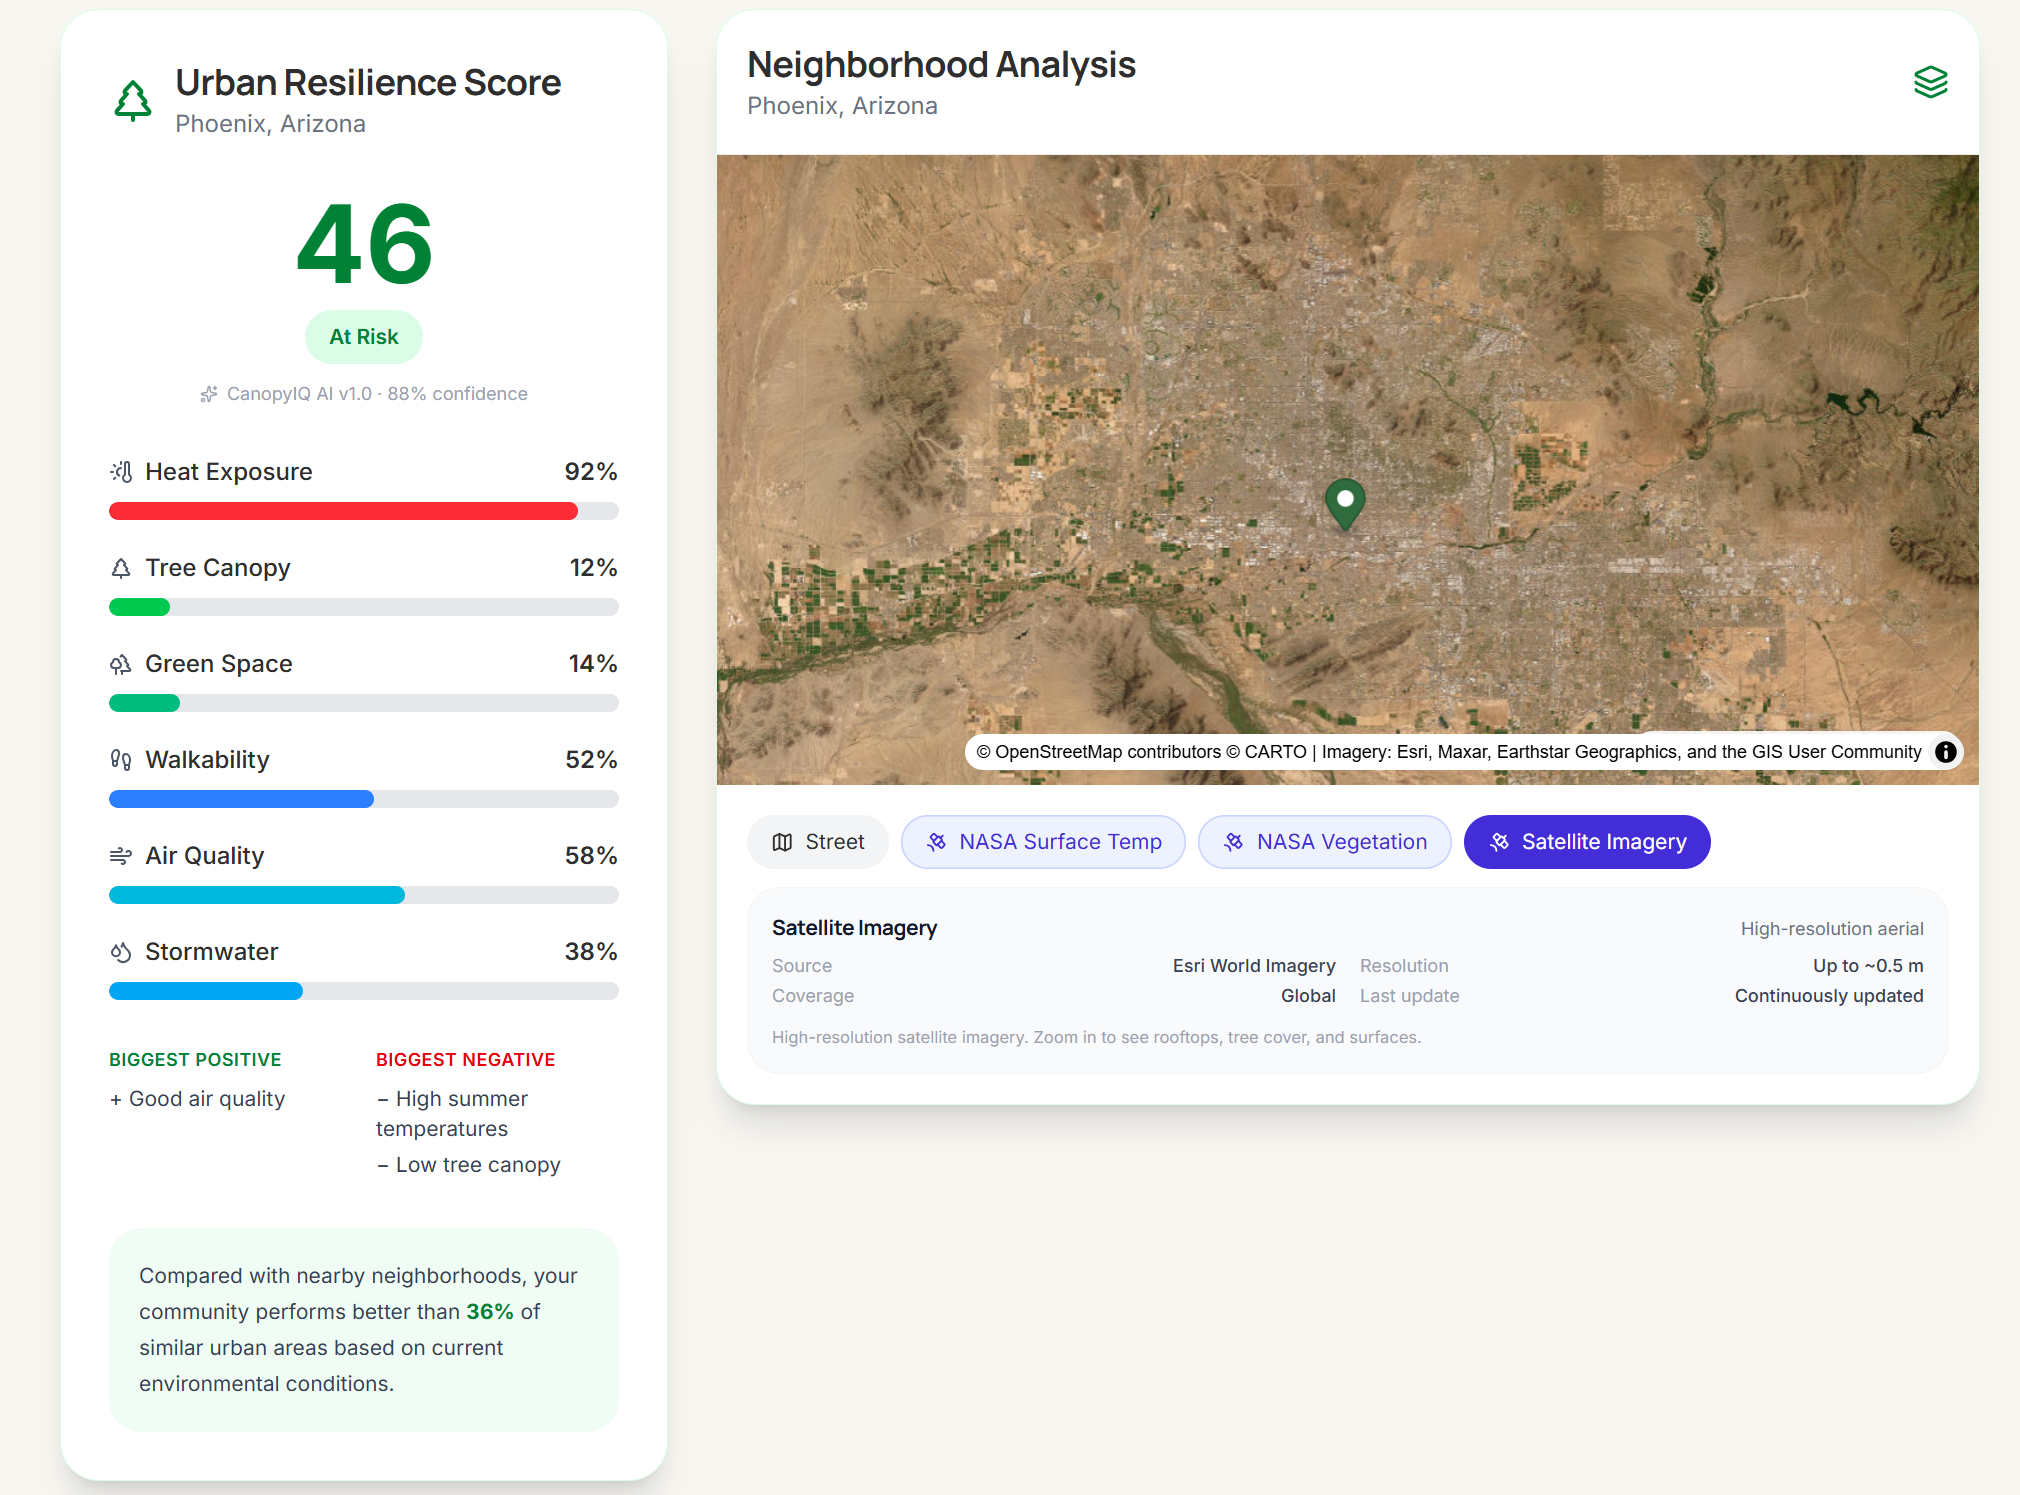
Your neighborhood's Urban Resilience Score, built from live NASA satellite data.
-
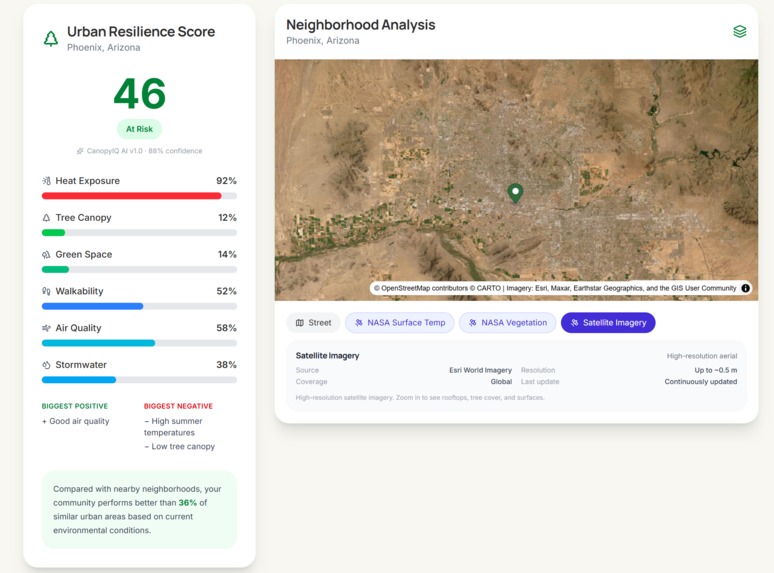
Critical heat, mapped block by block, so cities know where to act first.
-
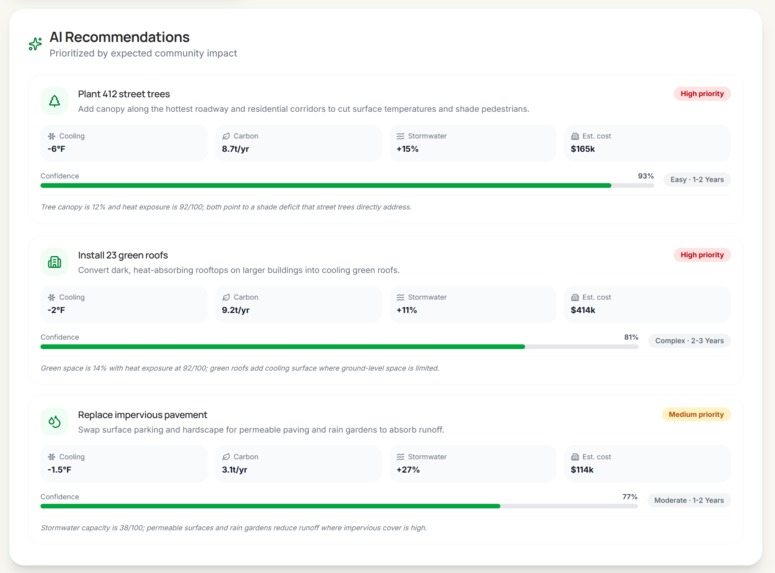
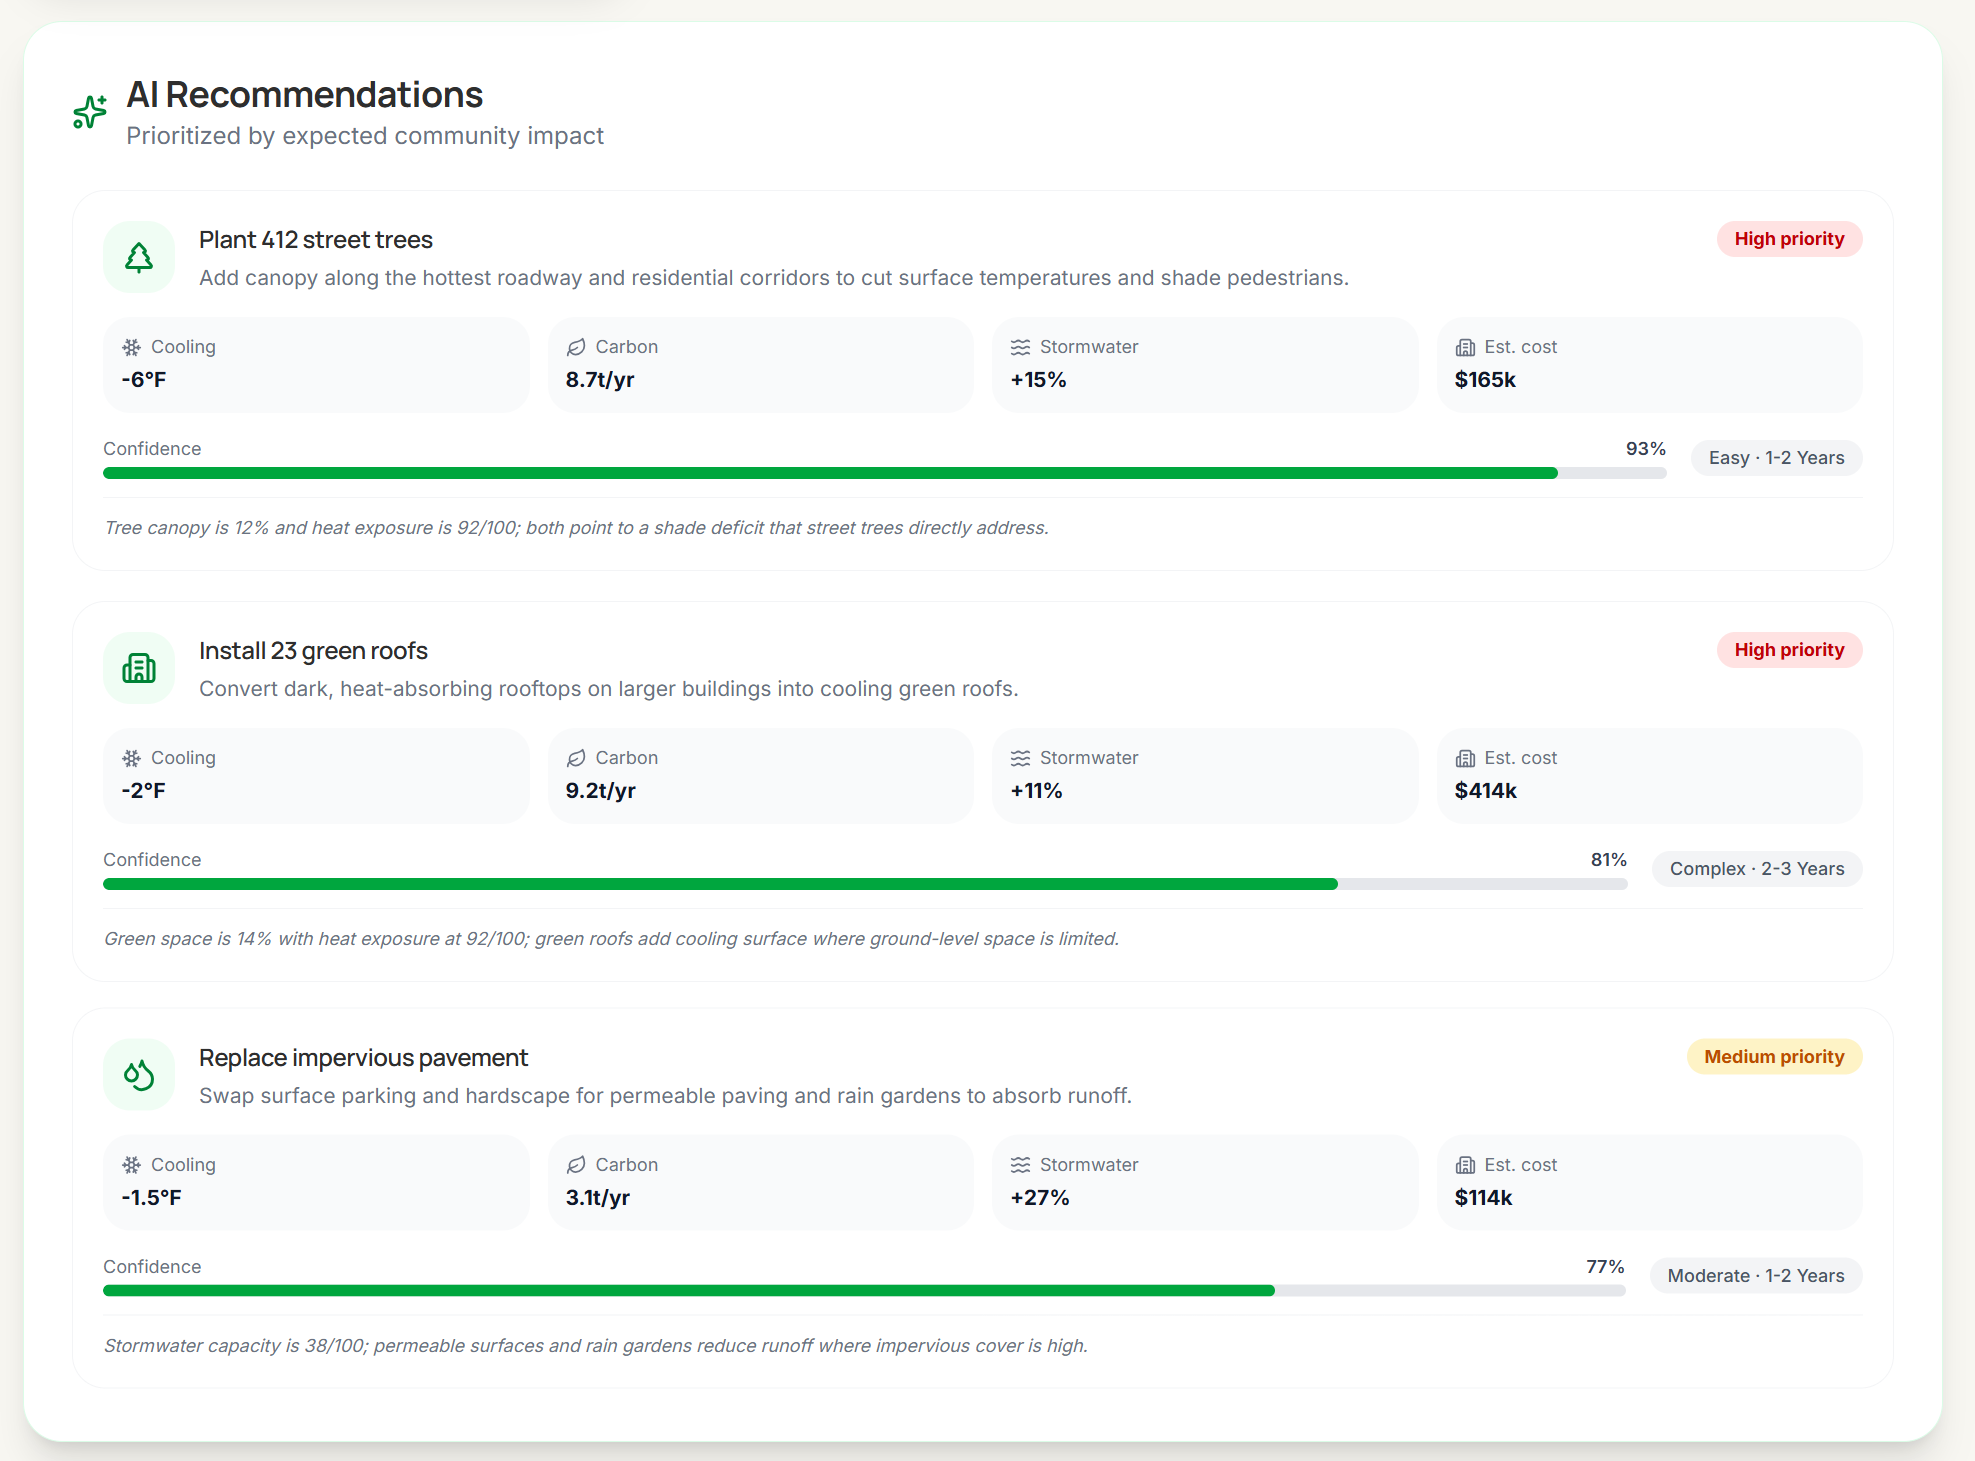
AI ranks the highest-impact fixes for your neighborhood, with cost and cooling built in.
-
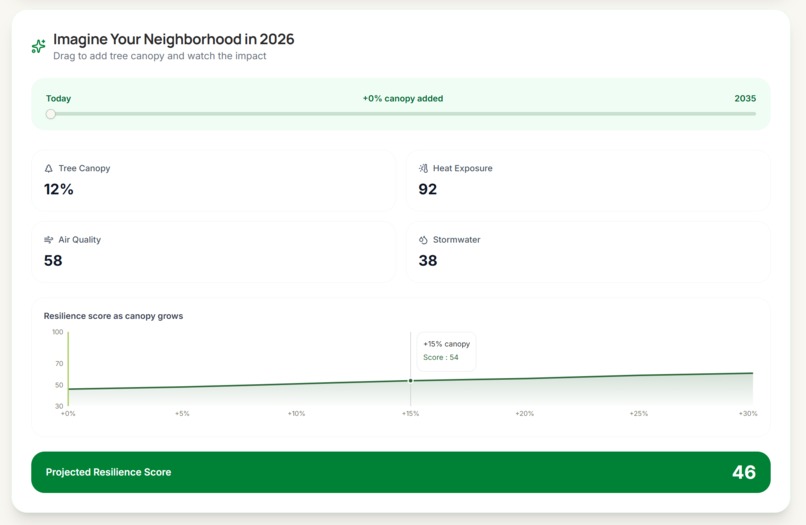
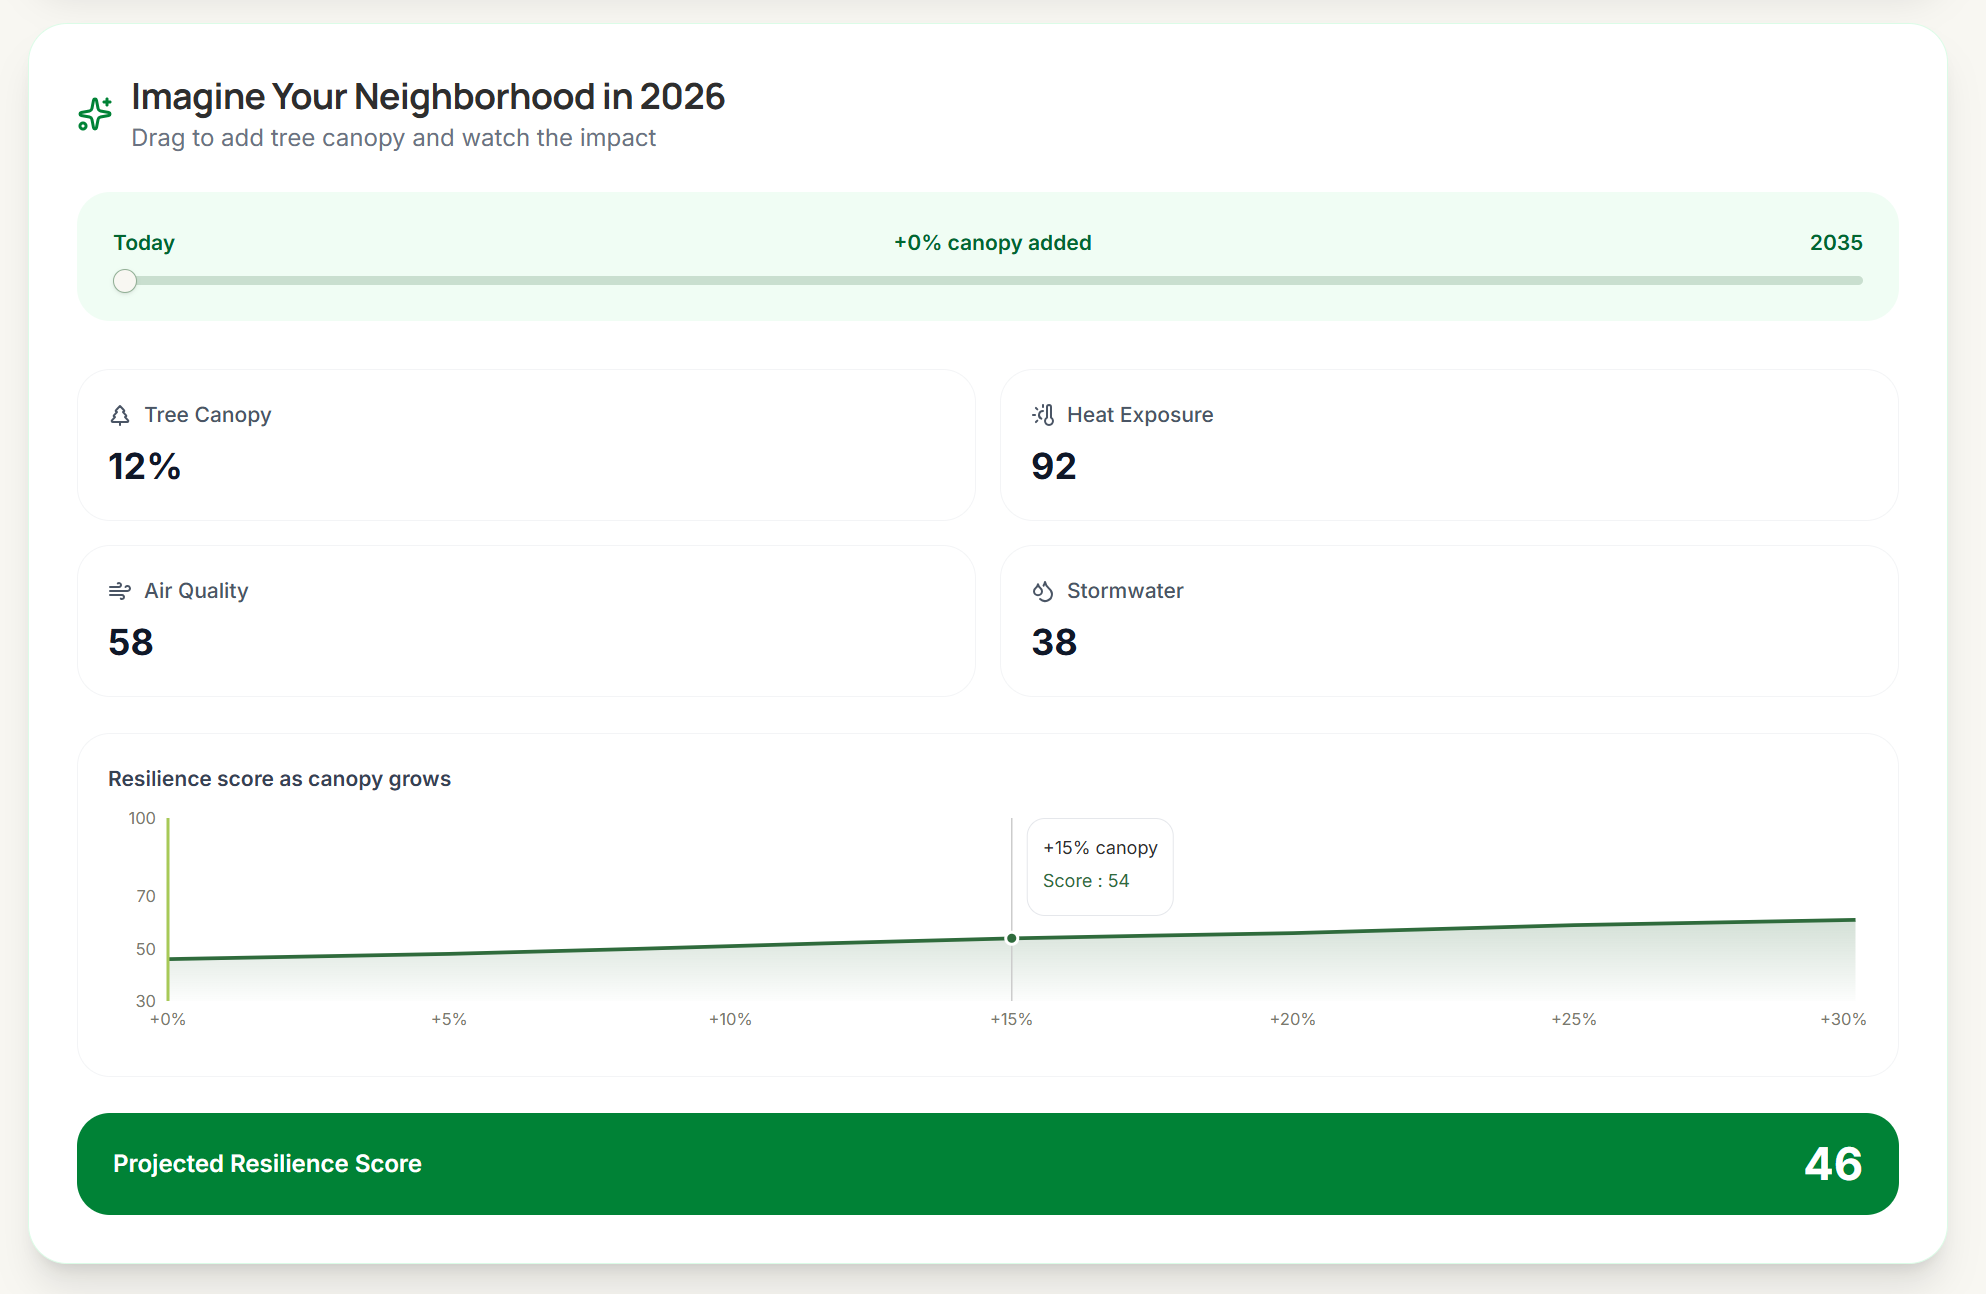
Drag the slider and watch tree canopy cool your block, year by year.
-
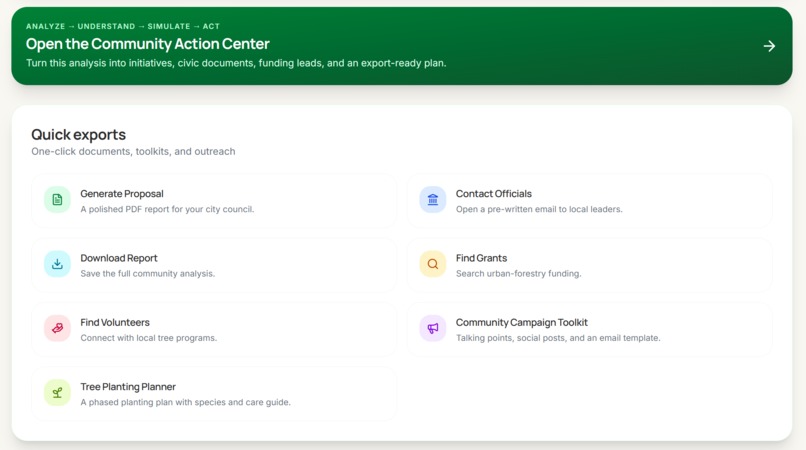
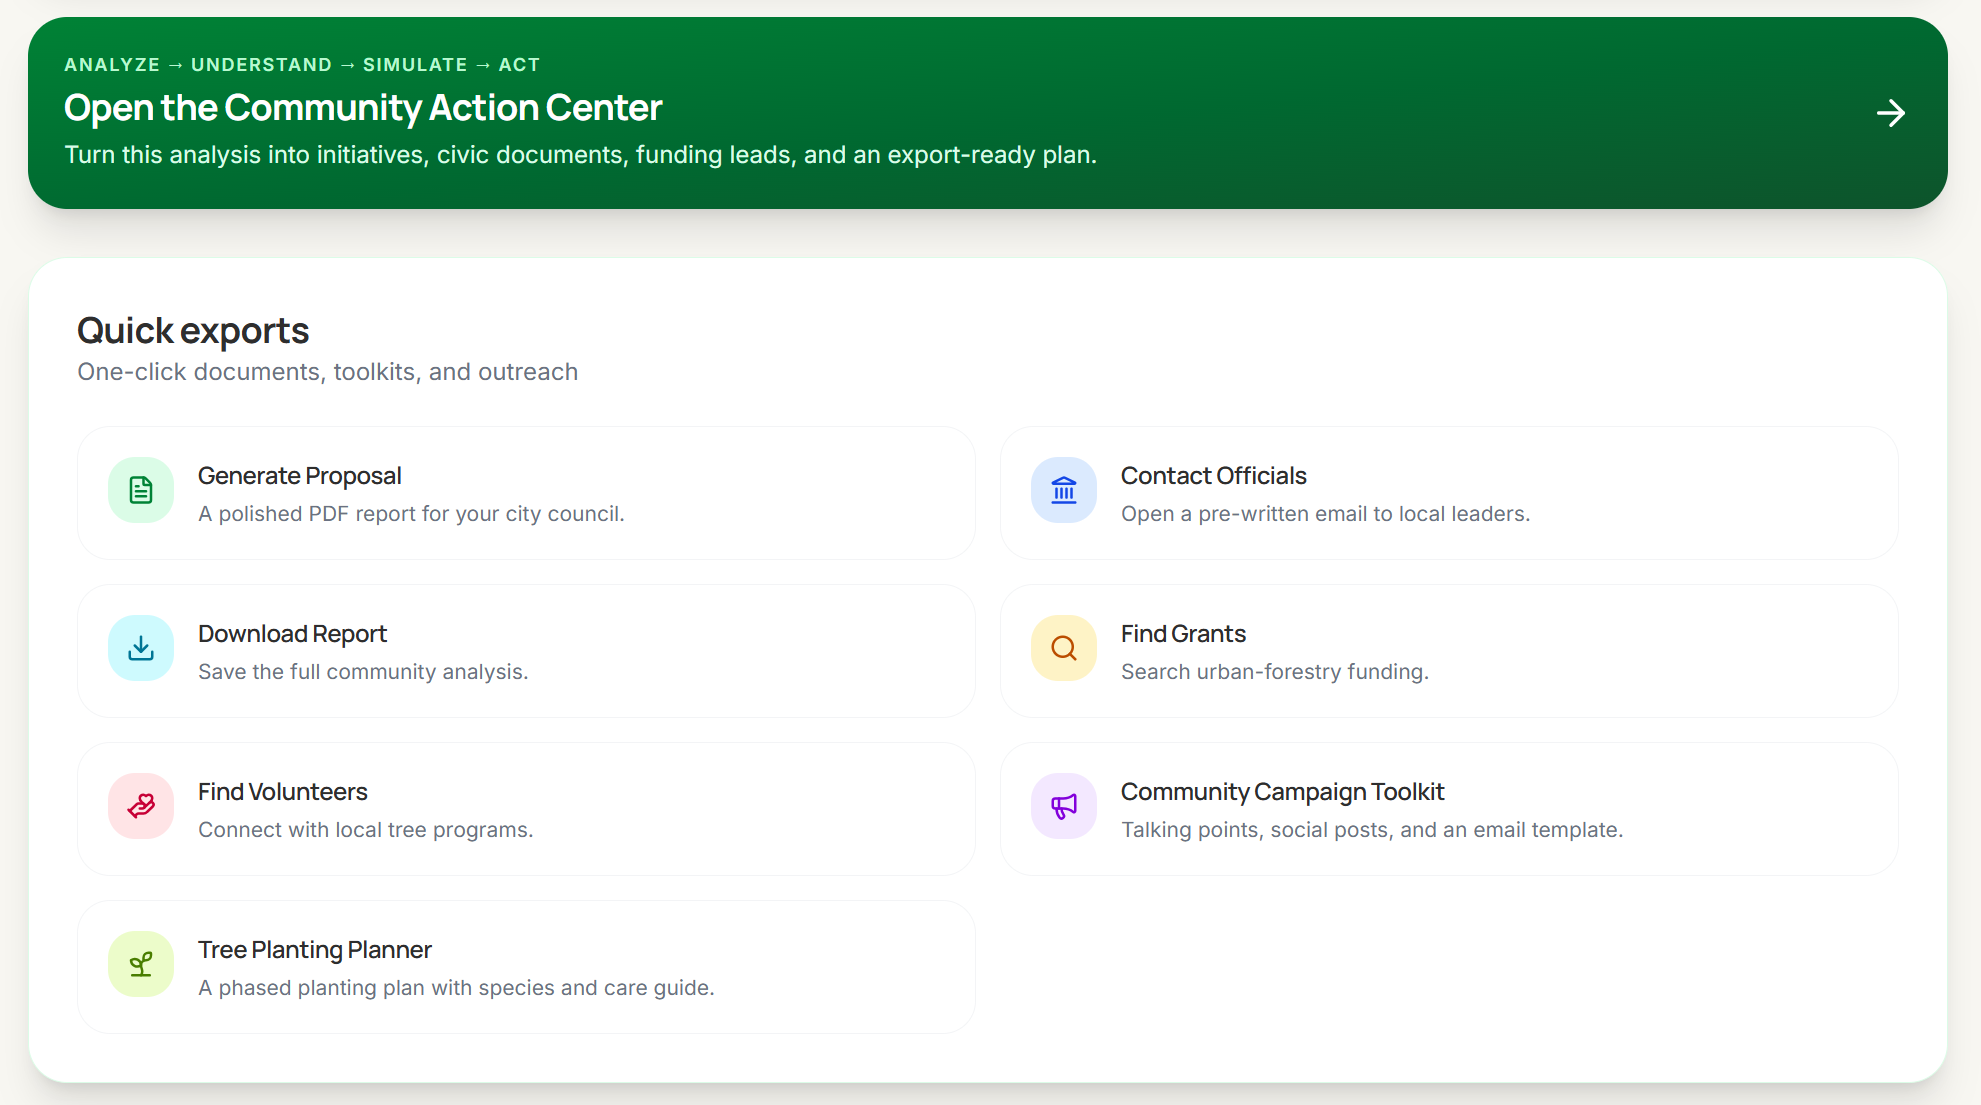
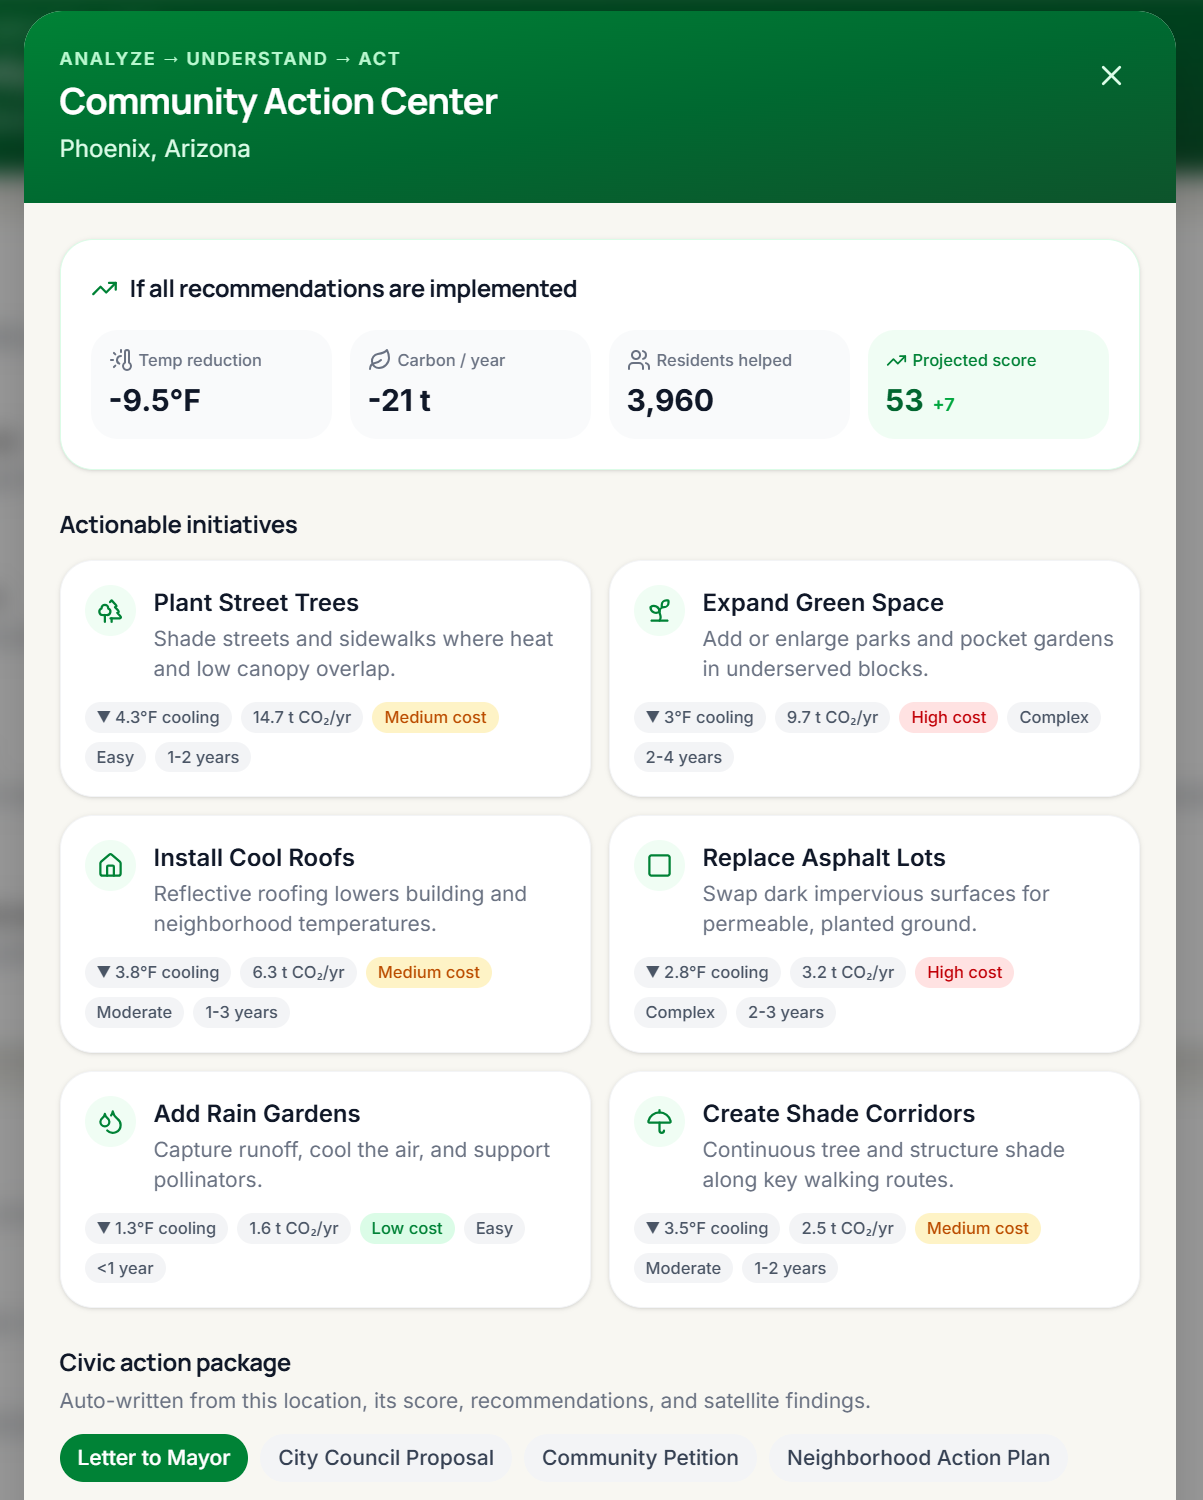
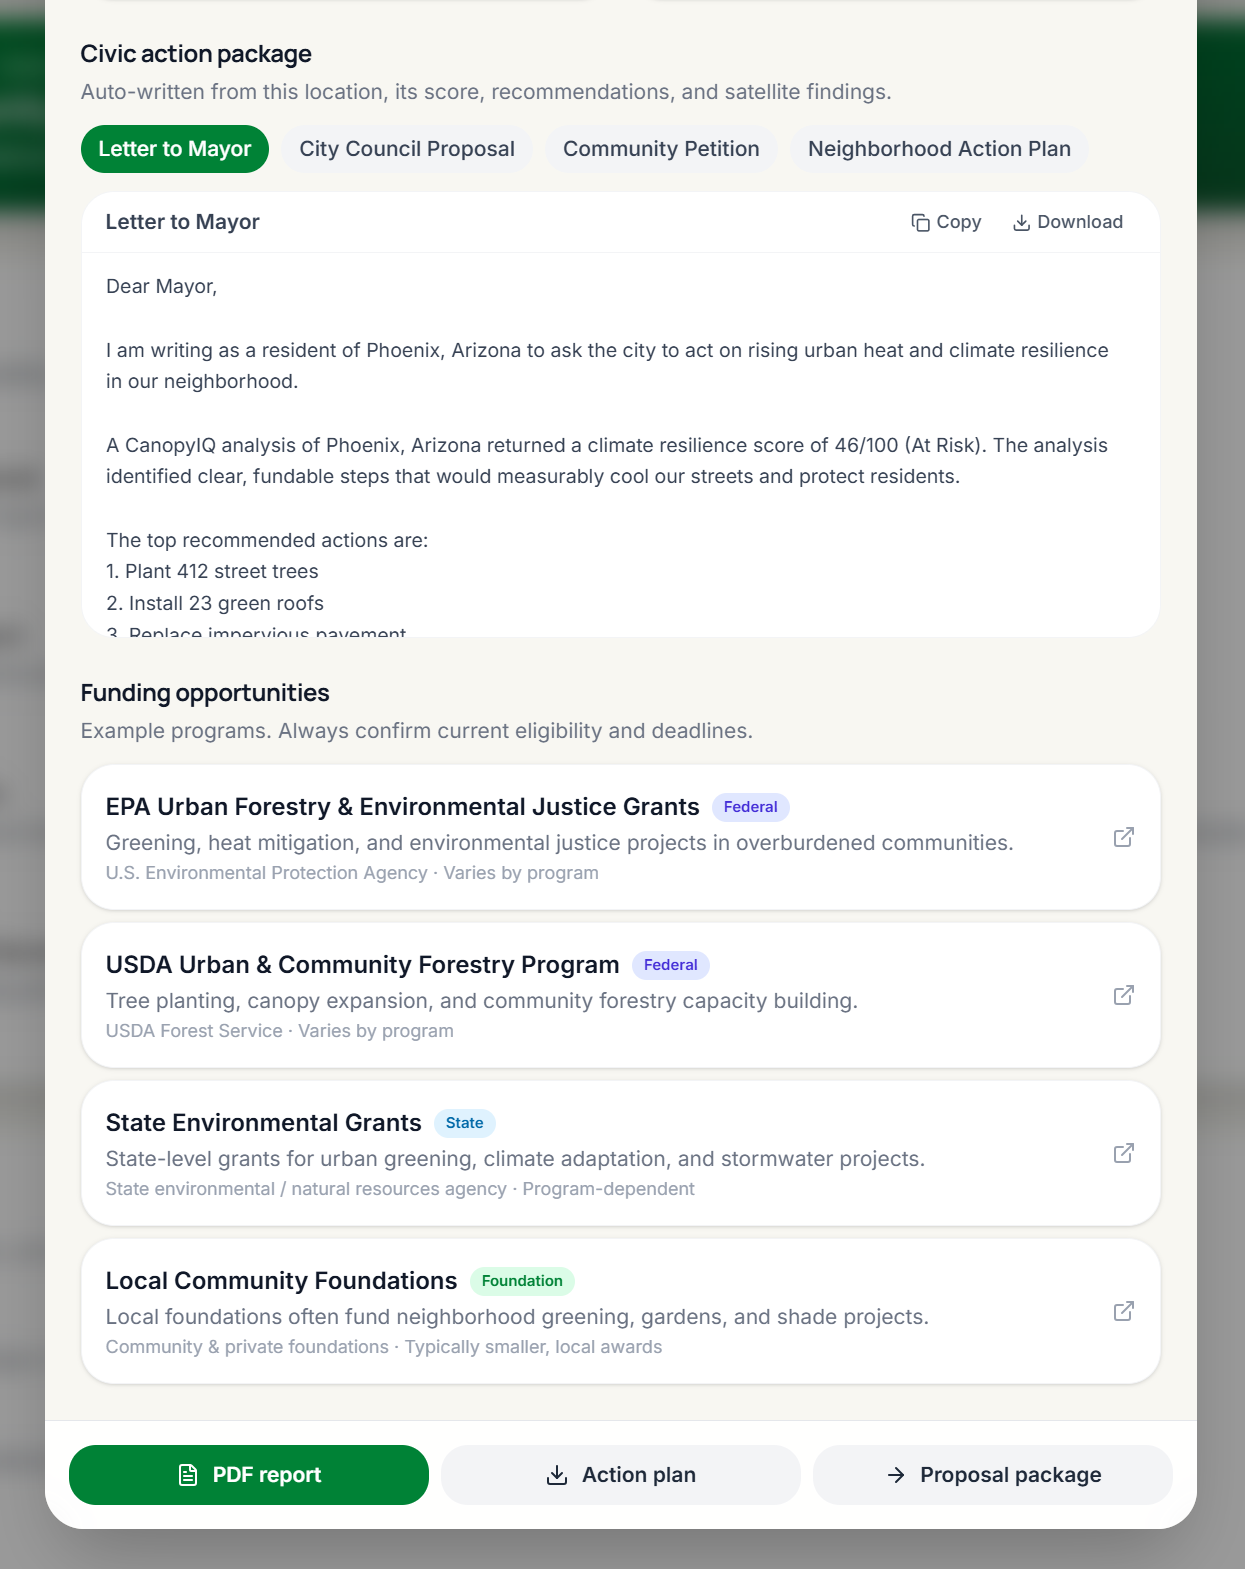
The Community Action Center: proposals, grants, volunteers, and a planting plan, ready to export.
-
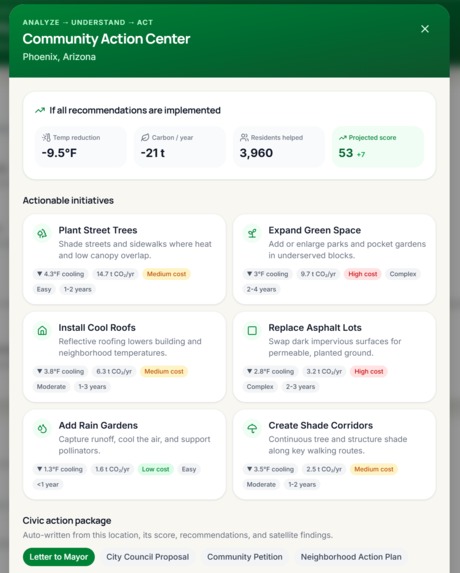
See the real impact: cooler streets, less carbon, thousands of residents helped.
-
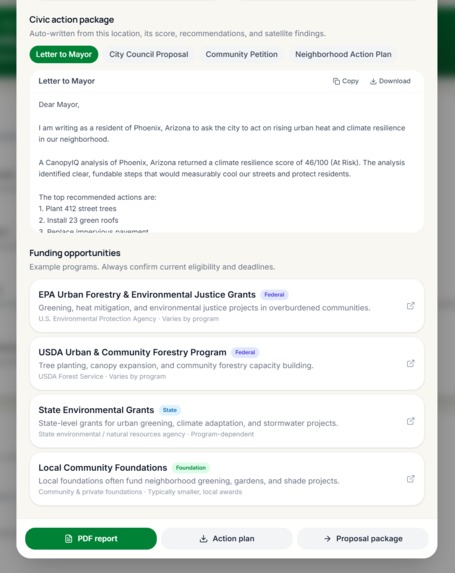
One click turns your score into a letter to the mayor plus matched grant funding.
-
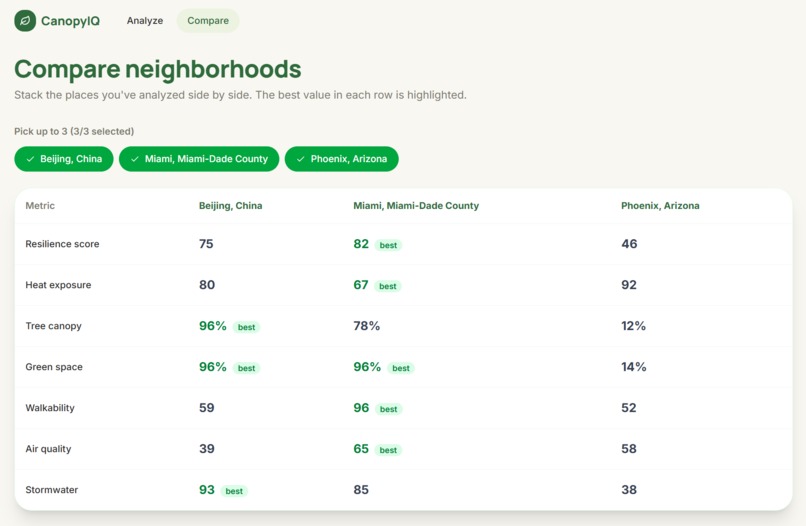
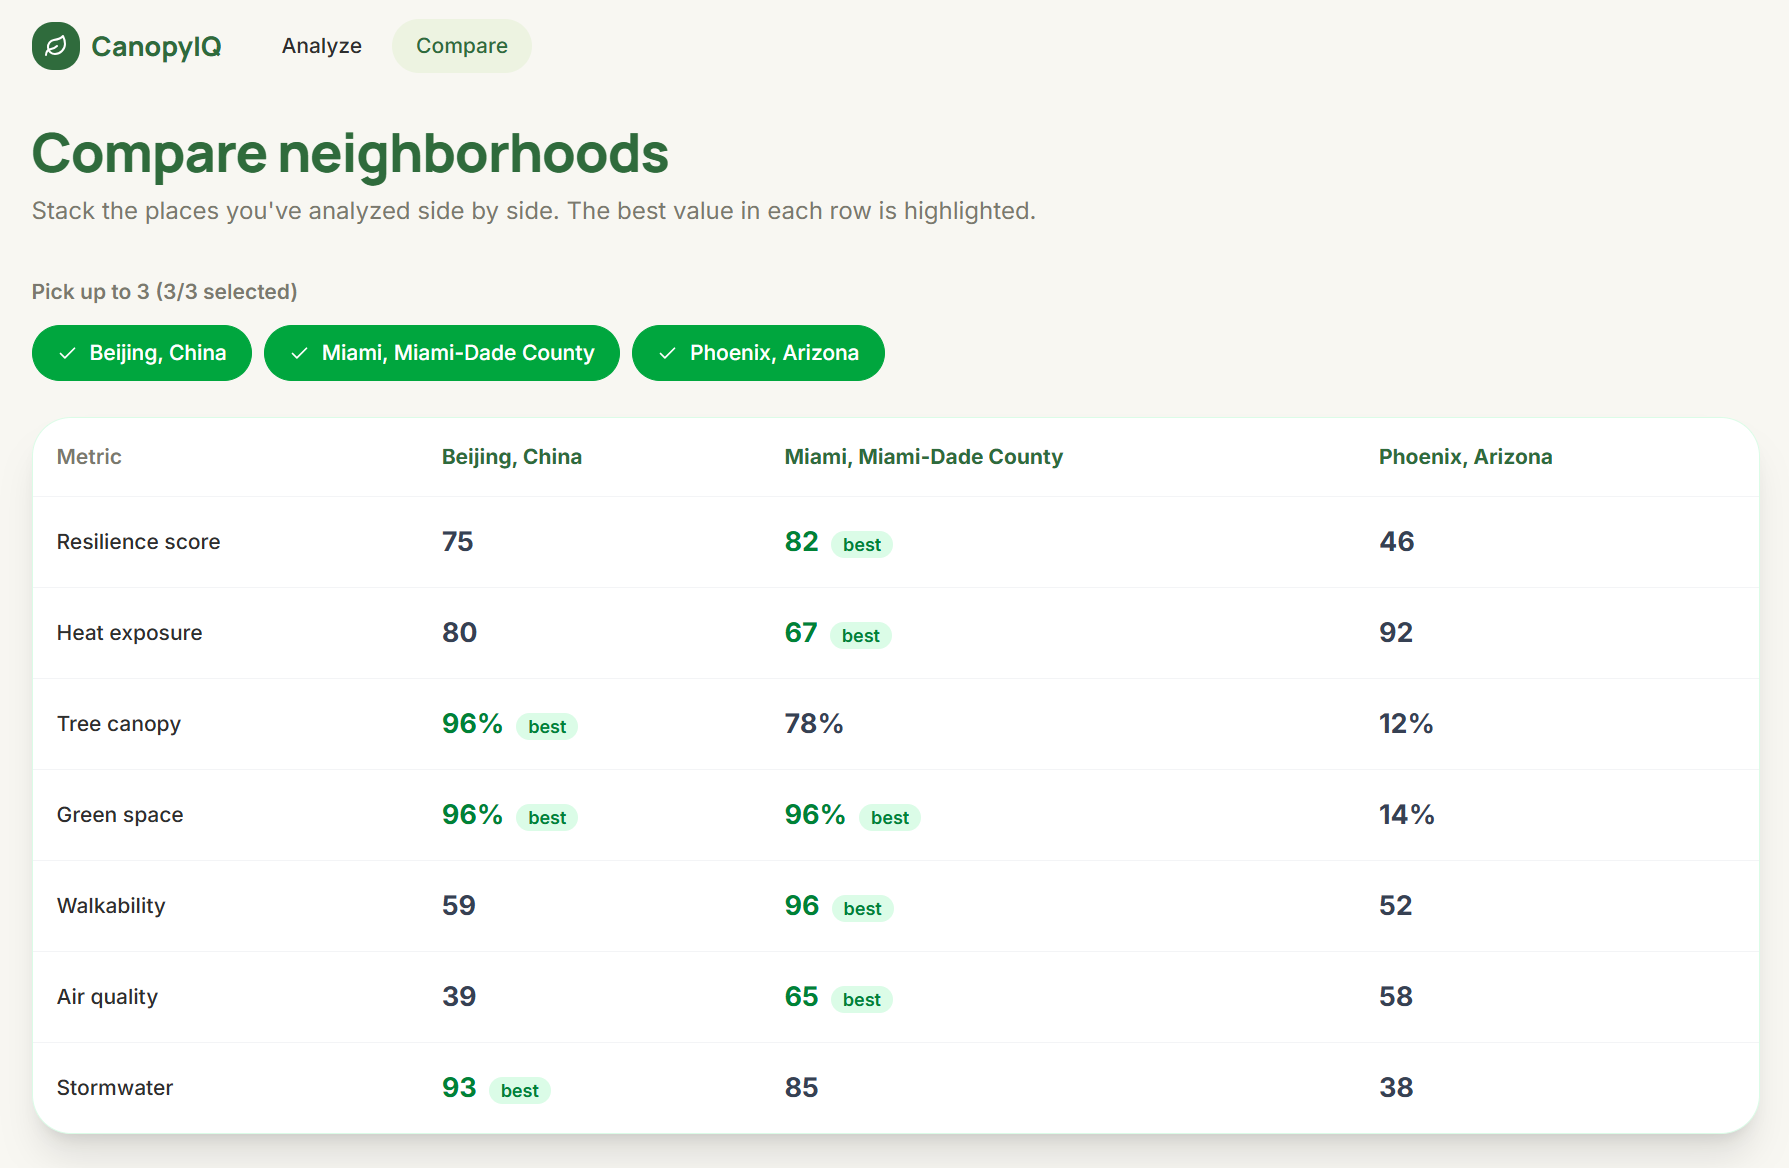
Compare any three neighborhoods side by side and see which one wins on heat, canopy, and air quality.
CanopyIQ
Inspiration
I've always been interested in using technology to solve real-world problems, especially ones that affect everyday people. While learning more about urban heat islands and environmental resilience, I realized that the information needed to understand these issues already exists through public datasets. The problem is that most of those datasets are buried inside technical GIS software that the average person will never use.
I wanted to build something that makes that information easier to understand. Instead of expecting users to interpret complex maps and datasets, CanopyIQ brings environmental information into a simple, interactive experience that helps people better understand their communities.
What it does
Users can:
- Search any location
- Explore an interactive map
- View a Neighborhood Resilience Score
- Receive AI-assisted sustainability recommendations
- Simulate future environmental improvements
- Export a downloadable PDF report
The goal is to make environmental data accessible, understandable, and actionable for everyone—not just GIS professionals.
How I built it
CanopyIQ was built using React, TypeScript, Vite, and Tailwind CSS.
To speed up development, I used Lovable to prototype the initial landing page and overall UI layout. Rather than starting from a blank project, Lovable helped establish the foundation of the interface, allowing me to spend more time building the application's functionality.
From there, I customized and expanded the project by implementing the interactive dashboard, mapping features, resilience scoring workflow, PDF generation, animations, and overall application logic. Throughout development, I refined the user experience, reorganized components, and tailored the application to fit the vision for CanopyIQ.
Using Lovable accelerated the design process while still allowing me to take ownership of the application's implementation, customization, and overall user experience.
Challenges I ran into
One of the biggest challenges was deciding how much information to present without overwhelming users. Environmental data can become technical very quickly, so designing an interface that remained simple while still being informative required several iterations.
Another challenge was integrating mapping, charts, report generation, and interactive components into a single application while maintaining a responsive and organized user experience.
Accomplishments that I'm proud of
I'm proud of building an application that focuses on solving a meaningful problem while remaining approachable for everyday users.
I'm also proud of learning new technologies throughout the project and using AI-assisted development to accelerate prototyping while still taking ownership of the application's functionality, customization, and overall implementation.
What I learned
This project strengthened my experience with React, TypeScript, interactive mapping, component-based architecture, and modern frontend development.
More importantly, it reinforced that good software isn't just about displaying information—it's about making complex information easier for people to understand and use.
What's next for CanopyIQ
This project is just the beginning.
Future improvements include:
- Integrating additional environmental datasets, including NASA GIBS imagery
- Expanding the resilience scoring model
- Incorporating historical environmental trends
- Adding user accounts and saved reports
- Building community collaboration features
- Developing machine learning models for environmental predictions
- Creating tools specifically for city planners and local organizations
Built With
- maplibre-gl
- nasa-earthdata
- nasa-gibs
- openstreetmap

Log in or sign up for Devpost to join the conversation.