-
-
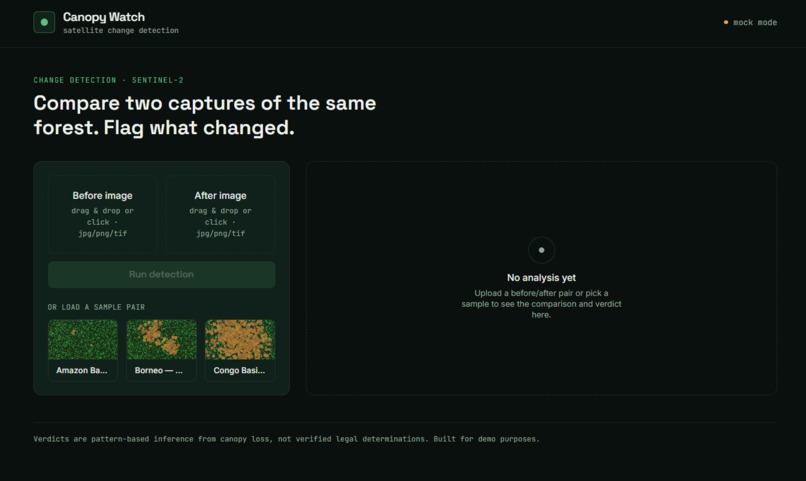
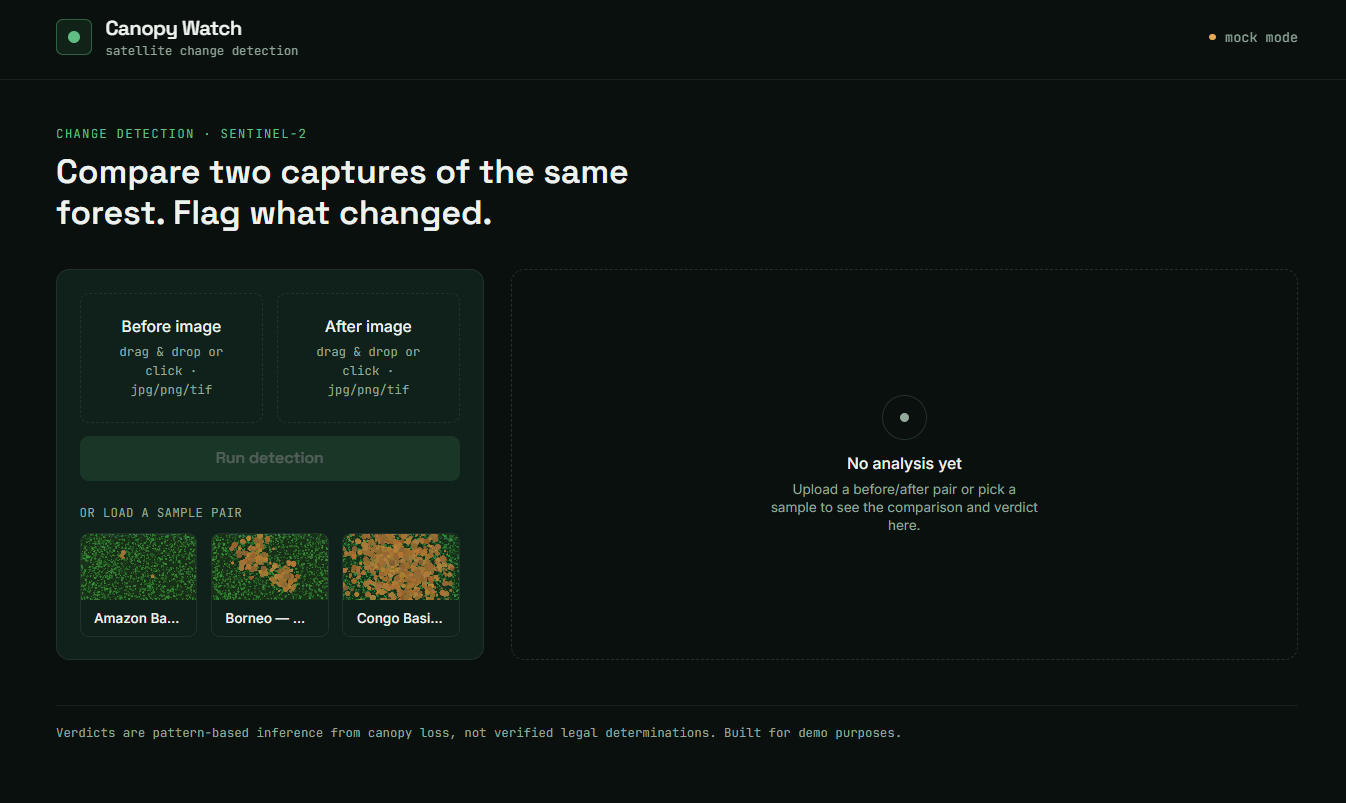
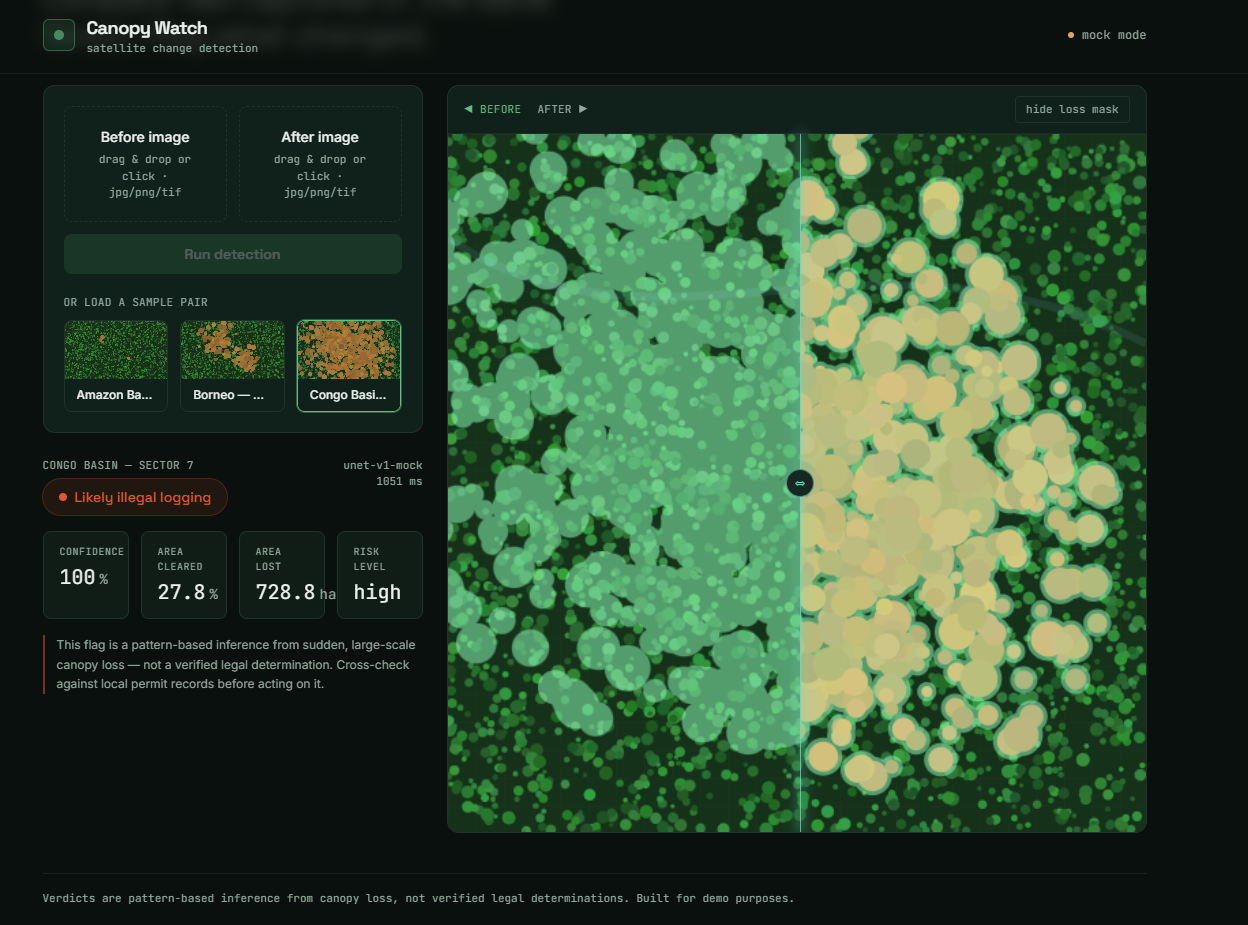
Canopy Watch — upload two satellite captures of the same forest and instantly flag rapid canopy change.
-
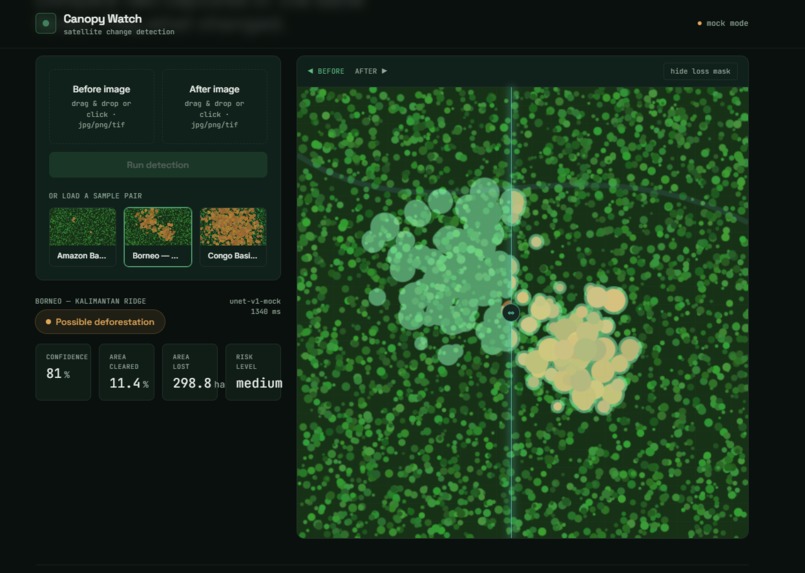
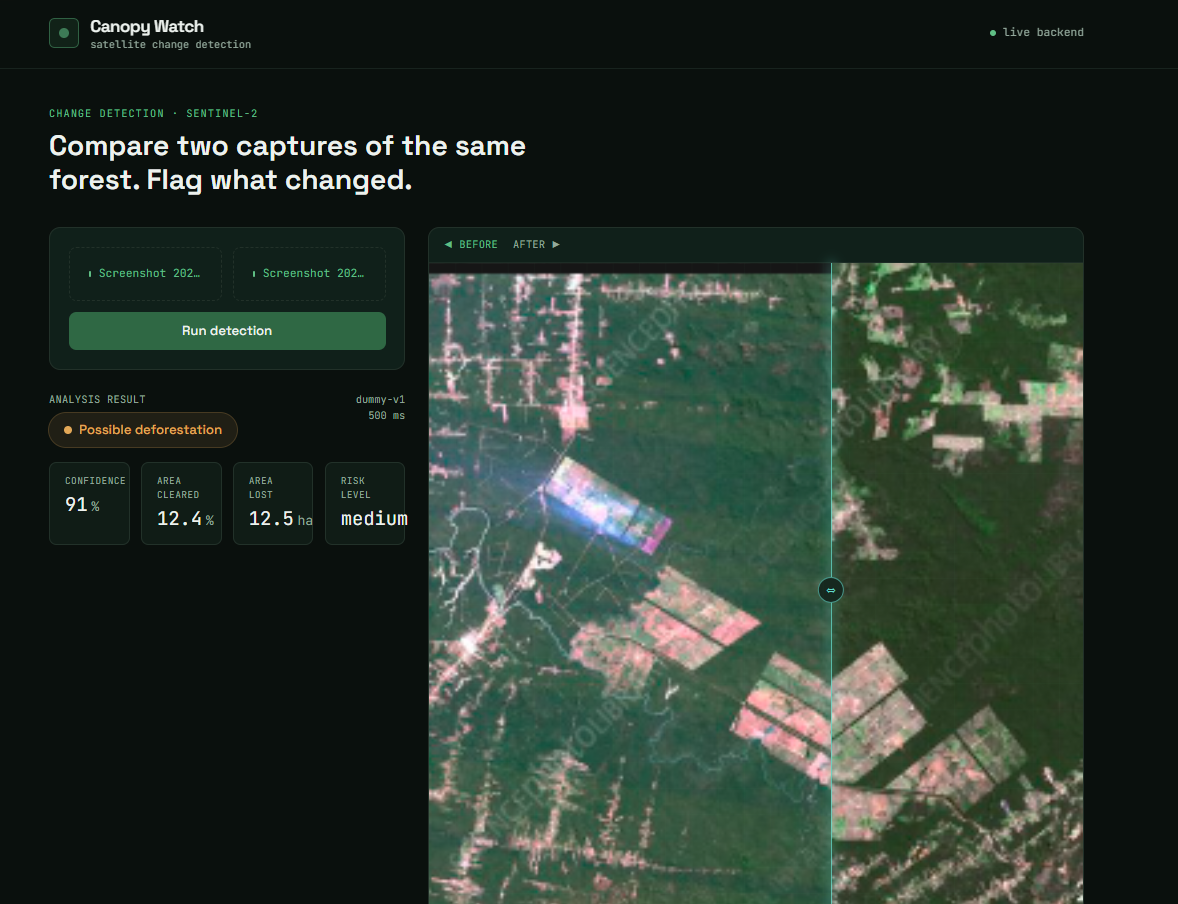
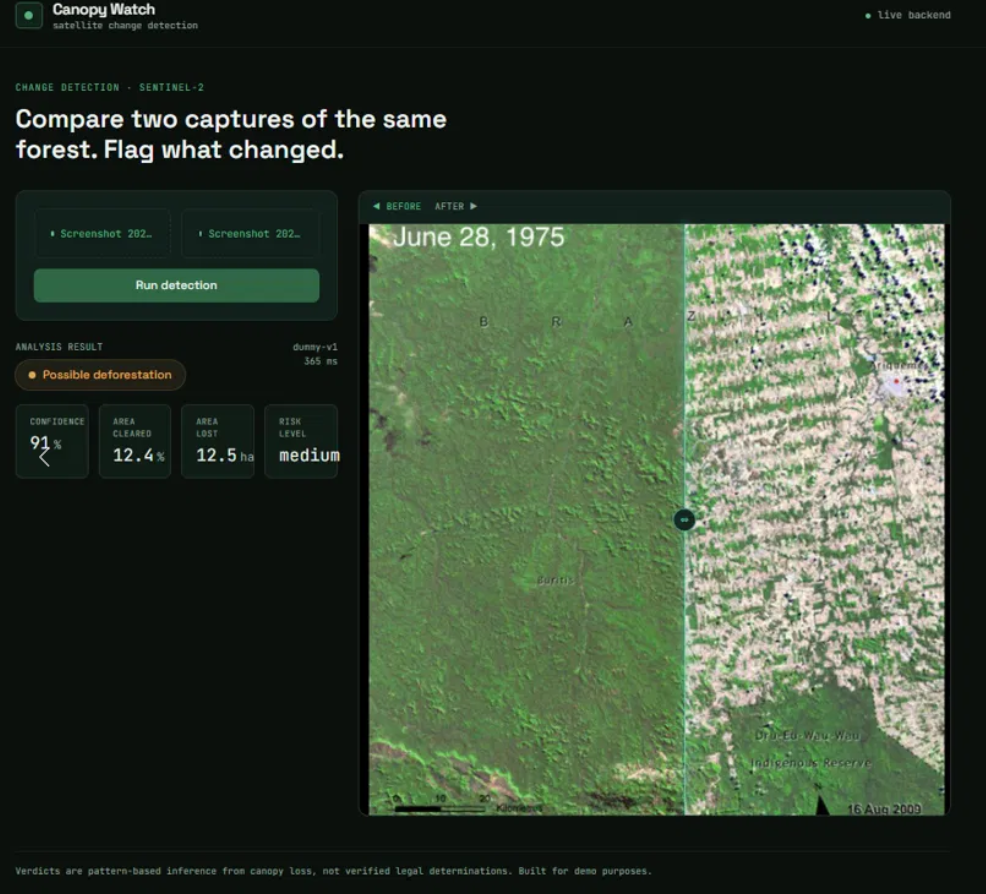
Result screen shows canopy loss %, affected area, confidence, and severity — all from a single image comparison.
-
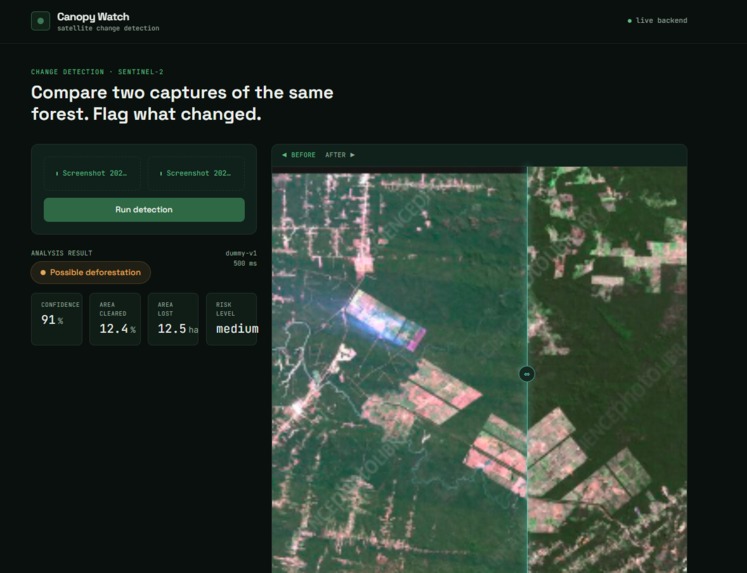
Works with real satellite imagery too same detection pipeline, real Sentinel-2-style captures.
-
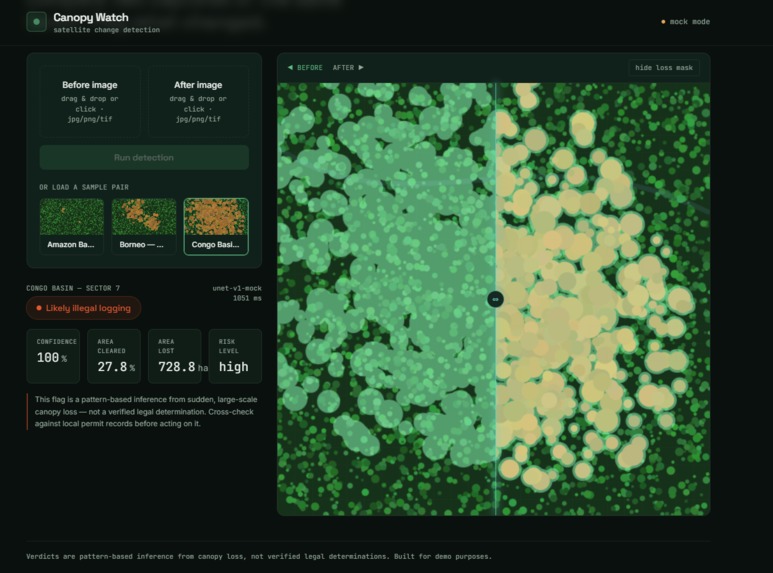
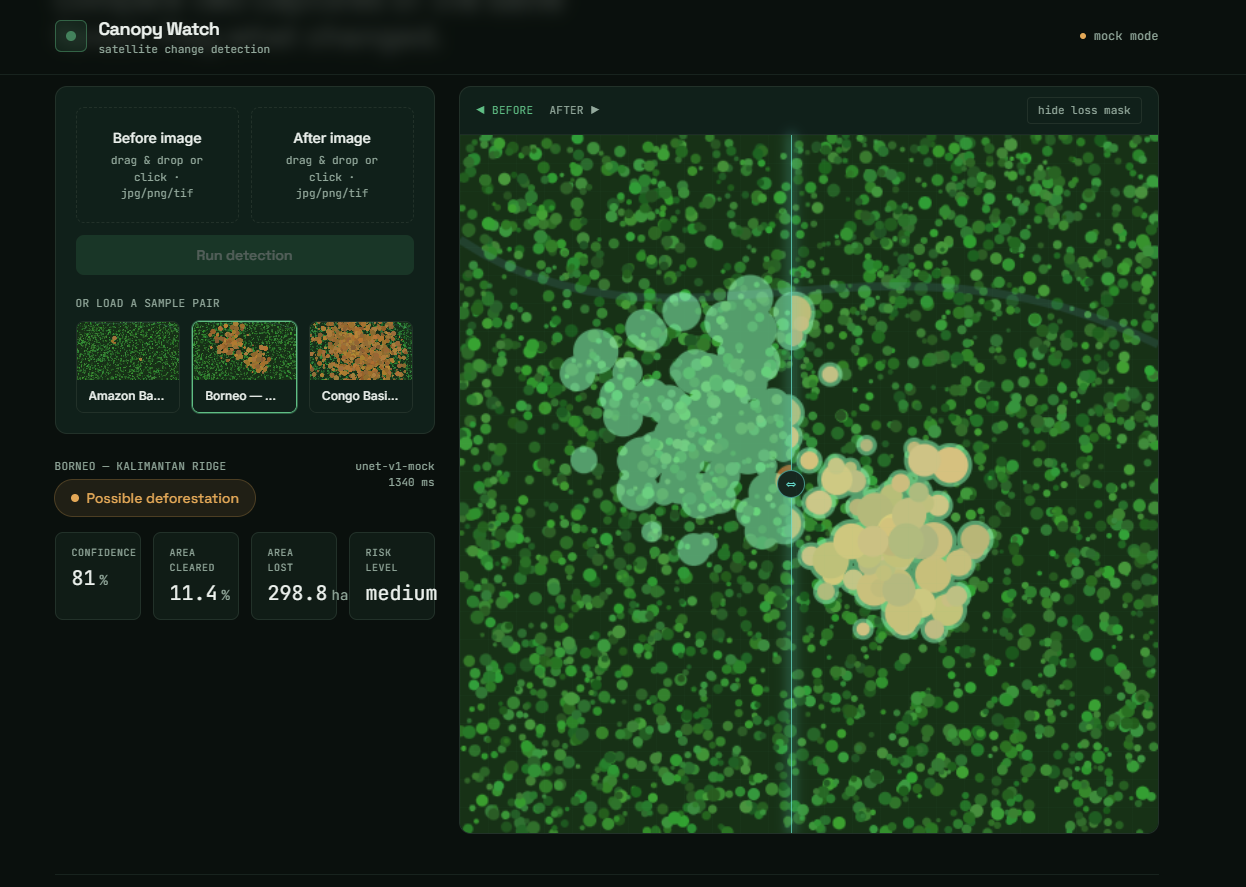
The change map highlights exactly where canopy was lost between the two captures — not just a yes/no answer.
-
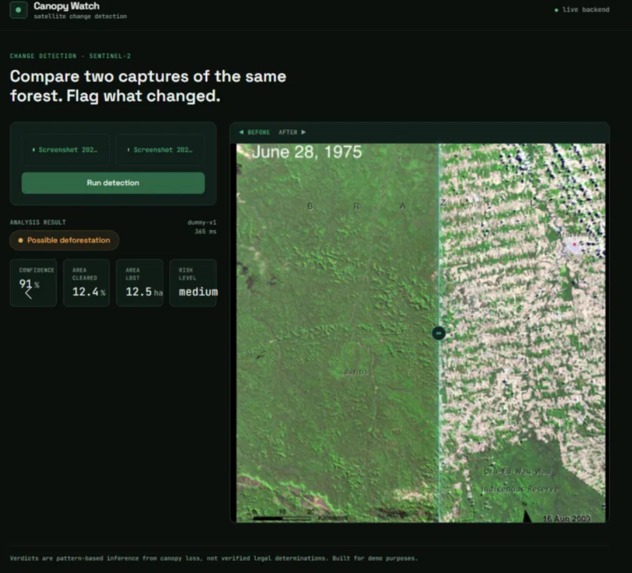
Gave exact Forest Loss Percentage Report
Inspiration
Illegal logging is one of those problems where the evidence already exists — satellite imagery of forests is captured constantly — but nobody has the time to manually compare thousands of before/after image pairs to spot where clearing happened. We wanted to see if we could take that manual comparison and turn it into something automatic: upload two images of the same patch of forest, and immediately know if something changed, how much, and how confident the system is.
The "illegal" framing pushed us to be careful from day one — we can't verify legal permits, so we built this as a pattern-based flagging tool: it detects sudden, large, geometric canopy loss (the signature of active clearing, as opposed to natural seasonal variation), and is upfront that this is evidence for a human to investigate, not a legal verdict.
What it does
You give Canopy Watch two satellite images of the same location — one earlier, one later. It:
- Compares canopy coverage between the two images
- Calculates the percentage and area (km²) of forest lost
- Classifies the result into a verdict (no deforestation → possible deforestation → likely illegal logging) with a confidence score and severity rating
- Renders a visual change map (red = vegetation loss) plus a draggable before/after comparison slider
- Explains why it flagged the area — not just "deforestation detected," but the specific evidence (magnitude, pattern, concentration of loss)
- Shows the location on a map with coordinates, satellite source, and capture dates when available
How we built it
We started by locking down the API contract before writing a line of feature code — every field name, type, and unit agreed between frontend and backend up front. In a short hackathon window, mismatched field names between two people building in parallel is the easiest way to lose a day to integration bugs, so we treated the contract document as the actual source of truth, not an afterthought.
Frontend: React + Vite + Tailwind, built around telling a story rather than dumping numbers — a hero result panel with the verdict, an interactive before/after slider, a change-map overlay, severity bar, and a "why was this flagged" explanation section.
Backend: FastAPI serving a segmentation pipeline. We built a real U-Net architecture in PyTorch for the change-detection task, and designed the inference service to automatically fall back to a deterministic heuristic detector (a vegetation-index-drop comparison) whenever trained weights aren't present. That meant the whole system was demoable and testable end-to-end from day one, and swapping in a trained model later is a drop-in weights file, not a rewrite.
We also didn't want the demo to depend on a live dataset download during a presentation, so we procedurally generate realistic-looking sample satellite imagery (forest texture + clearing patches) on both the frontend and backend — the whole thing runs and looks convincing with zero external dependencies.
Challenges we ran into
- Deciding the verdict logic without a trained model. "Likely illegal logging" needed to be a defensible, explainable rule rather than a black box, so we settled on a simple area-percentage threshold table paired with a severity tier, instead of faking model confidence we didn't actually have.
- No real labeled dataset in the time available. Rather than blocking on this, we built the system so the architecture is real (a working, runnable U-Net) while the fallback path keeps everything functional.
- Making the result feel like a real analysis tool, not a toy image diff. Early versions just showed "deforestation detected: yes/no." We rebuilt the result screen around a change map, severity classification, and explicit reasoning so it reads like an actual geospatial monitoring product.
- Keeping frontend and backend in sync on thresholds and field names while building in parallel — solved by treating the API contract doc as binding and communicating any change immediately.
Accomplishments that we're proud of
- A fully working end-to-end pipeline — upload two images, get a real, explainable verdict back — with no external dependencies required to run or demo it.
- A genuine fallback architecture: the inference service isn't faked, it's a real model with a real (and honestly labeled) heuristic fallback, so nothing about the demo is smoke and mirrors.
- A result screen that goes beyond "yes/no" — change map, severity rating, affected area, confidence, location, and plain-language reasoning for the verdict.
- Locking the API contract on day one and never having a single integration bug caused by a field-name mismatch for the rest of the build.
- Keeping the tool honest about its own limits — we say clearly, in the UI itself, that "illegal" is inferred from a pattern, not a verified legal record.
What we learned
- How much a locked-down, explicit contract saves in integration time — even a simple snake_case vs camelCase mismatch can eat hours if it's not decided up front.
- The value of building a fallback path deliberately, rather than treating "the model isn't trained yet" as a blocker. It kept every layer of the stack testable in isolation.
- That explainability matters as much as the raw detection — a number alone doesn't build trust, but showing the evidence behind it does.
What's next for Canopy-Watch
- Train the U-Net on a real labeled forest-cover change dataset (e.g. Sentinel-2 imagery paired with Hansen Global Forest Change data) and drop in the trained weights — the inference pipeline already supports this with no other code changes.
- Add NDVI (vegetation index) analysis using multispectral bands instead of RGB-only comparison, for more accurate detection under partial cloud cover.
- Persist results and build a simple monitoring dashboard so a region can be tracked across multiple time periods, not just a single before/after pair.
- Integrate real-time satellite feeds so flagged regions can be monitored continuously instead of on-demand.
Built With
- fastapi
- javascript
- leaflet.js
- lucide-react
- numpy
- opencv
- openstreetmap
- pillow
- pydantic
- pytest
- python
- pytorch
- react
- resterio
- tailwindcss
- torchvision
- uvicorn
- vite


Log in or sign up for Devpost to join the conversation.