-
-

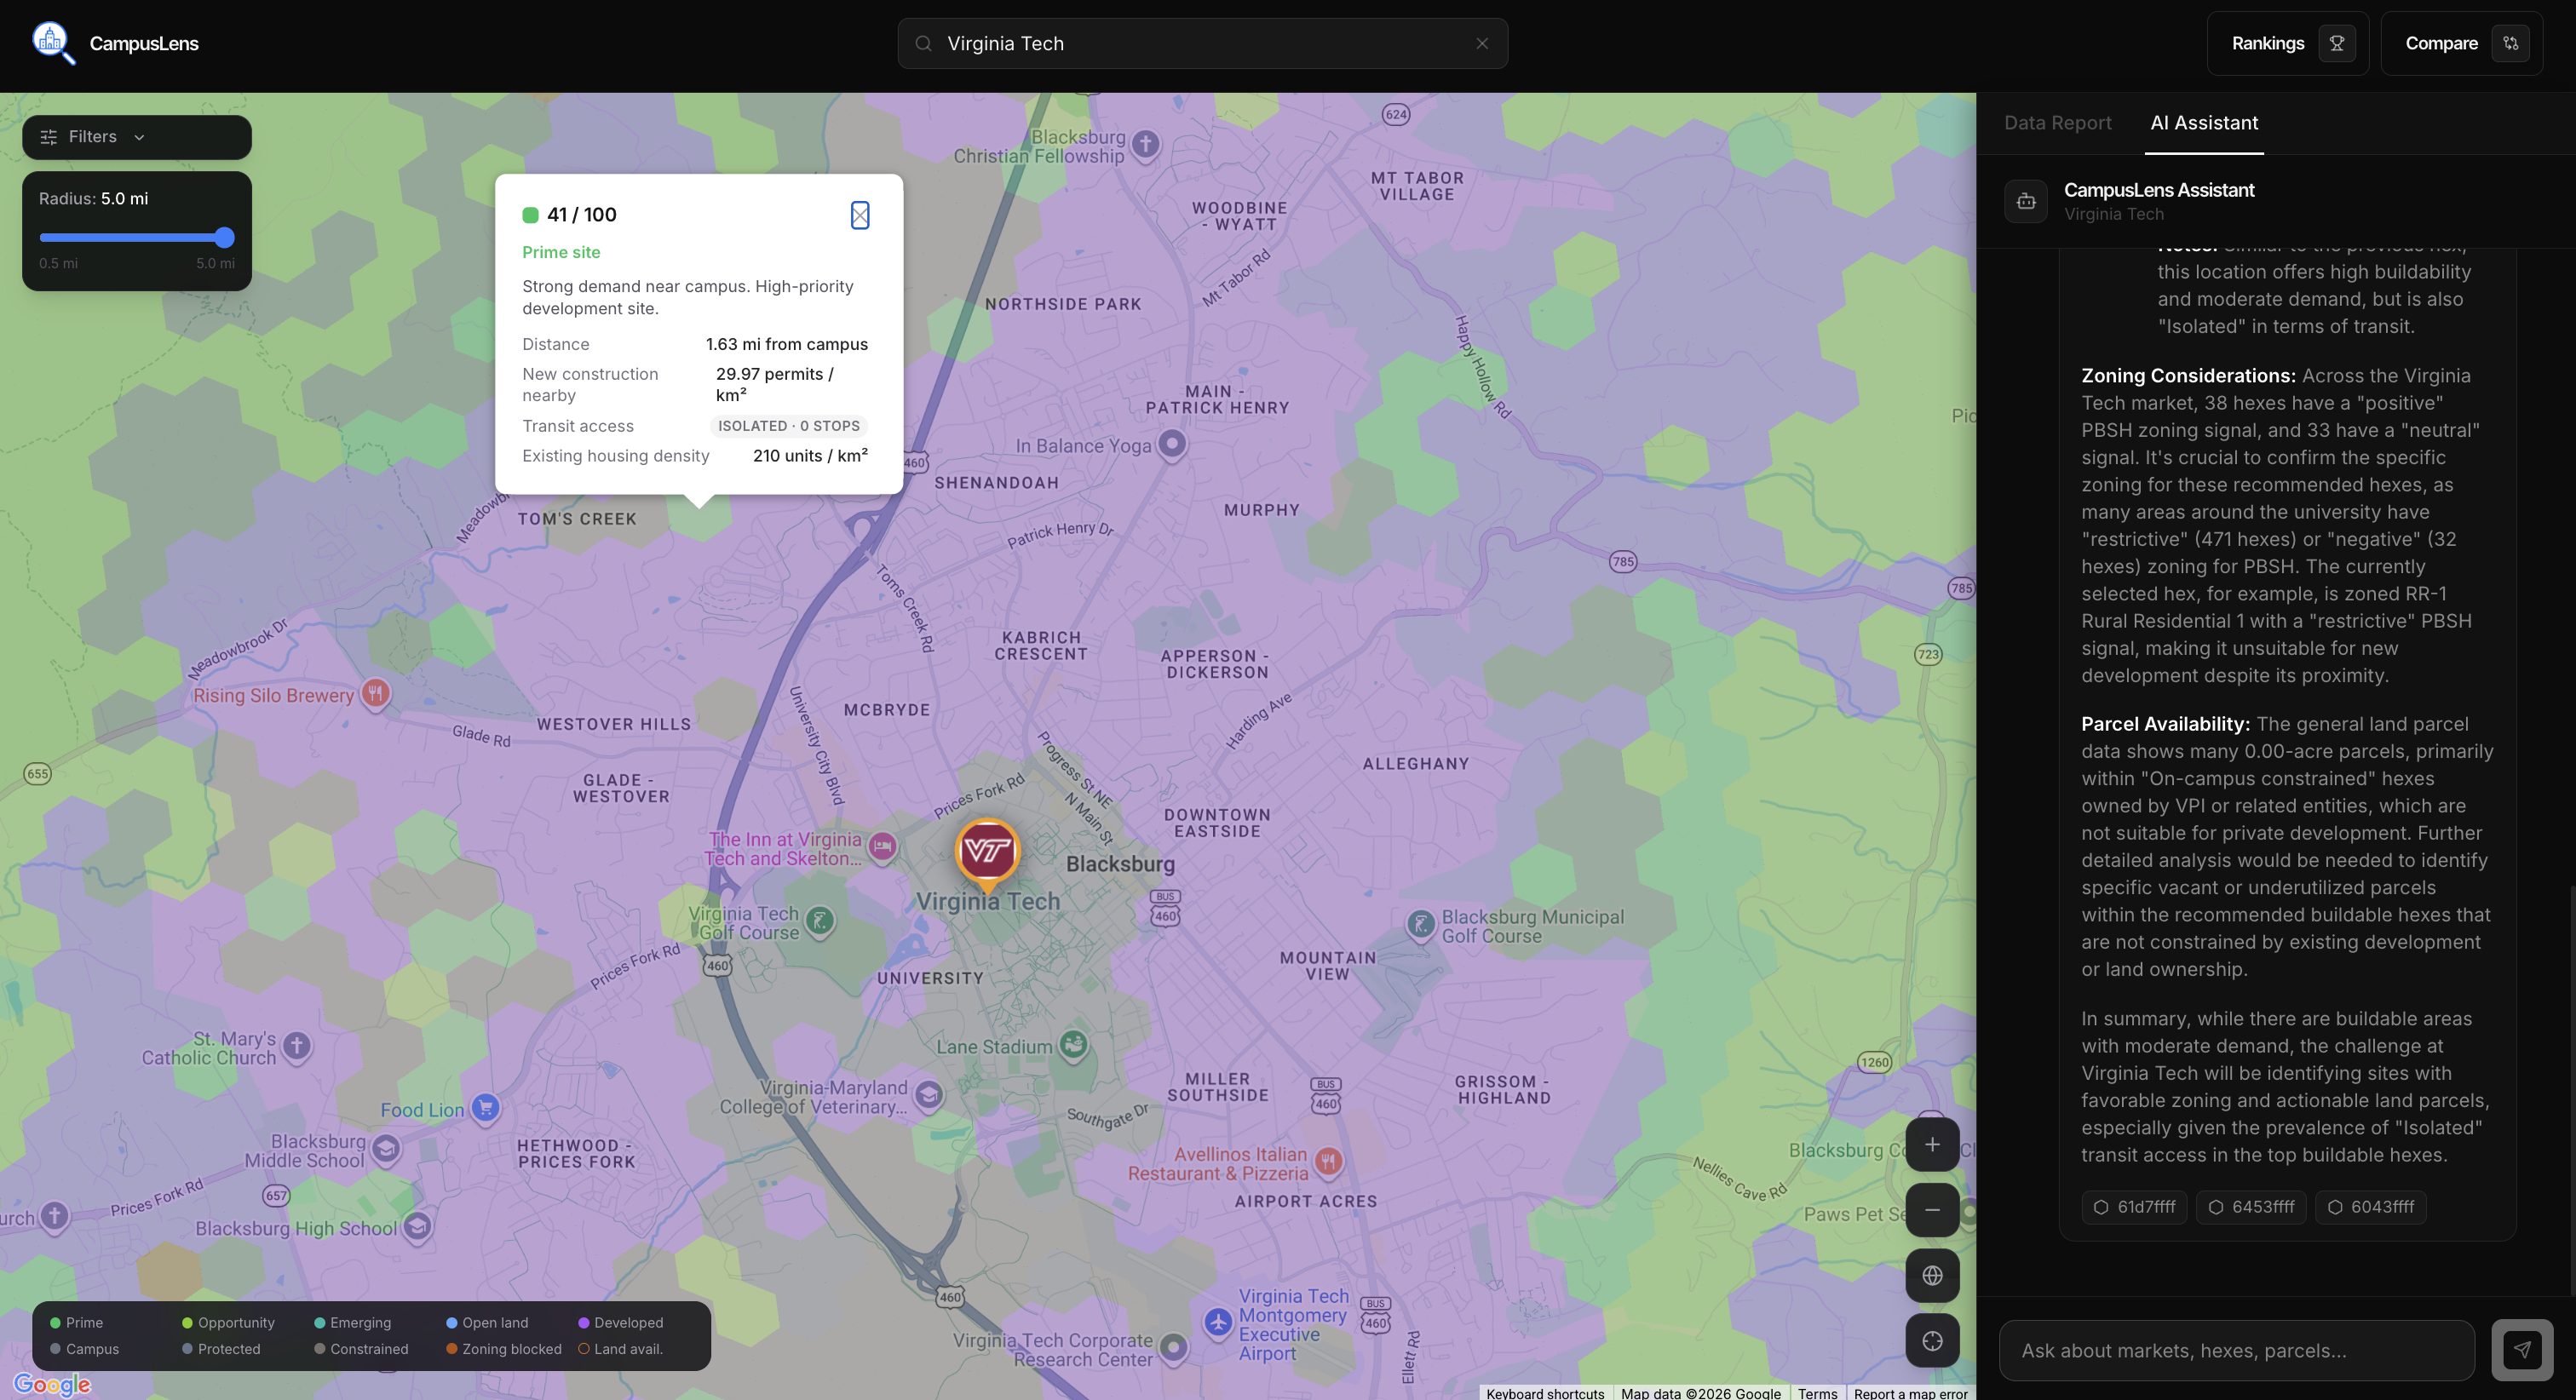
Chatting with Gemini agent on best places to develop in Virginia Tech.
-
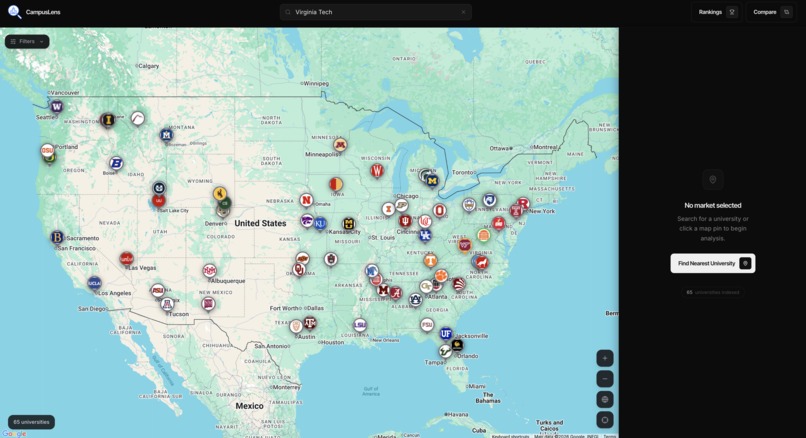
Map Overview with 66 pins. Powered by Google Maps.
-
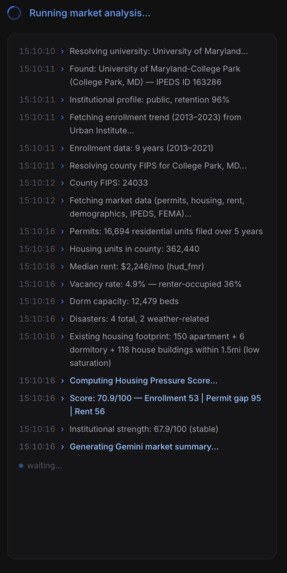
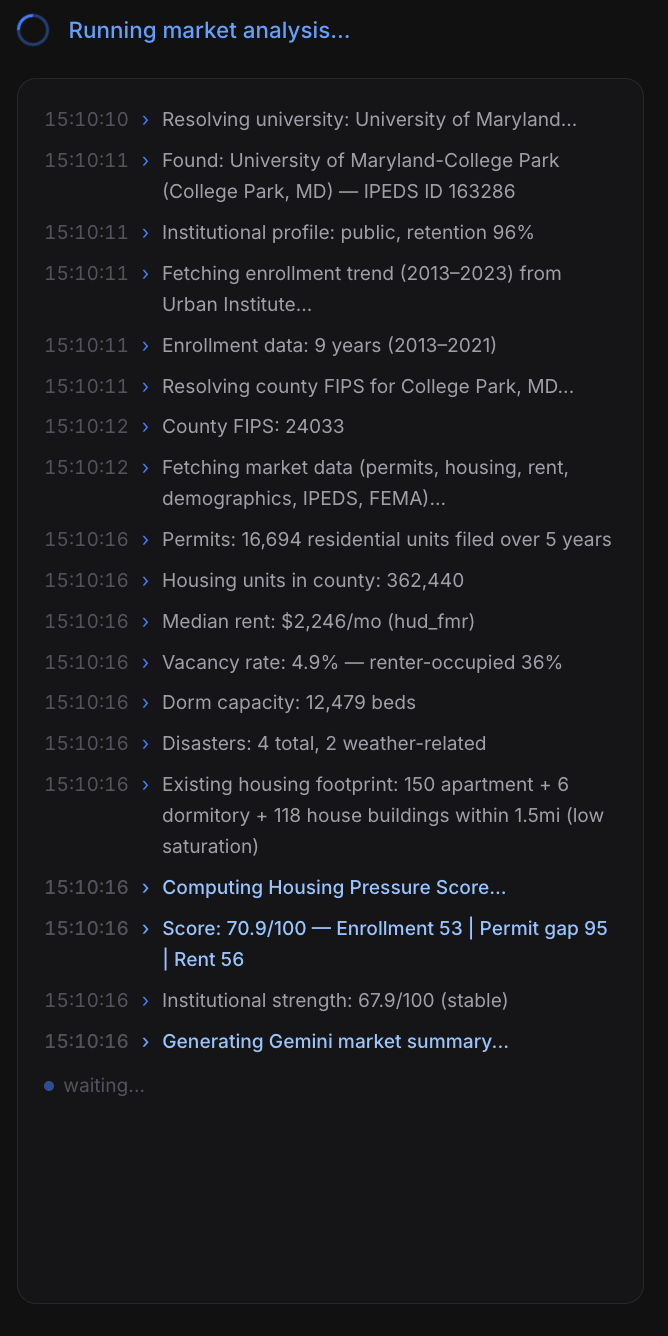
Data Sources being pulled by research agent.
-

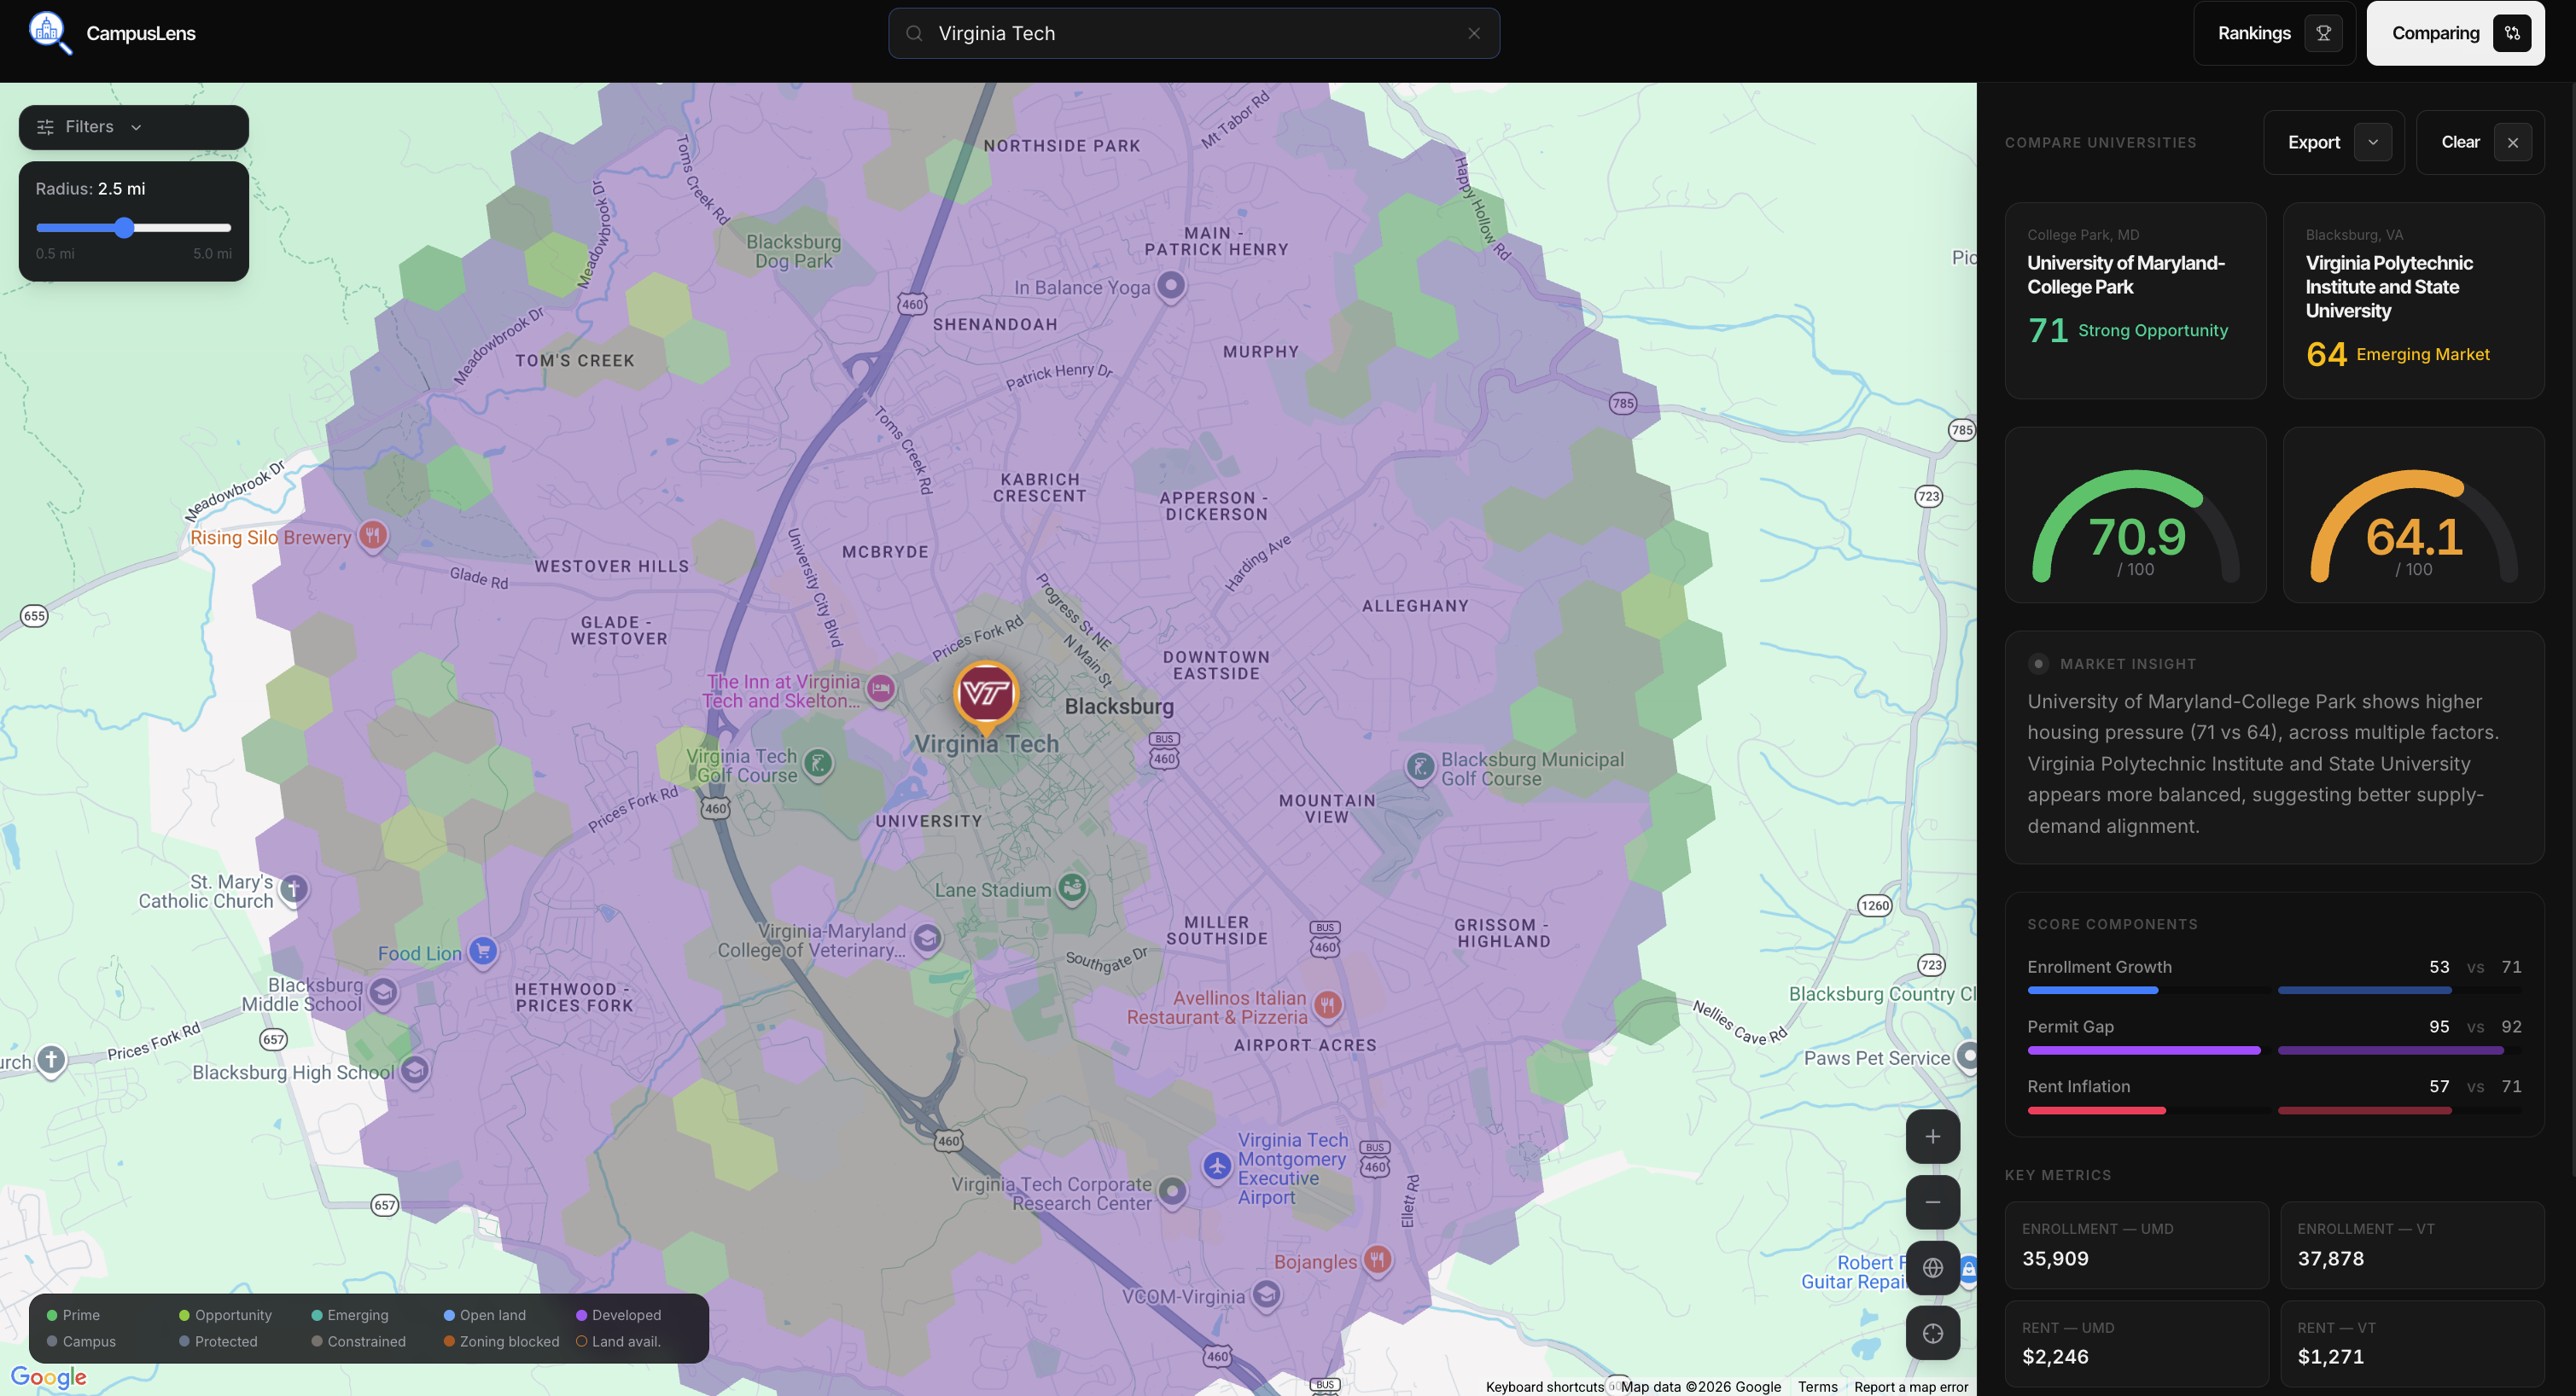
Comparing two potential opportunities with eachoher.
-

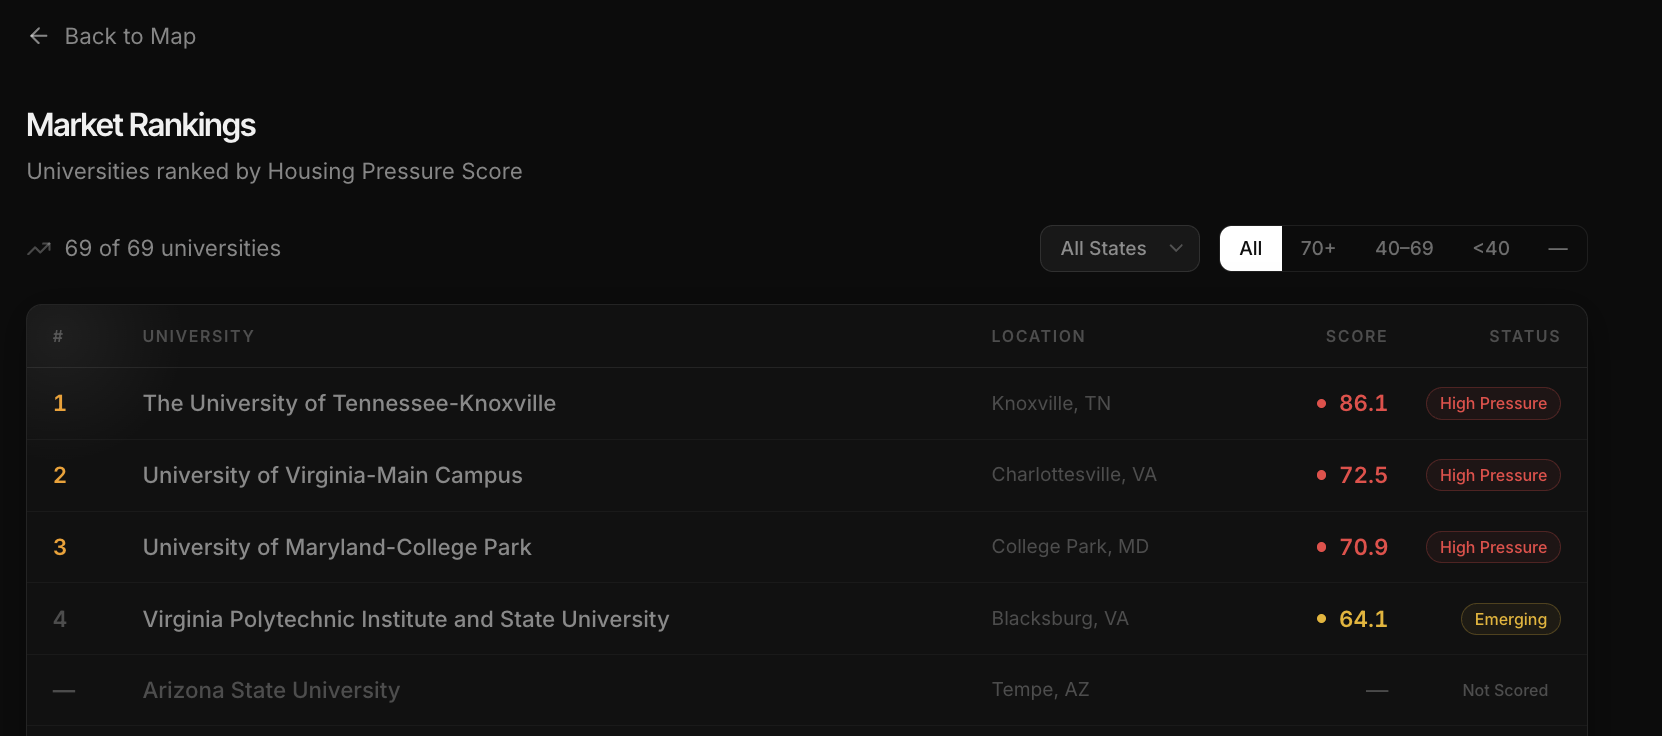
Market leaderboards.
-
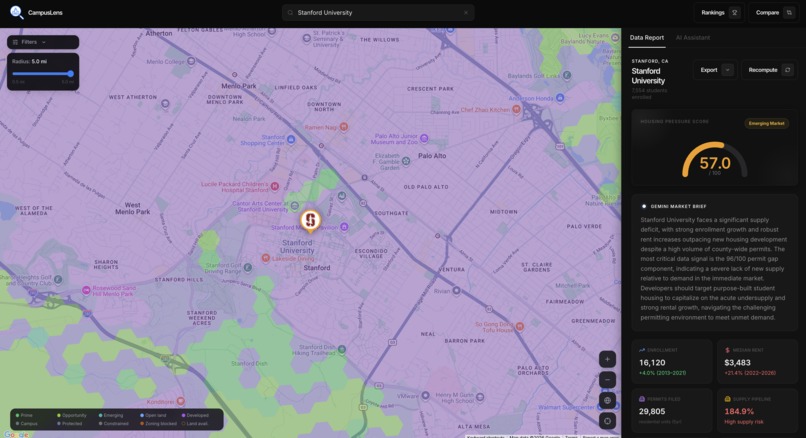
Generate insights about every school, not just the pins on the map.


Inspiration
College housing doesn't keep up with enrollment. A university grows, rents spike, students get squeezed, and by the time a developer responds the market is already two years behind. The data that would predict all of this sits in public databases. Nobody has made it fast to use.
We're students, so we've felt this firsthand. Enrollment is in IPEDS. Permits are in the Census Bureau. Rent trajectories, demographics, retention rates, all public. But by the time any of it reaches a developer's model, months have gone by. CampusLens is our attempt to close that gap.
What it does
One click on any US college kicks off a Gemini-powered agent pulling from IPEDS, Census BPS, FEMA, College Scorecard, and ATTOM in parallel. It computes a 0–100 Housing Pressure Score, writes a market brief, and tiles the campus into a hex grid where every 0.1 mile cell is scored on density, zoning, and transit. Click a hex and you get real lots, owner names, and absentee flags. Everything caches to Firestore so the second lookup is instant.
How we built it
Stack: React + TypeScript frontend on Google Maps, Python FastAPI backend, Gemini 2.0 Flash for streaming briefs and tool-use chat, Firestore for persistence, and Uber's H3 at resolution 9 for spatial indexing.
Housing Pressure Score
Every market gets a score between 0 and 100:
$$\text{HPS} = w_E \cdot E + w_P \cdot P + w_R \cdot R + w_S \cdot S$$
where E is enrollment pressure, P is the permit gap, R is rent growth versus inflation, and S is institutional strength.
Hex opportunity scoring
Each H3 cell h within 5 miles of campus:
$$O(h) = f_d(d_h) \cdot \bigl(\alpha \cdot z_h + \beta \cdot t_h + \gamma \cdot (1 - r_h)\bigr)$$
where f_d is exponential distance decay, z_h is zoning compatibility, t_h is transit access, and r_h is residential saturation. The (1 - r_h) term penalizes dense blocks so we surface where there's actually room to build.
Challenges we ran into
Streaming not persisting : /score/stream returned results to the client but never wrote to Firestore. Every score vanished on reload. Fix was intercepting chunks in the generator and writing to both caches before forwarding. Twelve lines that saved the demo.
Name mismatches : "University of Wisconsin-Madison" vs "University of Wisconsin Madison" broke exact string duplicate detection and stacked two pins on the same coordinate. Fixed with a normalization layer across every name comparison in the codebase.
Rate limits : Overpass, Census BPS, and ATTOM all hit 429s regularly. Added exponential backoff, a fallback Overpass mirror, and aggressive caching.
Accomplishments that we're proud of
The hex model surfacing real parcels with owner names and absentee flags, not just heatmap decoration, is what makes it feel like a real tool rather than a demo toy. And getting the Gemini agent to score a brand new school mid-conversation, drop a pin on the map, and answer follow-ups in the same thread was the most fun thing we built.
What we learned
Public data is not as formatted as you think it is and you only discover when you actually use it. Every source has its own naming convention and none of them agree. Parallel async is only as fast as your slowest adapter, and Overpass regularly takes 8–15 seconds, so you design around the slow path. Streaming LLM output is harder to debug than single requests because errors inside the generator don't always surface cleanly.
What's next for CampusLens
Pull richer data (rent comps, zoning databases, construction costs) to sharpen the briefs, move hex rendering server-side for faster and more precise cells, and get it in front of real developers. A free public leaderboard with gated parcel-level access is the most realistic path to wider adoption.
Built With
- attom-property-data-api
- college-scorecard-api
- css
- deck.gl
- eslint
- fastapi
- fema-disaster-declarations-api
- git
- github
- google-cloud
- google-cloud-firestore
- google-gemini-2.0-flash
- google-maps
- google-maps-platform
- html
- httpx
- ipeds
- lucide-react
- npm
- openstreetmap
- overpass-api
- pydantic
- python
- python-venv
- react
- tailwind-css
- typescript
- uber-h3
- us-census-acs
- us-census-building-permits-survey
- uvicorn
- vite

Log in or sign up for Devpost to join the conversation.