-

Team's Logo
-

Web page1
-
Web page2

Inspiration
As recorded by the students from the University of California, Berkeley, the recent Wildfire in Northern California had dyed the sky into red and black. The California wildfires of 2020 have scorched 3.1 million acres so far, surpassing the record by 1.14 million acres. Wildfire has always been a concern of California, and the largest Wildfire happened these days not only grabbed our attention but also inspired us to create predictions of the spread of the wildfires using machine learning. The historical data of the wildfires in California would be labeled and used to generate the predicted spread of wildfires in the future, which allows the users to access the most updated information of the wildfires in California.
What it does
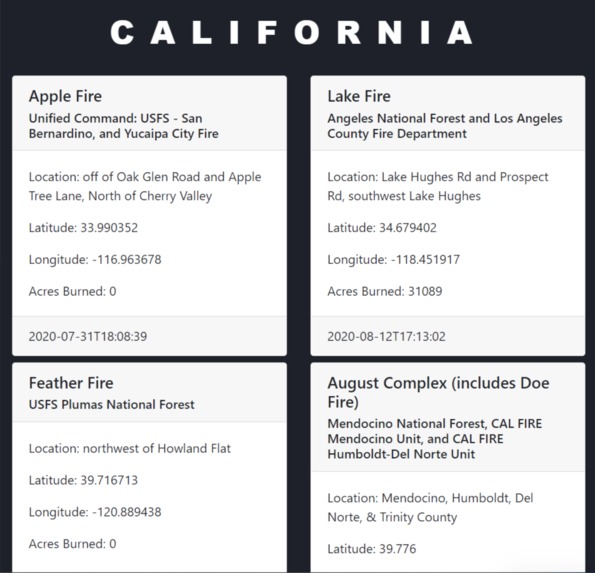
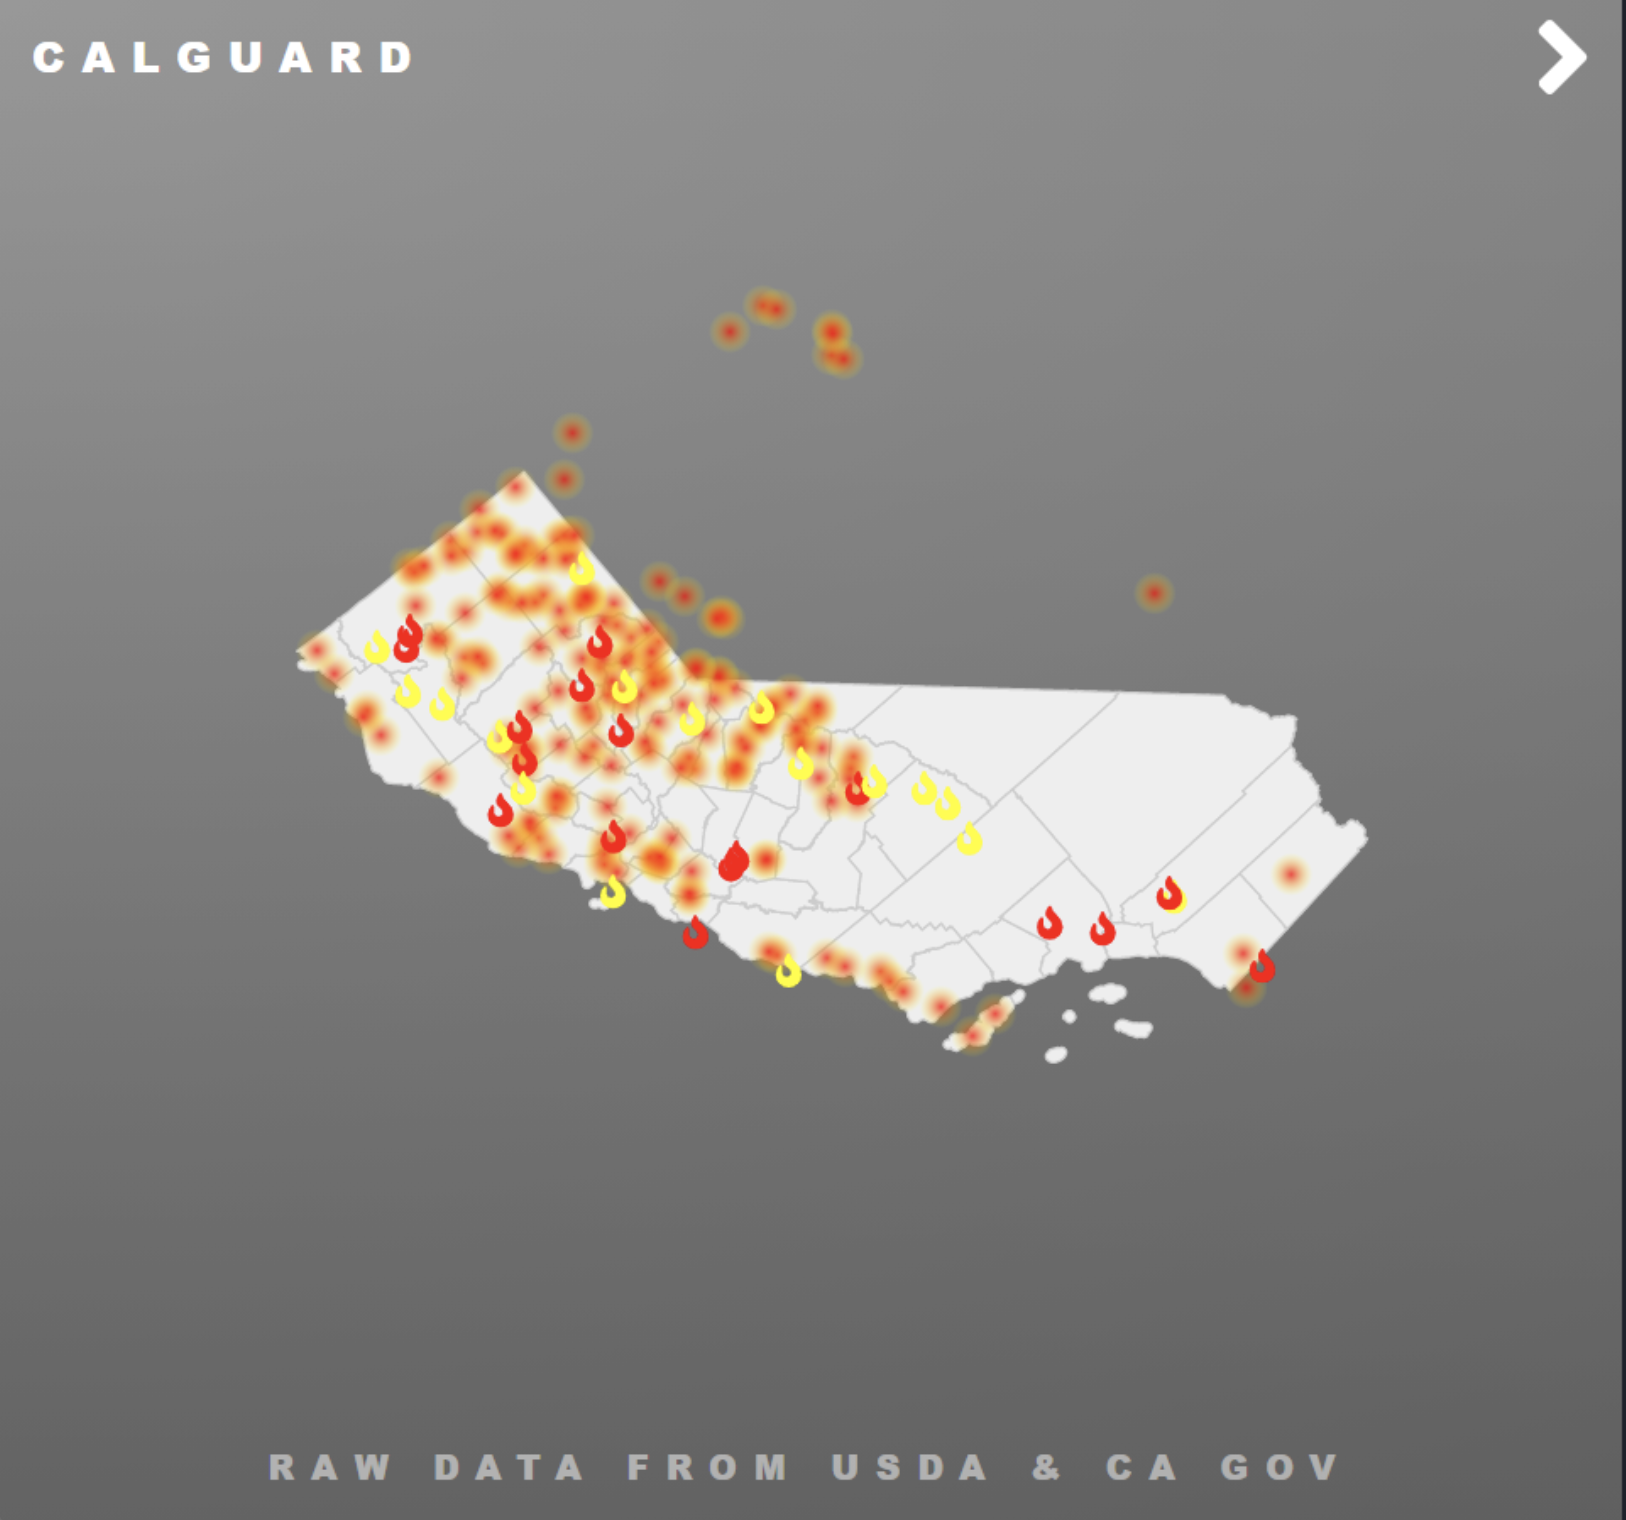
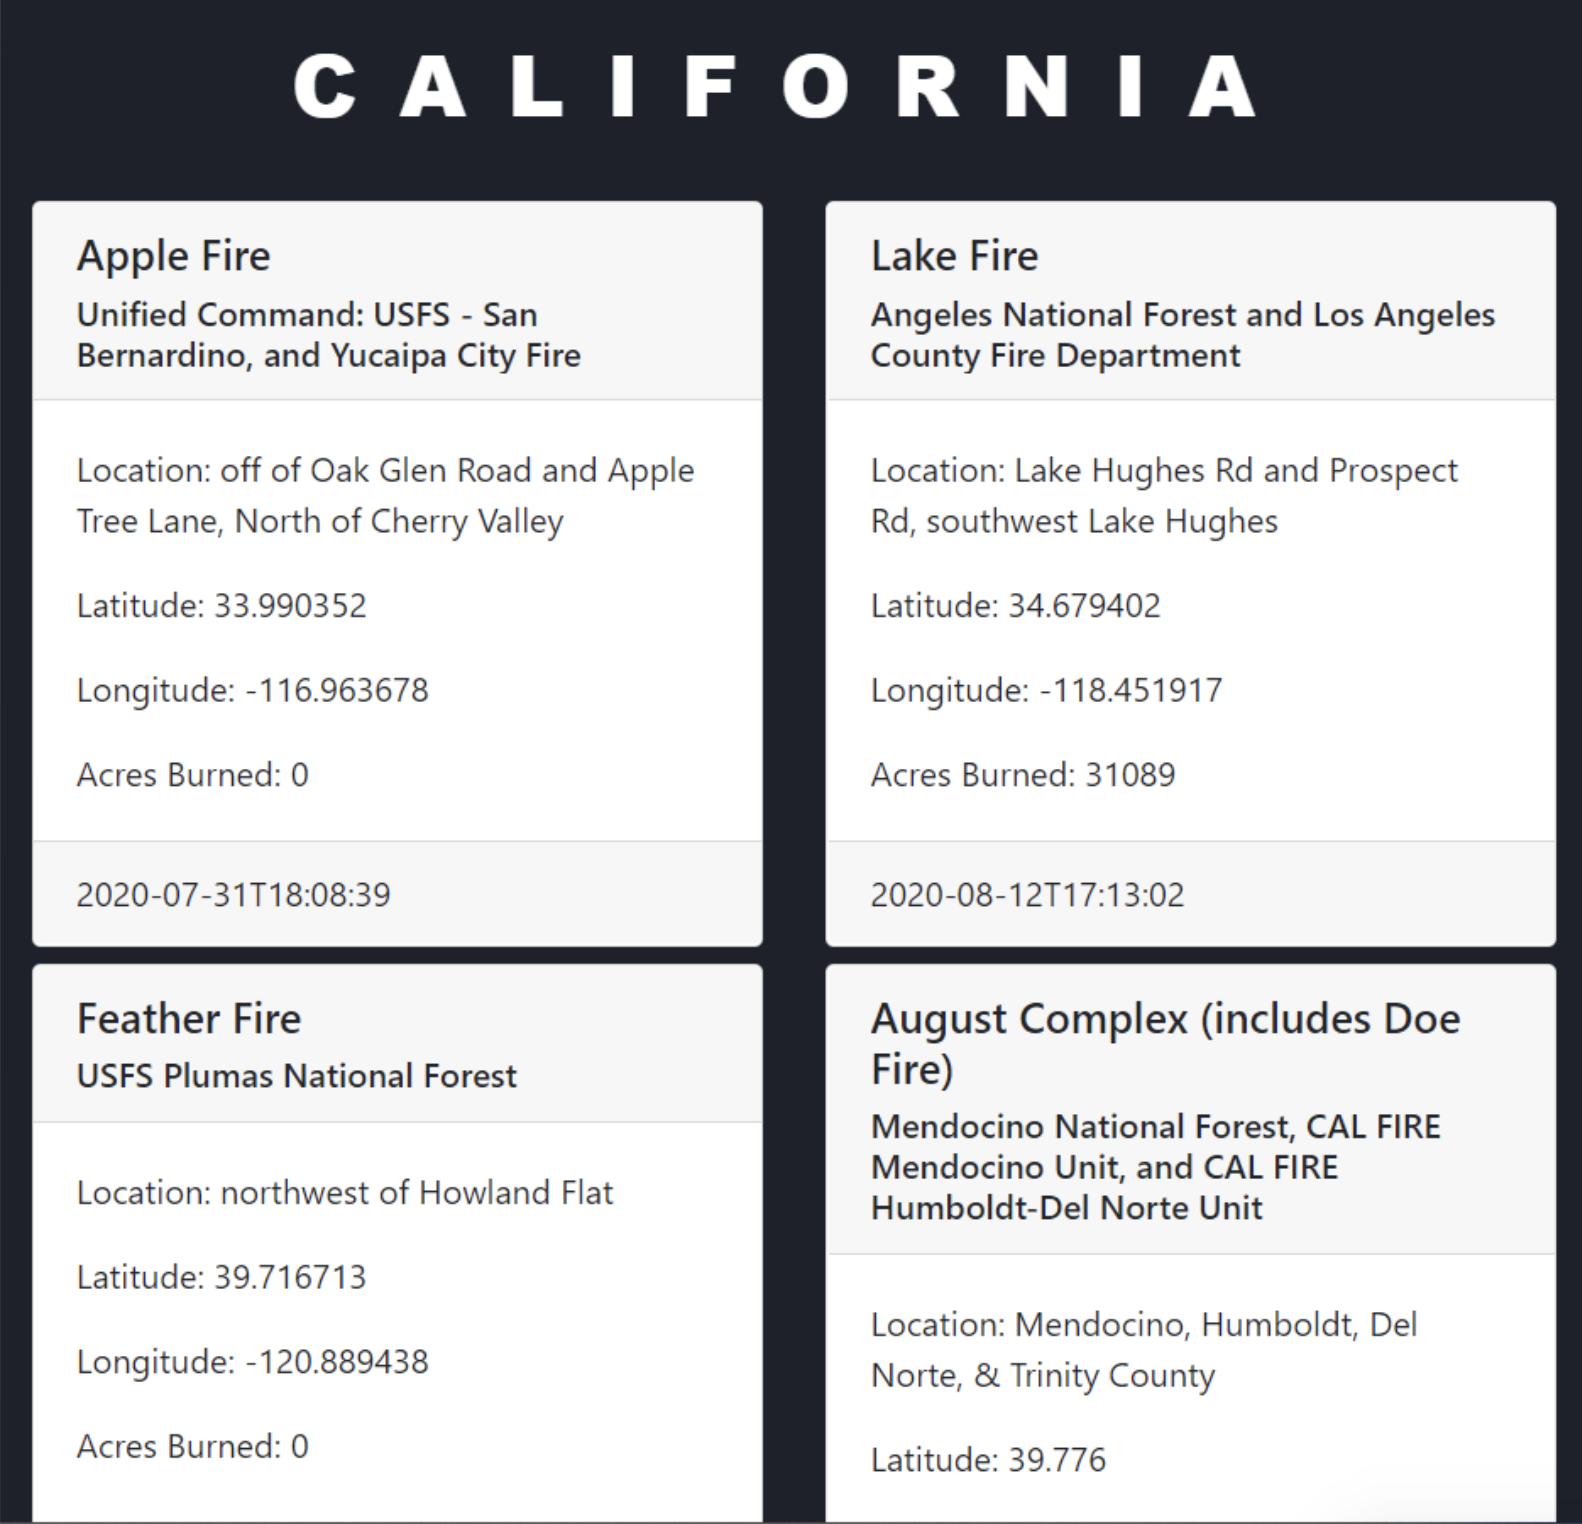
CalGuard is a machine learning-based model that forecasts and predicts future wildfires in California. The website we deployed and designed can visualize our predicted data into user-friendly form with features like zooming in and out the map and focusing on individual counties. It draws daily weather forecast as an input and predicts the potential area that is vulnerable to wildfire and the scope of burn the wildfire could result. In addition, CalGuard system serves as a good indicator of how public assets should be allocated effectively to prevent and mitigate the situation in case of a wildfire emergency.
How we built it
Data Uses
The development of CalGuard started from data input from Google Earth Engine combining with Weather forecasting data published from NASA.
Data Preprocessing
Firstly, we need to normalize our data to combine them and feed them into our multi-classification model. Then we need to clean up our data by filtering those that are not related to the wildfire.
Model Building
We then created a random tree model and logistic regression model to compare the predictive power of the two in forecasting wildfire.
Front-end
Lastly, we connected our backend with a frontend web portal and deployed it on the website by using React and javascript. (/Users/oscaryinn/Desktop/workflow.png)
Technologies put into use
We use google earth engine, geopandas, and GDAL as the main backbone of our model because we are dealing with geospatial data instead of RGB images or sequences of text. On the back-end, we use sklearn, imblearn, and yellowbrick to build our regression and random forest model. On front-end, we use react and javascript to power our web application.
Achievements we are proud of
Build a system that contributes to a good cause
We are able to utilize geospatial data, which is something that we haven't touched before
We are able to connect our machine-learning-based model to a front end
Challenges we ran into
Very few experience working with geospatial data and Google Earth Engine
The data preprocessing part took much much more time than we thought
We have relatively less experience in working in web development (Connecting frontend with backend)
What's next for CalGuard
Improve the model by incorporating a deep learning model: because of the time constraint, it's simply not feasible for us to try to fine-tune and train our forecast in hophacks. However, seeing the effects on our demo version, we are motivated to try out other models
Automate the model: we still need to import the daily forecast into our website. It would be nice to integrate better with our front end.
Data Exploration: we could explore more dimension of data (altitude, elevation, slope, etc)
Web visualization improvement: we could try to make the website cleaner and more user-friendly by incorporating animation
Built With
- gdal
- google-earth
- googleearthengine
- javascript
- jupyter-notebook
- machine-learning
- node.js
- python
- react


Log in or sign up for Devpost to join the conversation.