Inspiration
Forest fires are one of the biggest natural disasters that cause severe damage to land across the United States. We tend to focus all of our effort on fighting the fires, but only a fraction of that effort and money is used towards wildlife restoration. Before 2000, 70% of burned sites returned to their pre-fire tree density; after 2000, 46% did, and about a third of burned sites show no conifer regeneration at all (Stevens-Rumann et al.).
The reason is mechanical. A severe fire kills the trees that would have dropped the seed, and most conifer seed lands within 100–200 m of the tree it fell from (Gill et al. 2022). Modern high-severity patches run to thousands of acres. So the edges of a big burn reseed themselves, and the middle has to be planted by people.
Planting runs on a supply chain with hard dates. Seed is collected as cones, ordered in bushels of cones, and matched to the planting site's seed zone and to within 500 feet of its elevation. In California, sugar pine, red fir and white fir must be ordered by 31 October, and it takes roughly eighteen months from placing an order to having a seedling you can put in the ground. Miss the window and you don't lose a week — you lose a year.
CAL FIRE already publishes this need: 55,978 bushels of cones for 2025, sized to reforest 25% of productive conifer forest on the state's non-federal land, covering wildfire, insect and disease mortality and timber harvest together. That is exactly the right number for planning a statewide collection season. It cannot tell a forester standing in front of one burn what that fire needs.
We went looking for something that could. The nearest tools answer adjacent questions — CAST and the Seedlot Selection Tool match seed to a site's future climate, Terraware runs nursery operations, Regenmapper asks whether a burn will regenerate unaided — but none of them start at a fire perimeter and end at a quantity of cones. So we built that.
What it does
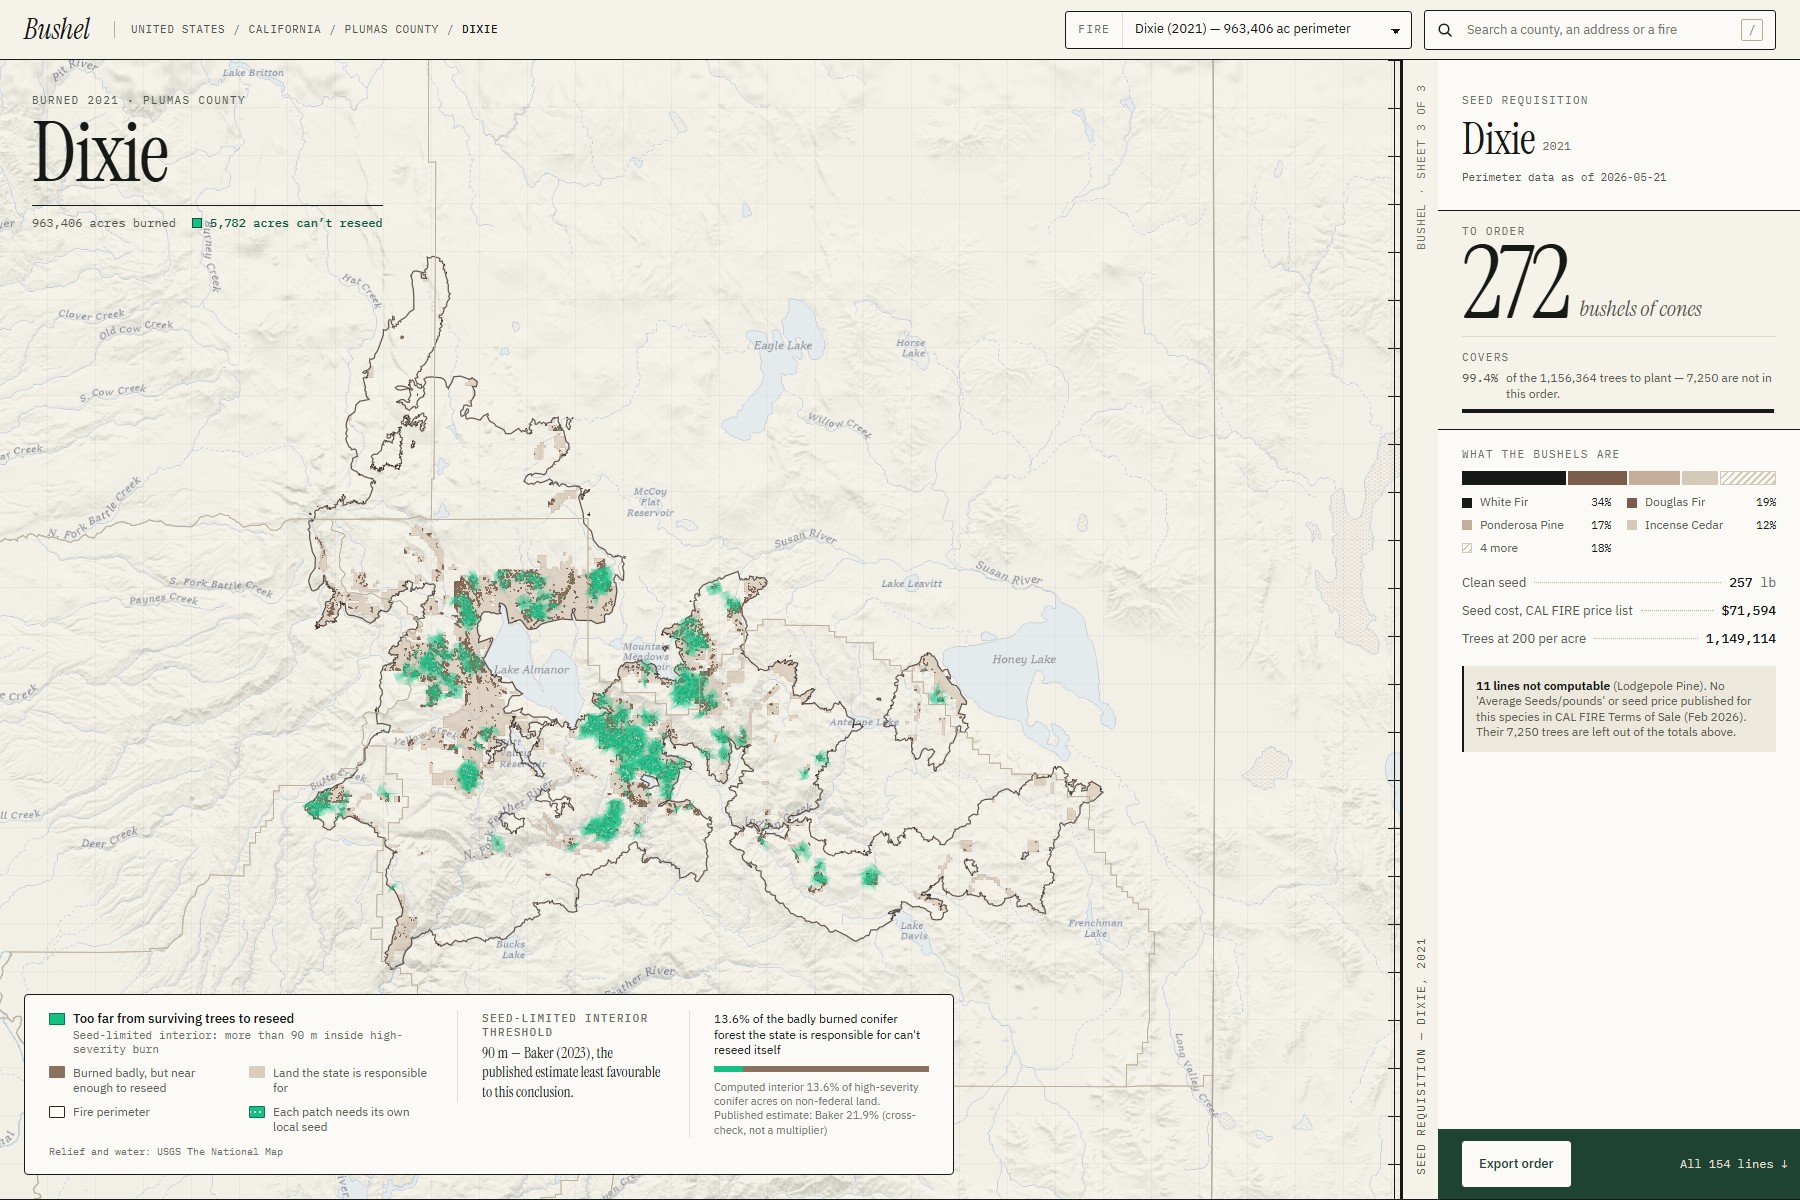
Bushel opens on a map of the United States. California is built and checked, one dot per fire. Every other state in the lower 48 is built live — pick any fire and Bushel assembles it in your browser from national services at that moment.
Take the North Complex (2020), 318,797 acres:
1. Whose land. The perimeter is clipped to CAL FIRE's State Responsibility Area, because that is whose bill it is. The federal acres it drops are reported, not silently removed.
2. How badly it burned. Bushel reads the federal burn-severity record (MTBS) — the same source the state uses — and keeps the high-severity ground.
3. Where the forest can't return on its own. Bushel measures inward from every surviving patch of forest at once, and keeps the pixels beyond seeding range:
$$ S = \lbrace p \in H : d(p, F) > 90 \text{ m} \rbrace $$
Here S is the seed-limited ground, H is high-severity conifer ground on state land, F is surviving forest, and d is Euclidean distance. For the North Complex that is 13,507 acres — about a third of the badly burned conifer ground, not the whole fire. The 90 m threshold is Baker (2023): the published estimate least favourable to our own conclusion. We used the number that hurts us.
4. Where the seed has to come from. That ground splits by seed zone and 500-foot elevation band, with species assigned from what grew there before the fire. Bushel refuses to merge cells to make the totals tidier. We call that the Provenance Lock.
5. The order. Each cell converts through CAL FIRE's own published chain:
$$ \text{acres} \to \text{trees} \to \text{lb of clean seed} \to \text{bushels of cones} \to \text{cost} $$
$$ \text{trees} = \text{seed-limited acres} \times 200 \text{ trees per acre} $$
For the North Complex: 637 bushels of cones, 575 lb of clean seed, 182,072 dollars at CAL FIRE's seed prices — about 2.7 million trees. Every figure shows the CAL FIRE table it came from, and species with no published seed price report trees only and say so rather than borrowing a number.
6. The gap, disclosed. CAL FIRE publishes its method in full:
$$ \text{seedlings per lb} = \frac{\text{seed per lb}}{\text{seed per pot}^{\dagger}} \times \text{nursery survival}^{\dagger} \times \text{P(tree in nursery)}^{\dagger} $$
$$ \text{lb to collect} = \frac{\text{trees needed}}{\text{seedlings per lb}} \qquad \text{bushels} = \frac{\text{lb to collect}}{\text{lb clean seed per bushel}} $$
† — not published anywhere. All three come from internal LAMRC nursery datasets, so the state's own published method cannot be reproduced from public data. Bushel doesn't quietly guess them: they sit in amber, labelled "Not published by CAL FIRE", with the formula on screen, and you set them to your own nursery's figures. The order recalculates as you drag. Publish those three numbers and this becomes reproducible for every state.
7. Anywhere. Search a county and see its fires ranked by ground that can't reseed. Search an address and Bushel says which perimeter it falls inside. Every view has its own link, and a searched address never goes into one — the link carries the point rounded to about 100 m.
How we built it
The architecture follows from one observation: every factor a user can adjust sits downstream of acres-per-cell-per-species. So all the geography can be precomputed, and everything after that boundary is arithmetic.
PIPELINE (Python) — pre-built or live
  perimeter → jurisdiction clip → severity → seed-limited interior
            → seed zone × elevation partition → species allocation
                         │  static JSON
        ═══ PRECOMPUTE BOUNDARY ═══
                         │
IN BROWSER (TypeScript)
  acres → trees → pounds → bushels → dollars
  pure arithmetic · no I/O · no network · no model
Four things fall out of that split: adjusting an assumption is instant, the numeric path is a pure function and trivially testable, the deployed site is fully static with no backend to fall over, and any fire outside the pre-built set can be built live through the same code.
The geometry runs in California Albers (EPSG:3310), an equal-area projection in metres — nothing is measured in latitude and longitude, because a degree of longitude is not a fixed distance. The seed-limited interior is a Euclidean distance transform over the 30 m severity grid, measured from every surviving forest patch simultaneously; the 90 m threshold is three pixels.
For the rest of the lower 48 there is no state pipeline, so the browser assembles one from seven public federal services — MTBS perimeters and severity, PAD-US ownership, FIA BIGMAP forest type, USFS Individual Tree Species basal area, the provisional national seed zones (Bower et al. 2014) and USGS 3DEP — then runs the identical interior and partition steps. A 200,000-acre fire takes 6–25 seconds. On the Caldor fire the live build finds 2,250 seed-limited acres where the California pipeline finds 2,239 — a 0.5% difference across two independent data stacks.
We wrote the spec, data contracts and task list first (Spec Kit), then implemented with an AI coding agent (Claude Code). Front end is React, Vite and MapLibre GL JS; tests are pytest, Vitest and Playwright.
Challenges we ran into
- Four unit traps, all the same family. A bushel measures cones, not seed. "Seeds per pound" is not seedlings per pound — substituting one for the other silently assumes 100% germination and 100% survival. The state's survival factor is calibrated to two-year seedlings while the nursery sells one-year plugs. Nursery survival is not survival after outplanting. Each would have quietly changed the answer; each is now a test.
- The agency contradicts itself. CAL FIRE's methodology works in bushels of cones; its conclusion section says "bushels of conifer seed". We follow the methodology and footnote the contradiction on screen.
- Nearly counting a correction twice. Our first design buffered the fire and applied Baker's 21.9% — but 21.9% is itself the result of a 90 m buffer. We compute the buffer and use 21.9% only as an independent check, never as a multiplier.
- A check that comes in low, and stays visible. Our statewide count of burned non-federal conifer land is 830,011 acres against the state's 1,507,830 (a 45% shortfall). The causes are specific and published on the page: the state also counts Local Responsibility Area land and restricts to a timberland boundary it doesn't release.
- Fragile public services. A retired State Responsibility Area endpoint, an image service that fails on oversized tiles, a map server that errors on large pages. We page, tile and retry with exponential backoff. Eighteen statewide builds still died on dropped connections; a resumable retry finished them.
- A blank map on phones. The map fitted the fire before its container had settled. Caught in our own audit, fixed, and now covered by a phone-sized browser test.
Accomplishments that we're proud of
- The seed-limited interior is computed, not assumed. It's a distance transform over real severity pixels, not a published percentage applied to the burn area.
- Every fire in the state's window — all 237, not a hand-picked demo set — and the site names the fires that couldn't be built and why.
- Live builds match pre-built ones, so "pre-built" never quietly means "made up".
- The statewide result checks out against an independent published figure. Pooled across all 237 fires, 53,638 seed-limited acres out of 239,581 high-severity acres gives 22.4%, against Baker's published 21.9% — computed independently, and treated as corroboration rather than proof.
- The agency's gap is disclosed precisely. Three named factors stand between CAL FIRE's published method and a reproducible one, and we show exactly which three.
What we learned
Where we started. Our earlier hackathon projects were web apps built on documents — one drafts appeals against insurance denials, one is a scam-training simulator. Neither touched a map. Bushel is the first time either of us worked with geospatial data.
The geospatial learning curve:
- Coordinate systems. A degree of longitude is not a fixed distance, so nothing can be measured in latitude and longitude. Every layer is reprojected to an equal-area projection in metres before a single acre or a 90 m distance is computed.
- Grids versus shapes. Burn severity is a 30 m raster; perimeters, ownership and seed zones are polygons. Knowing when to switch between them — and that a 90 m threshold is three pixels in a distance transform — was the core technical lesson.
- Real geometry is messy. Merging agency polygons produces slivers, self-intersections and mixed geometry collections that crash later steps. Repairing geometry became a pipeline stage of its own.
- Public services fail, routinely. Paging, tiling and backoff aren't optional when the whole app depends on other people's map servers.
- Web map performance. Loading map code on demand cut first-load JavaScript from 1,283 kB to 267 kB; dropping shapes too small to render cut map data from 24 MB to 14 MB. A test now fails if the shipped payload grows.
The bigger lesson was about claims, not code. Writing the implementation was the fast part; deciding what was true was the slow part. Three habits came out of it:
- Ask what a number actually counts — its units, its population, its jurisdiction, its year — before it goes anywhere near the product. Several claims we were confident in fell apart under that one question.
- Read the agency document in full. The 200 trees-per-acre figure is in the state's report; a "180" figure circulating online is not in any primary source we could find.
- Put the contested estimate inside the product, and pick the one least favourable to yourself. It's the only version of the argument that survives someone checking it.
What's next for Bushel
- Publish three numbers and this becomes reproducible anywhere. Seeds per pot, nursery survival rate, and probability of a tree in the nursery — the three † factors above. That is the entire distance between CAL FIRE's published method and one any state could verify.
- The rest of the West. Every California-only layer already has a public national counterpart, and Dobrowski et al. (2024) estimated eleven western states' reforestation need using the same seed-limited idea — a published total to check ourselves against.
- Current fires, once rapid post-fire severity products are validated for this use. MTBS severity lags a fire by about a year today, which is why the app says so on screen rather than pretending otherwise.
Built before vs during the event
The submission window ran from 20 August 2026 (21:00 PDT) to 20 September 2026 (14:00 PDT). Everything in Bushel was made during it. Idea research and fact-checking ran 16–17 September; the repository's first commit is 17 September 2026; all code, tests, data builds and the design system followed. Nothing was carried over from an earlier project.
Not ours, and credited: the CAL FIRE reports and tables, the public agency data, LEMMA GNN 2023.1 (Oregon State University), the Spec Kit templates, the Vite React starter, and the open-source libraries listed under Built With. The implementation was written with Claude Code from our own written spec, data contracts and task list.
Built With
- arcgis-rest
- fia-bigmap
- geopandas
- github
- lemma-gnn
- maplibre-gl-js
- mtbs
- numpy
- openstreetmap
- pad-us
- playwright
- pyproj
- pytest
- python
- rasterio
- react
- scipy
- shapely
- spec-kit
- typescript
- usgs-3dep
- vite
- vitest

Log in or sign up for Devpost to join the conversation.