Inspiration
I live in Fort Bend County, where the Brazos River runs through Richmond, Rosenberg and Sugar Land. During Hurricane Harvey in 2017 the Brazos at Richmond crested at 55.19 feet, about 10 feet above flood stage and a record for that gauge. The county ordered mandatory evacuations along the river, and its emergency office estimated about 200,000 residents were impacted. Every summer we also get heat indexes over 100°F.
The data to stay safe is already public, but it's scattered. River levels are on NOAA hydrographs, warnings are on weather.gov, flood zones are in a FEMA GIS viewer, and "what do I do?" is on county pages. Most families aren't going to cross-check four government sites in the middle of a storm, and many of our neighbors are more comfortable in Spanish. I wanted one page that answers one question: "Am I okay right now, and if not, what should I do?"
What it does
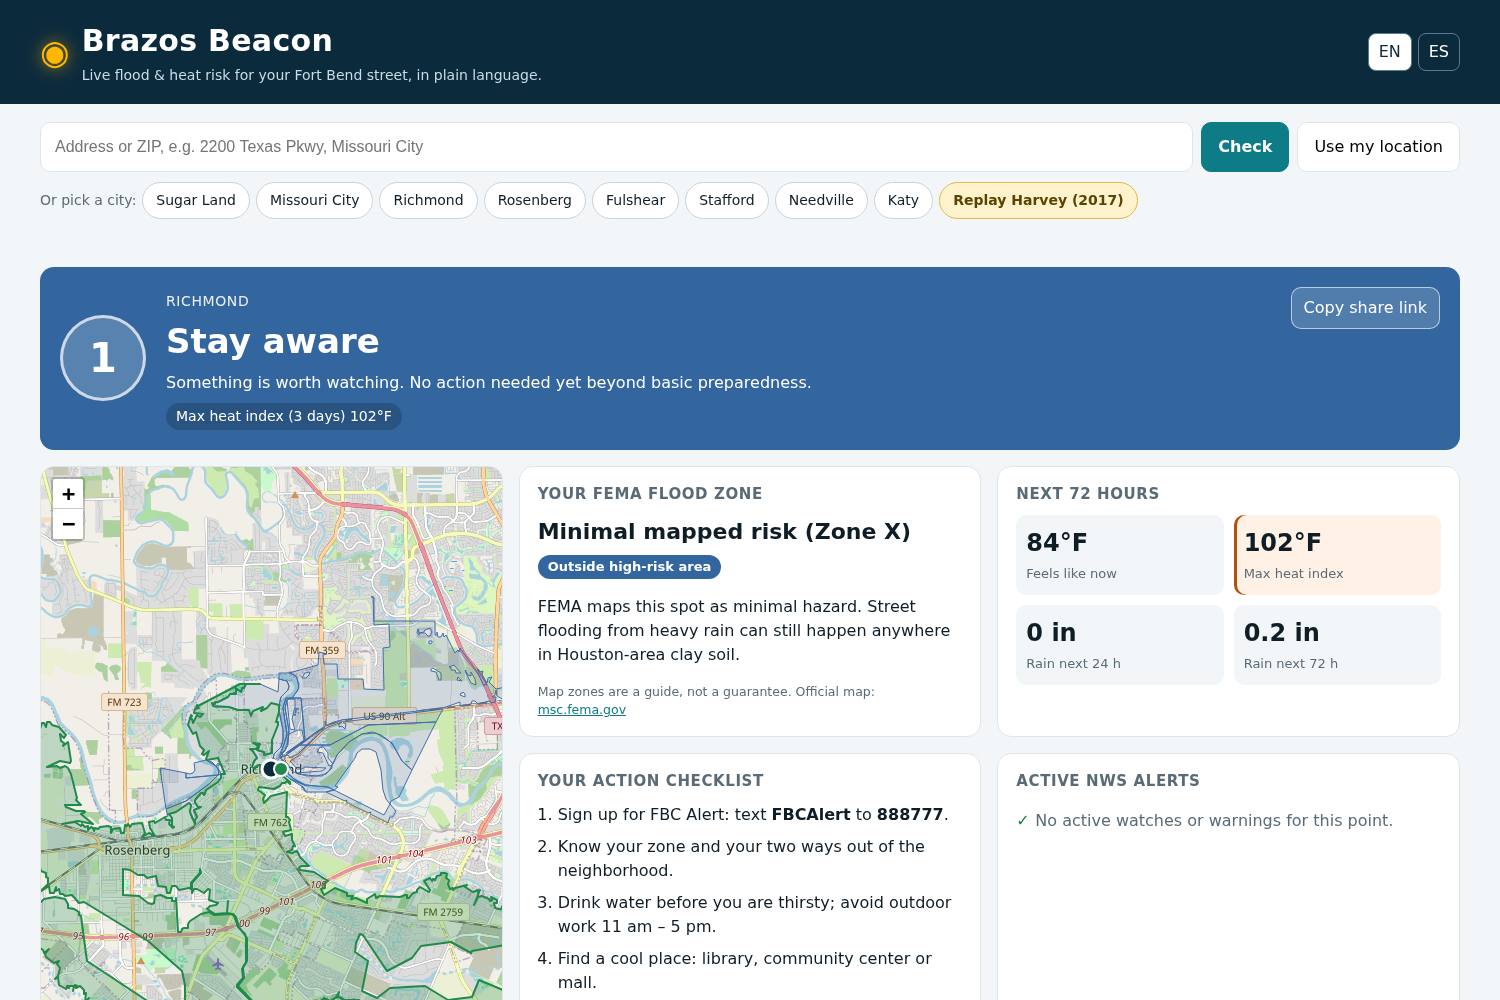
Type an address or ZIP (or tap "Use my location", pick a city, or click the map) and Brazos Beacon shows:
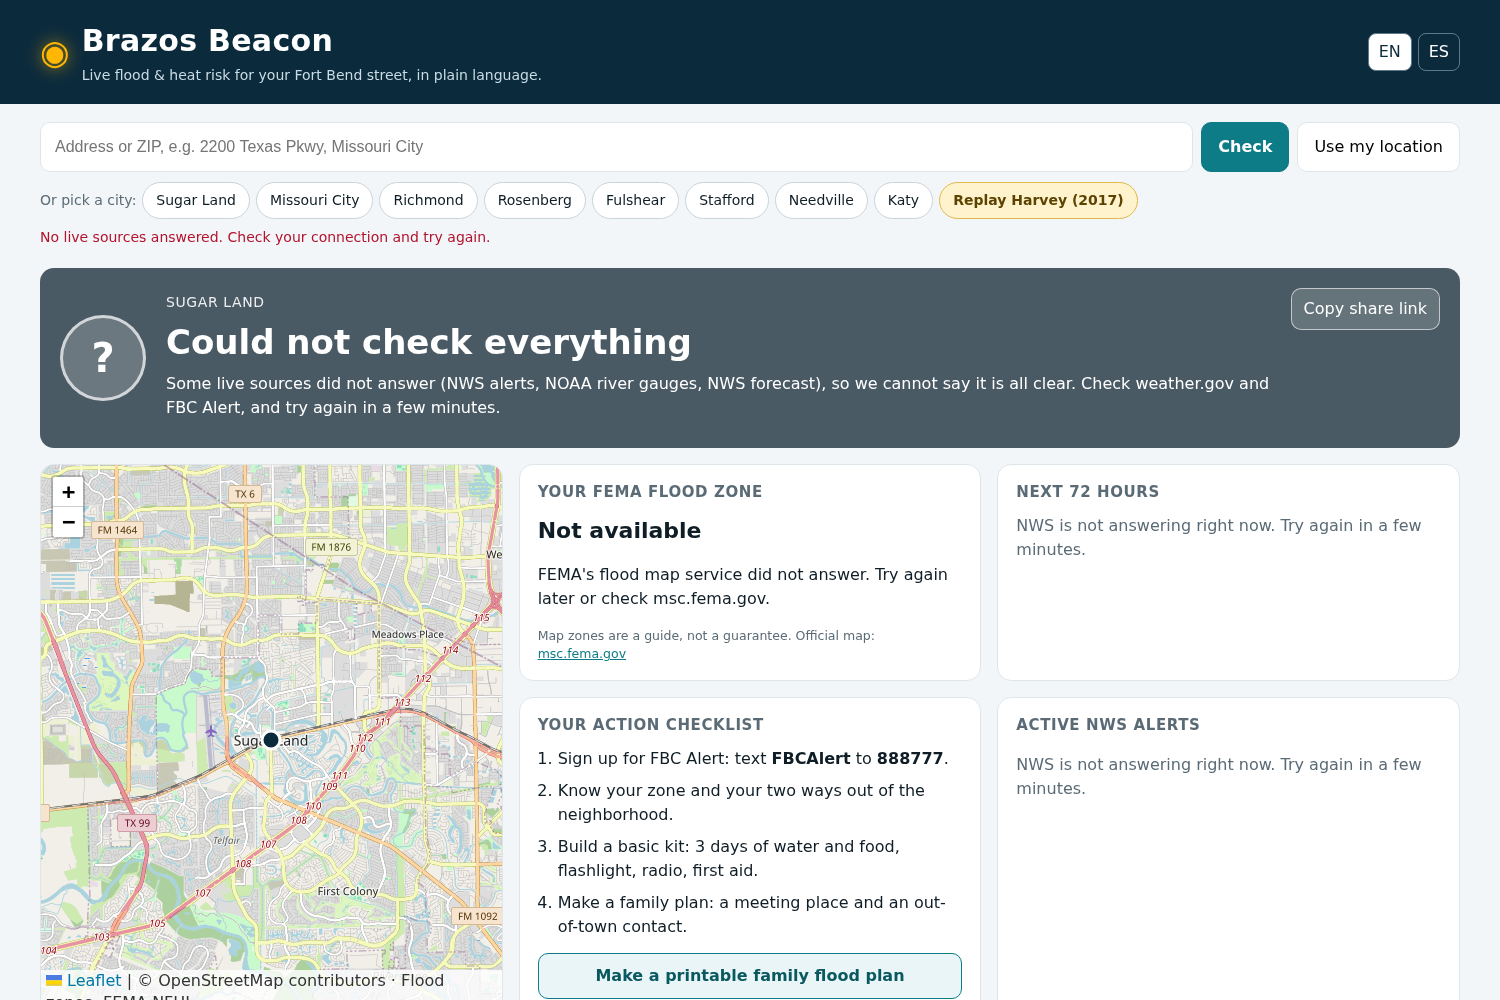
- One Beacon level from 0 to 4 (All clear → Stay aware → Get ready → Take action → Danger) with chips that say why, like "Max heat index (3 days) 102°F". If a live source doesn't answer, it says "Could not check everything" instead of a false all-clear.
- Your FEMA flood zone at that exact point in plain language (for example "Minimal mapped risk (Zone X)" or "High risk (Zone AE)"), with the zone's shape drawn on the map.
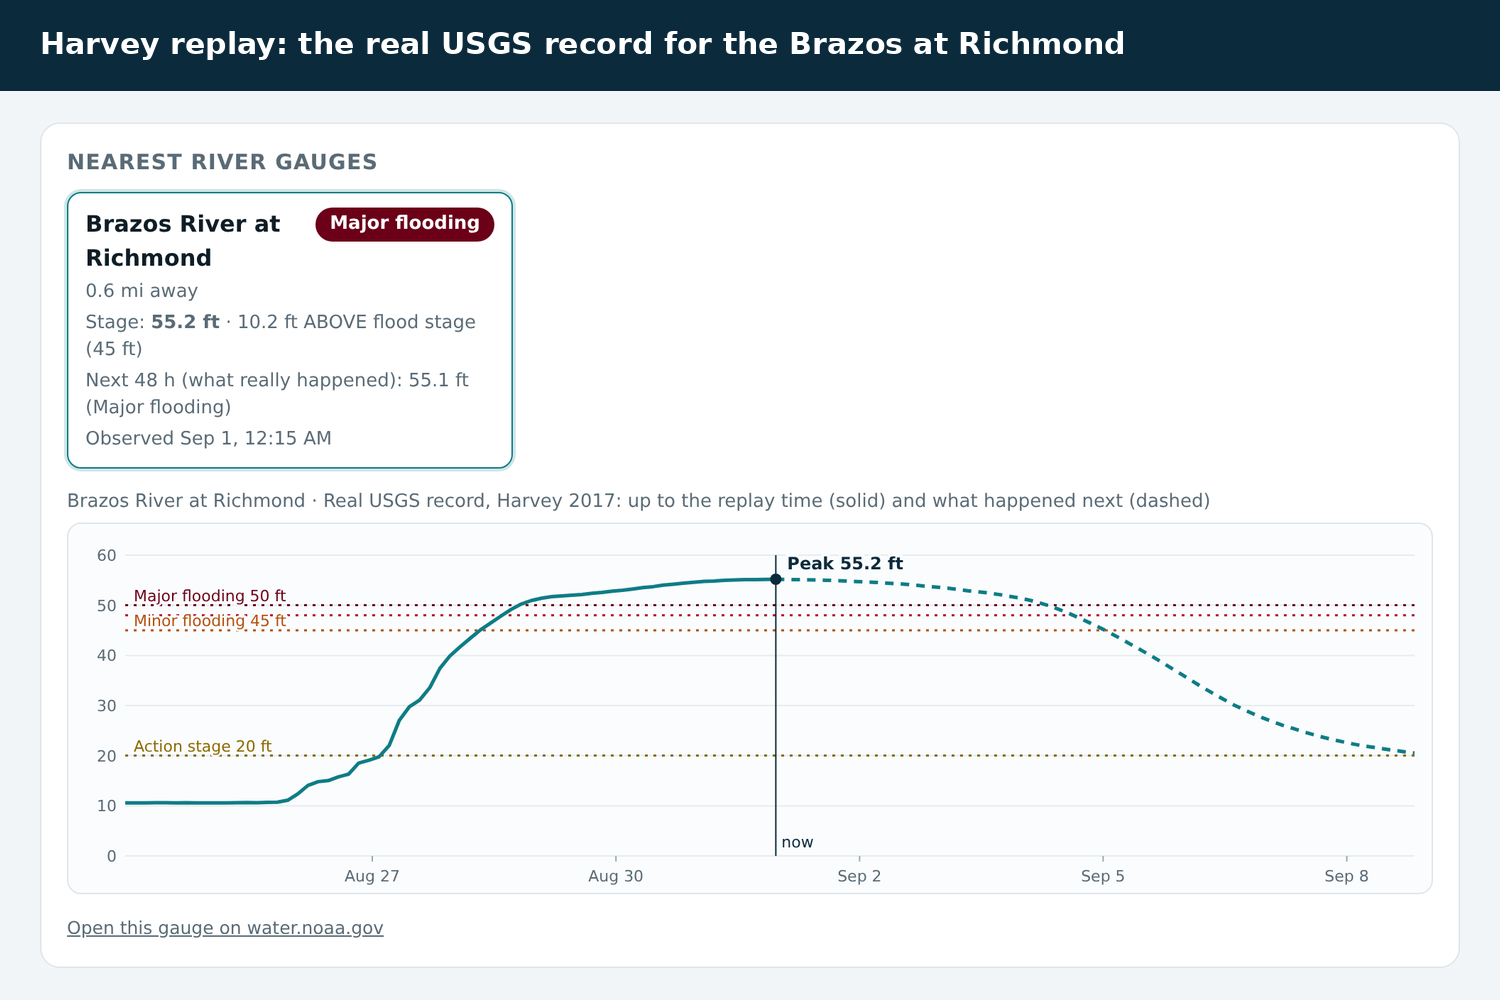
- The 5 nearest river gauges: distance, current stage, how many feet below (or above) flood stage, the high point of the official NWS 7-day forecast where one exists, and when it was observed. Gauges more than about 9 miles away are listed but marked "too far to change your level."
- A hydrograph for the selected gauge: the last week observed (solid) and the NWS forecast (dashed), with flood-stage lines and a link to the gauge on water.noaa.gov.
- Active NWS watches and warnings for that point.
- The next 72 hours: "feels like" now, max heat index, and forecast rain for 24 h and 72 h.
- An action checklist that changes with your level and flood zone (FBC Alert sign-up, heat safety, flood insurance's usual 30-day wait in high-risk zones, go-bag, "Turn Around, Don't Drown," evacuation steps at the top levels), plus links to Fort Bend help and sign-ups.
- A printable family flood plan for that spot: one Letter page with your FEMA zone, the level when printed, the nearest gauge and its flood stages, what to do at levels 2–4, a Ready.gov go-bag list, Fort Bend numbers, and a QR code back to the live page. You can fill in household, contacts, meeting places, medicines and pets, or leave blanks. What you type stays in your browser and is never sent anywhere.
- Works when the signal drops: it installs to your home screen, and if no source answers it shows the last check for that same spot (only if under 72 hours old), clearly labeled with the time and age. A different spot gets the honest "Could not check everything" state instead.
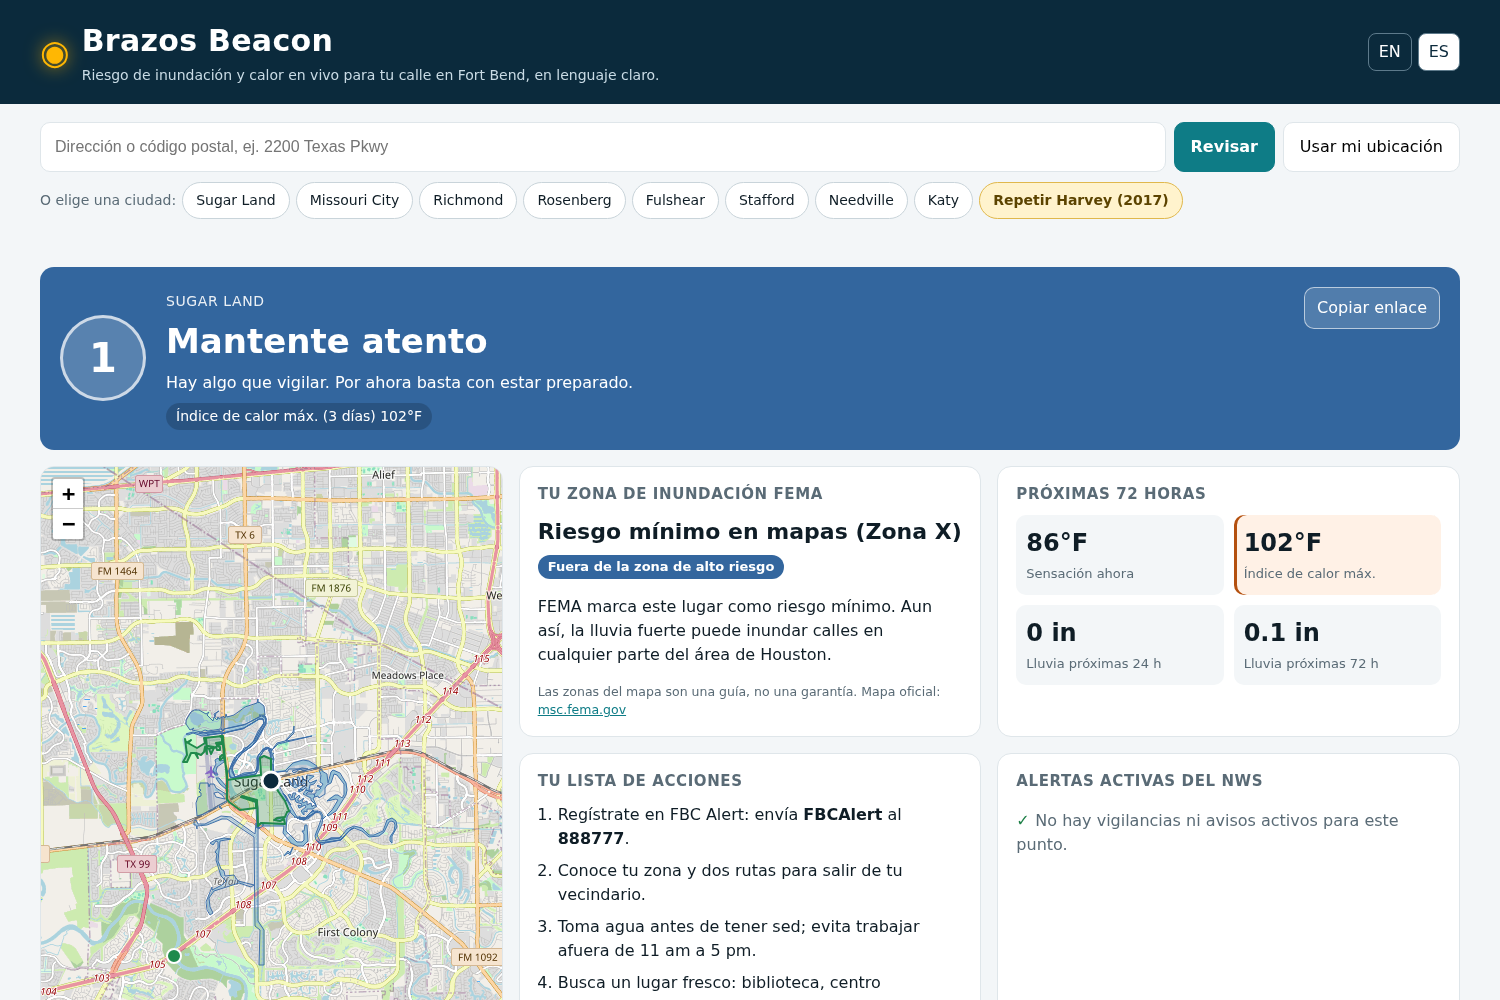
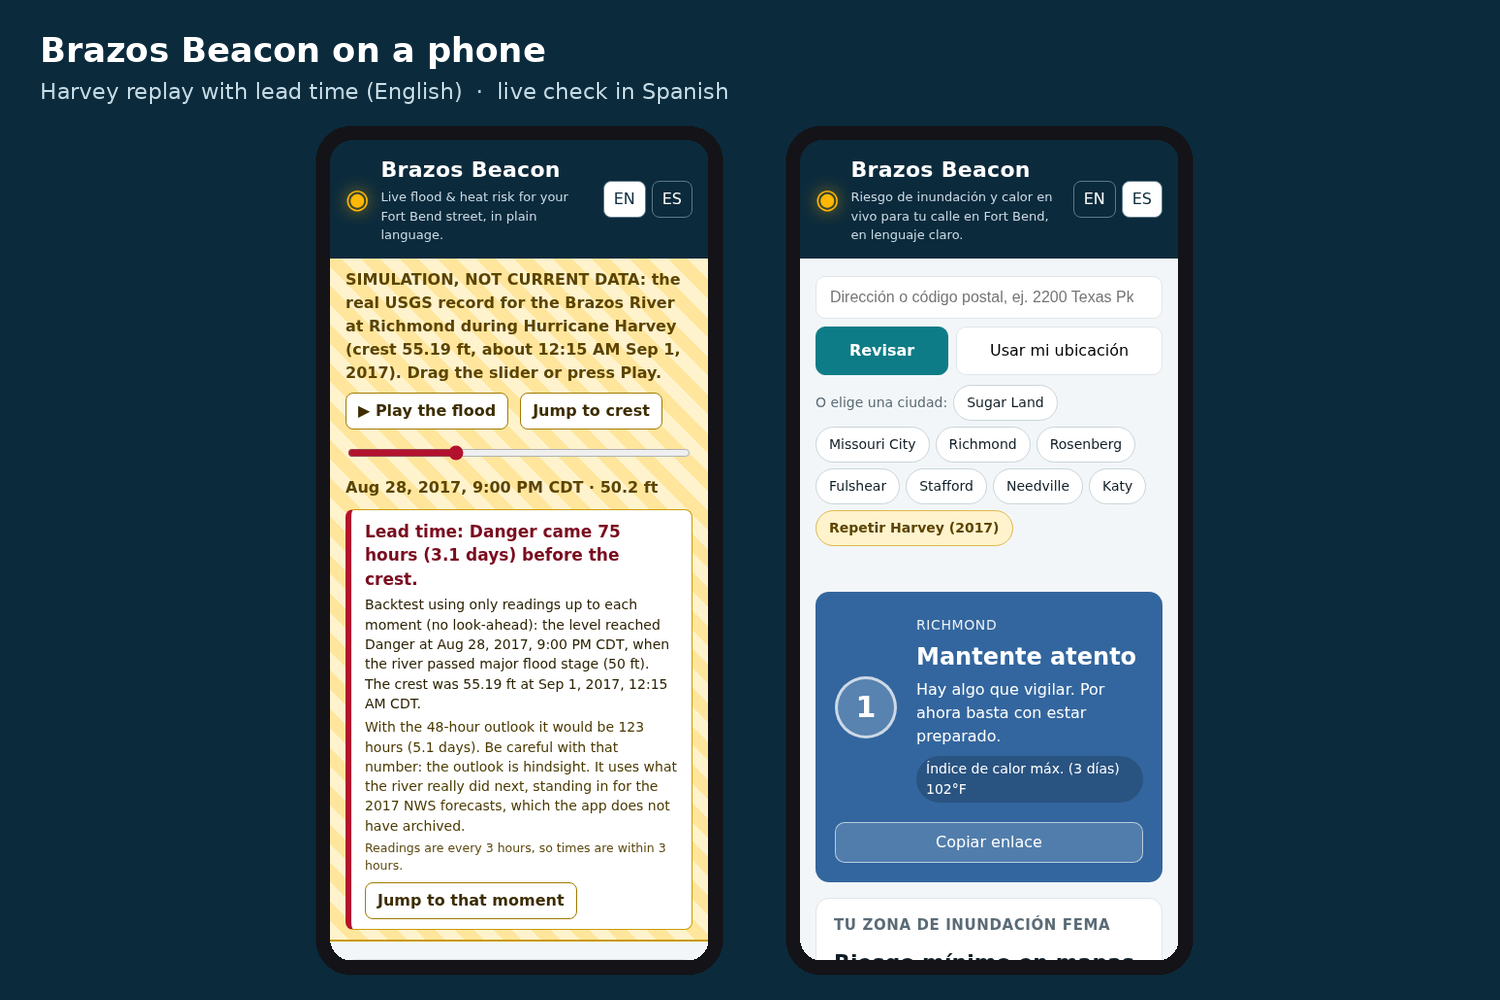
- English and Spanish, and share links (with a preview image) so you can text your exact view to family.
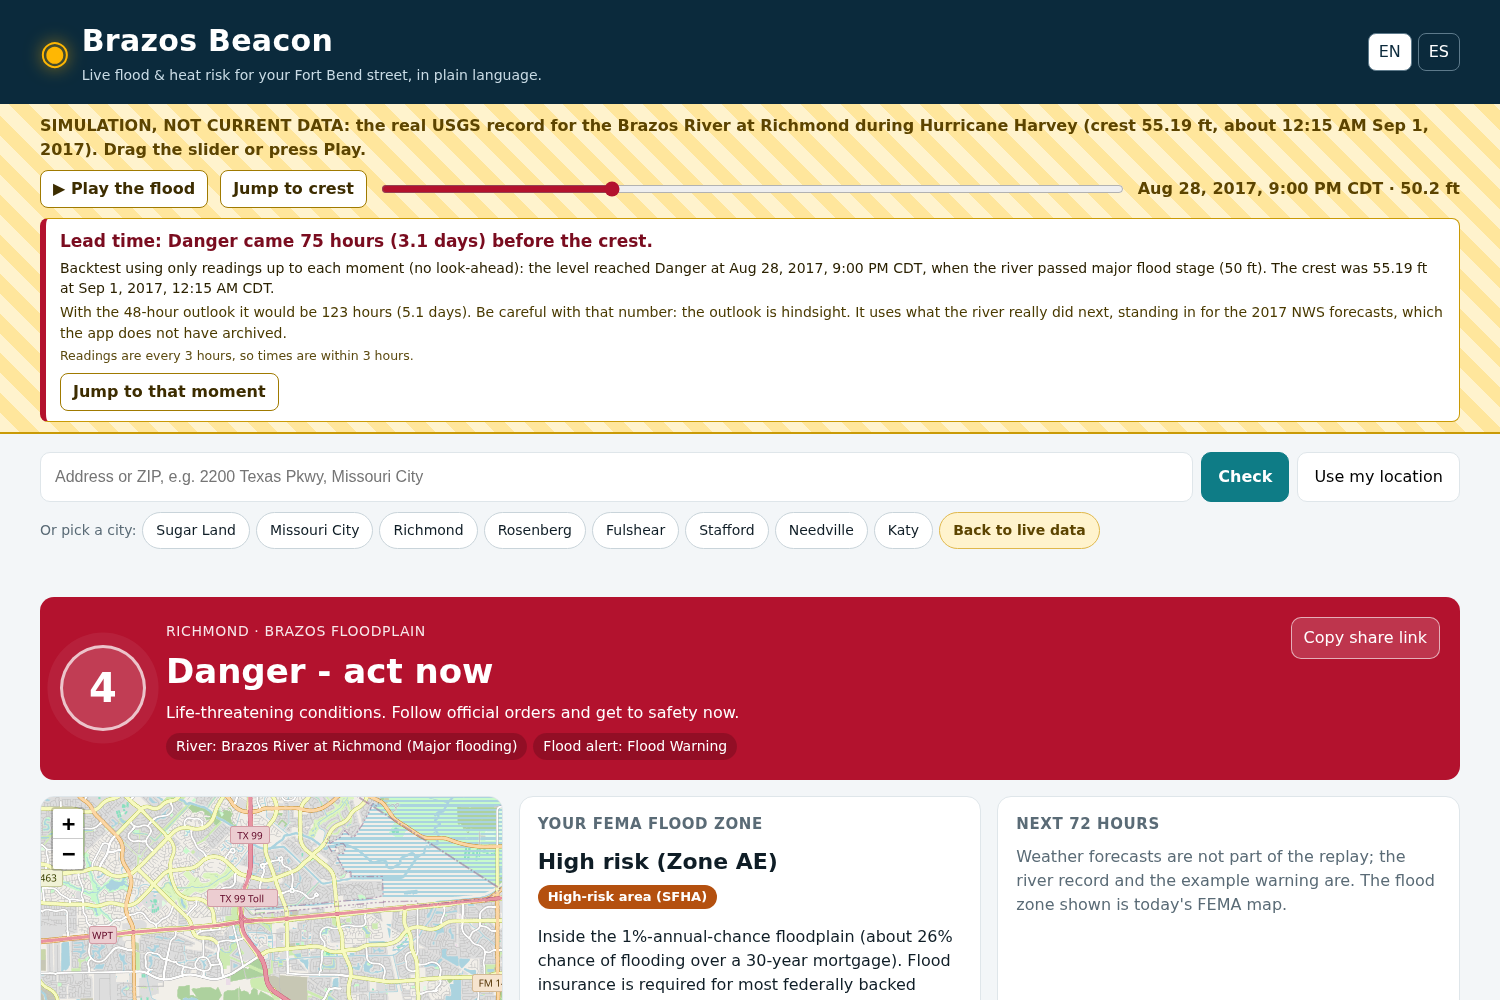
- Replay Harvey (2017): a clearly labeled simulation that loads the real USGS gauge record for the Brazos at Richmond (Aug 24 – Sep 8, 2017) for a spot inside the FEMA floodplain. Press "Play the flood" or drag the slider and watch the level go from All clear up to Danger and back down. The current stage only uses readings up to the chosen moment. Because the app doesn't have the archived 2017 NWS forecasts, its "next 48 hours" outlook uses what the river actually did next, labeled "what really happened," and the flood warning it shows is a re-created example, also labeled.
- Lead time, stated honestly: a box in the replay says how much warning the app gave. Using only readings up to each moment (no look-ahead), the level reached Danger 75 hours (3.1 days) before the crest (9 PM CDT, Aug 28, 2017, when the river passed major flood stage). With the 48-hour outlook it would be 123 hours, and the box says that number is hindsight. "Jump to that moment" moves the slider there.
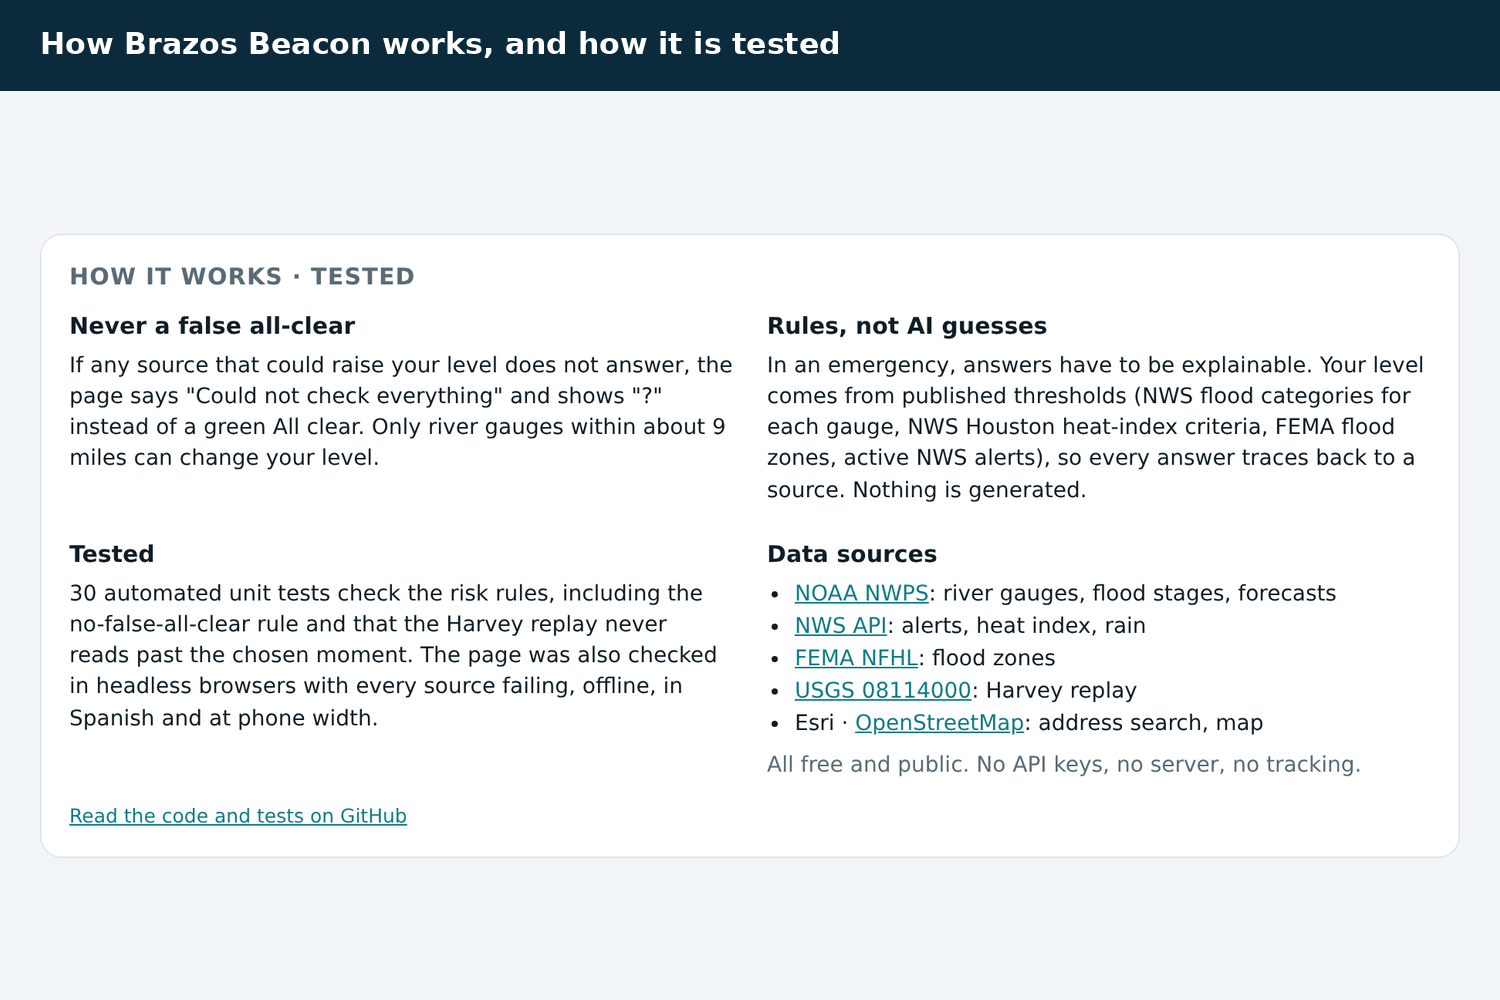
- A "How it works · tested" panel at the bottom of the page: the never-a-false-all-clear rule, why it's rules-based instead of AI, the test count, and the data sources.
How we built it
- A static site (HTML, CSS, vanilla JavaScript) on GitHub Pages. No server, no build step, no API keys, no tracking.
- Data: NOAA National Water Prediction Service (gauges, flood categories, stage forecasts), the National Weather Service API (point alerts, gridded heat index and rainfall), FEMA's National Flood Hazard Layer (ArcGIS REST query for the zone polygon at the point), Esri World Geocoder with OpenStreetMap Nominatim as a fallback, USGS water data for the Harvey replay, and Leaflet + OpenStreetMap for the map.
- logic.js holds the risk rules as pure functions that run in the browser and in Node, covered by 30 unit tests: NWS flood categories (including missing values), feet to flood stage, forecast crest, the NWS Rothfusz heat-index formula and NWS Houston's heat criteria, FEMA zone meanings, ISO-8601 interval parsing for rainfall totals, the "never a false all-clear" rule, the replay's stage never reading past the chosen time, the replay's lead-time numbers with and without look-ahead, the family plan's gauge choice, and the offline snapshot rules.
- Every source loads in parallel and independently with timeouts, so one slow agency doesn't break the page, and the page says which source is missing.
- The hydrograph is a hand-built SVG chart (no chart library). The printable plan is HTML with a print stylesheet, and the QR code uses the small MIT-licensed qrcode-generator library bundled in the repo.
- A service worker caches the app shell (network first, so a new deploy wins when online). Agency data is never cached by the service worker; the last result for a spot is kept in localStorage for the offline fallback.
- Testing: unit tests in Node, plus headless runs (jsdom and Chromium) against the live APIs, with every API failing, with one failing, through the replay, in Spanish, offline, and at phone width on the real aariv.me domain.
- Rules-based on purpose, not an LLM: in an emergency, answers have to be explainable, cited and never made up, so every level traces back to a published NWS or FEMA threshold.
- AI help, stated plainly: I built this with an AI coding agent doing much of the code writing and testing. The data sources, thresholds, phone numbers and historical facts were checked against official pages before they went in.
Challenges we ran into
- Making "risk" honest. A flood at a gauge 20 miles away shouldn't turn your screen red, so only gauges within about 9 miles change your level, and if FEMA maps you outside the floodplain the river counts one category lower. Heat uses NWS Houston's advisory (108°F) and warning (113°F) heat-index criteria, so an ordinary hot afternoon doesn't set off alarms. If a source fails, the app never shows a green "All clear."
- Different gauge datums. Some Houston gauges report water elevation (like 83 ft at Barker Reservoir), so "percent of flood stage" was misleading. "Feet below flood stage" is honest for every gauge.
- Forecasts. NOAA's gauge summary only gives the next forecast point, so the app loads the full forecast series and uses its crest.
- Time formats. NWS grid data uses ISO-8601 intervals (like
2026-10-10T12:00Z/PT6H), so "rain in the next 24 hours" means prorating blocks that only partly overlap the window. - FEMA's map service. The image export came back blank, so the app queries the actual flood-zone polygon at the point and draws it.
- No keys, no proxy. Every API had to work straight from a GitHub Pages origin, so anyone can fork and host it for free.
- Plain language in two languages without losing what terms like "Special Flood Hazard Area" mean.
Accomplishments that we're proud of
- It runs on live government data right now for any address in the area, on a phone, for free.
- The Harvey replay uses the real USGS record (crest 55.19 ft around 12:15 AM CDT, Sept 1, 2017). Backtested with no look-ahead at all, the level reaches Danger at 9 PM CDT on Aug 28, 75 hours (3.1 days) before the crest. With its 48-hour outlook it would be the evening of Aug 26 (123 hours ahead), while the river itself was still under 20 ft. That outlook is hindsight, so it's labeled as such; but real forecasts were out ahead of time too. On Aug 27, 2017 the NWS forecast a record 59 ft crest at Richmond, and the county ordered evacuations that evening (Fort Bend County release).
- It never fakes certainty: missing sources, stale readings, the offline snapshot and the replay are all labeled on screen.
- Accessibility: skip link, live regions, keyboard focus, a labelled replay slider, a screen-reader summary of the chart, reduced-motion support, color contrast checked to WCAG AA, and levels shown by color and text.
What we learned
- How NOAA defines action, minor, moderate and major flood stages, and how much they differ from gauge to gauge.
- What FEMA flood zones (AE, floodway, X) mean, and that many homes that flooded in Harvey were outside the high-risk zone.
- How to design for a stressful moment: one number, one sentence, one list.
- How to write testable, framework-free JavaScript and handle unreliable network sources.
What's next for Brazos Beacon
- Push alerts when your level goes up (needs a small server for Web Push).
- Harris County Flood Control District gauges and TxDOT/DriveTexas road closures.
- Vietnamese, Chinese, Hindi and Urdu, which are widely spoken in Fort Bend.
- Showing it to Fort Bend County emergency management and our city's youth commission for feedback.
Built With
- css3
- esri
- esri-geocoding
- fema-nfhl
- github
- html5
- javascript
- jsdom
- leaflet.js
- national-weather-service-api
- noaa-nwps
- node.js
- nominatim
- openstreetmap
- pwa
- qrcode-generator
- service-worker
- svg
- usgs-water-services

Log in or sign up for Devpost to join the conversation.