Inspiration
In a wildfire, the people in the most danger are often the ones who can't ask for help: no signal, a dead phone, smoke too thick to see a road, or they're injured. Our track, Project KAZE, asked us to help people stay safe when they can no longer call, message or press SOS.
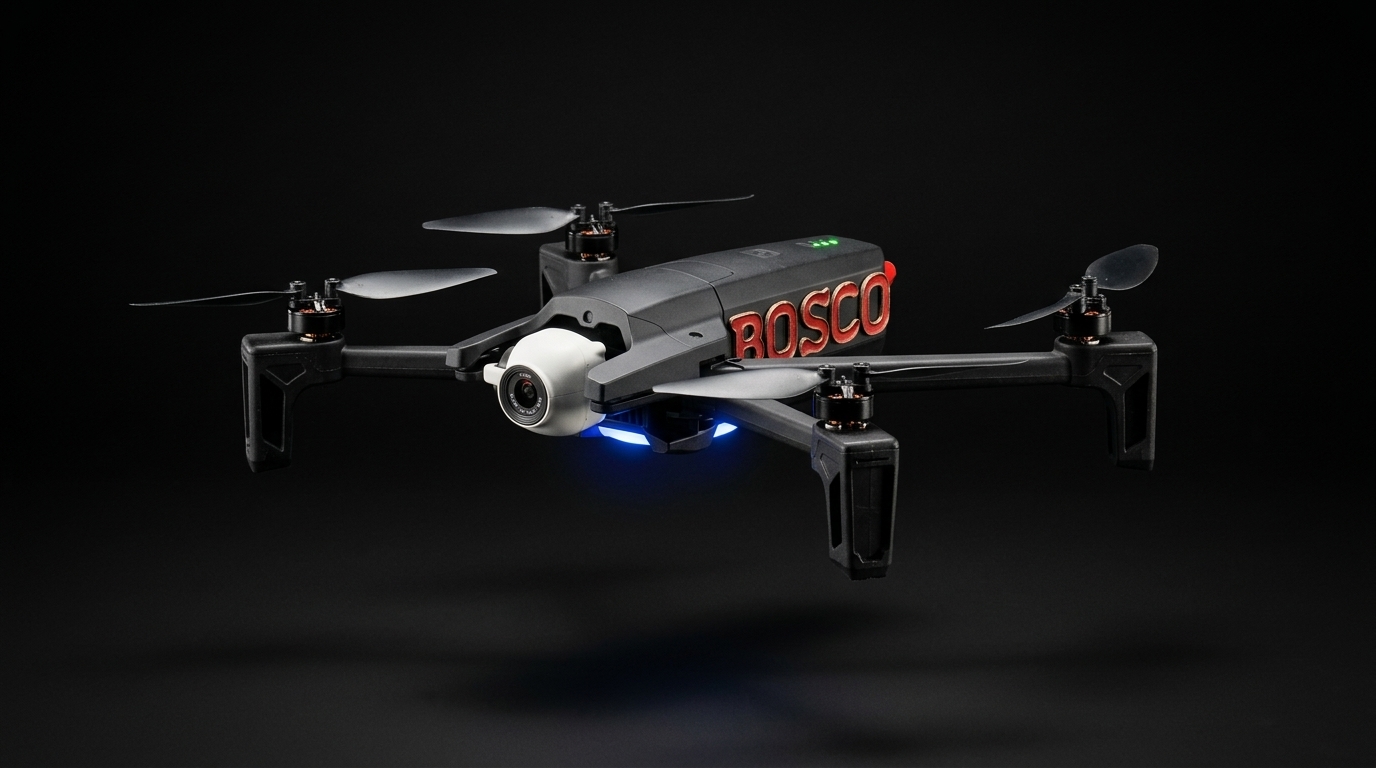
Responders already fly drones over fires, but the footage usually ends up on one person's controller screen. We wanted a drone that does the looking for them. It should watch the fire's edge, notice a person standing where the fire is heading, estimate how long they have, and put that in front of a human who can act. That became BOSCO: Bushfire Observation, Simulation and Coordination Operations.
What it does
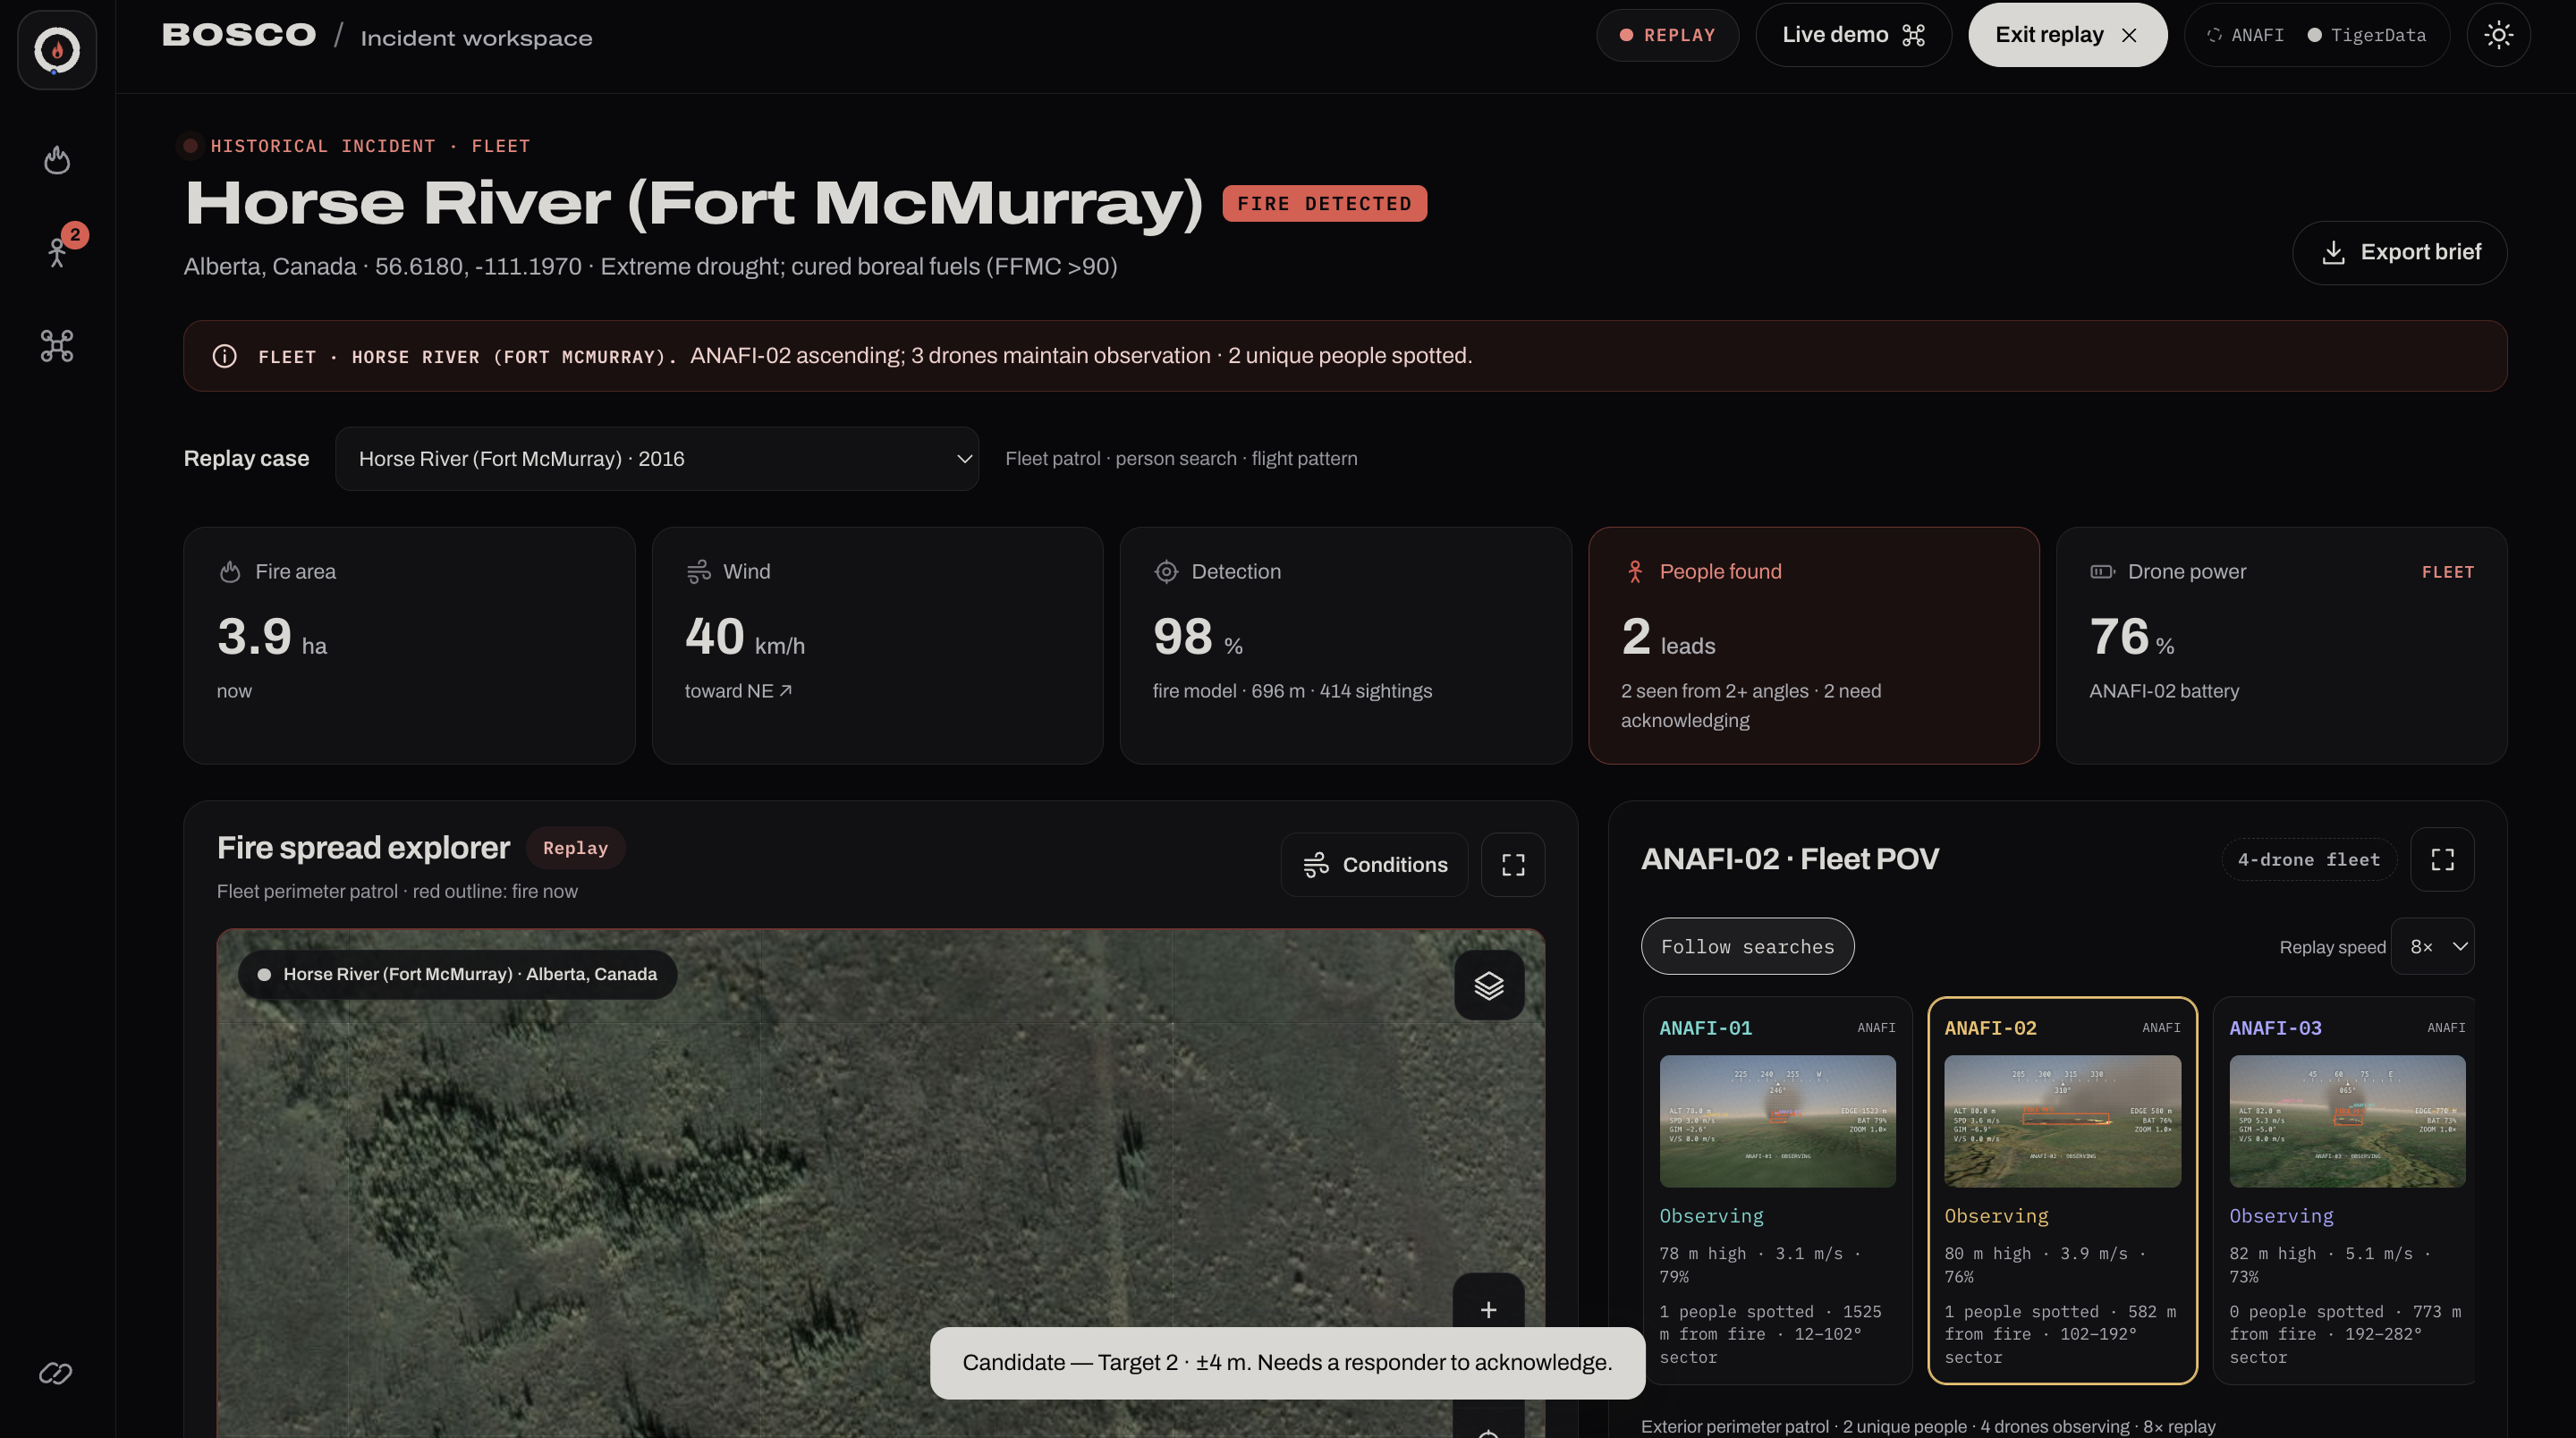
- Observes: a Parrot ANAFI streams camera frames and telemetry (altitude, speed, attitude, battery, wind estimate) to a live incident dashboard.
- Detects: a YOLO model looks for fire, smoke and people in each frame. For safe indoor demos, a printed QR marker stands in for a fire.
- Simulates: an illustrative spread model projects where the fire will be in 30 and 60 minutes, shaped by wind, humidity, temperature and fuel.
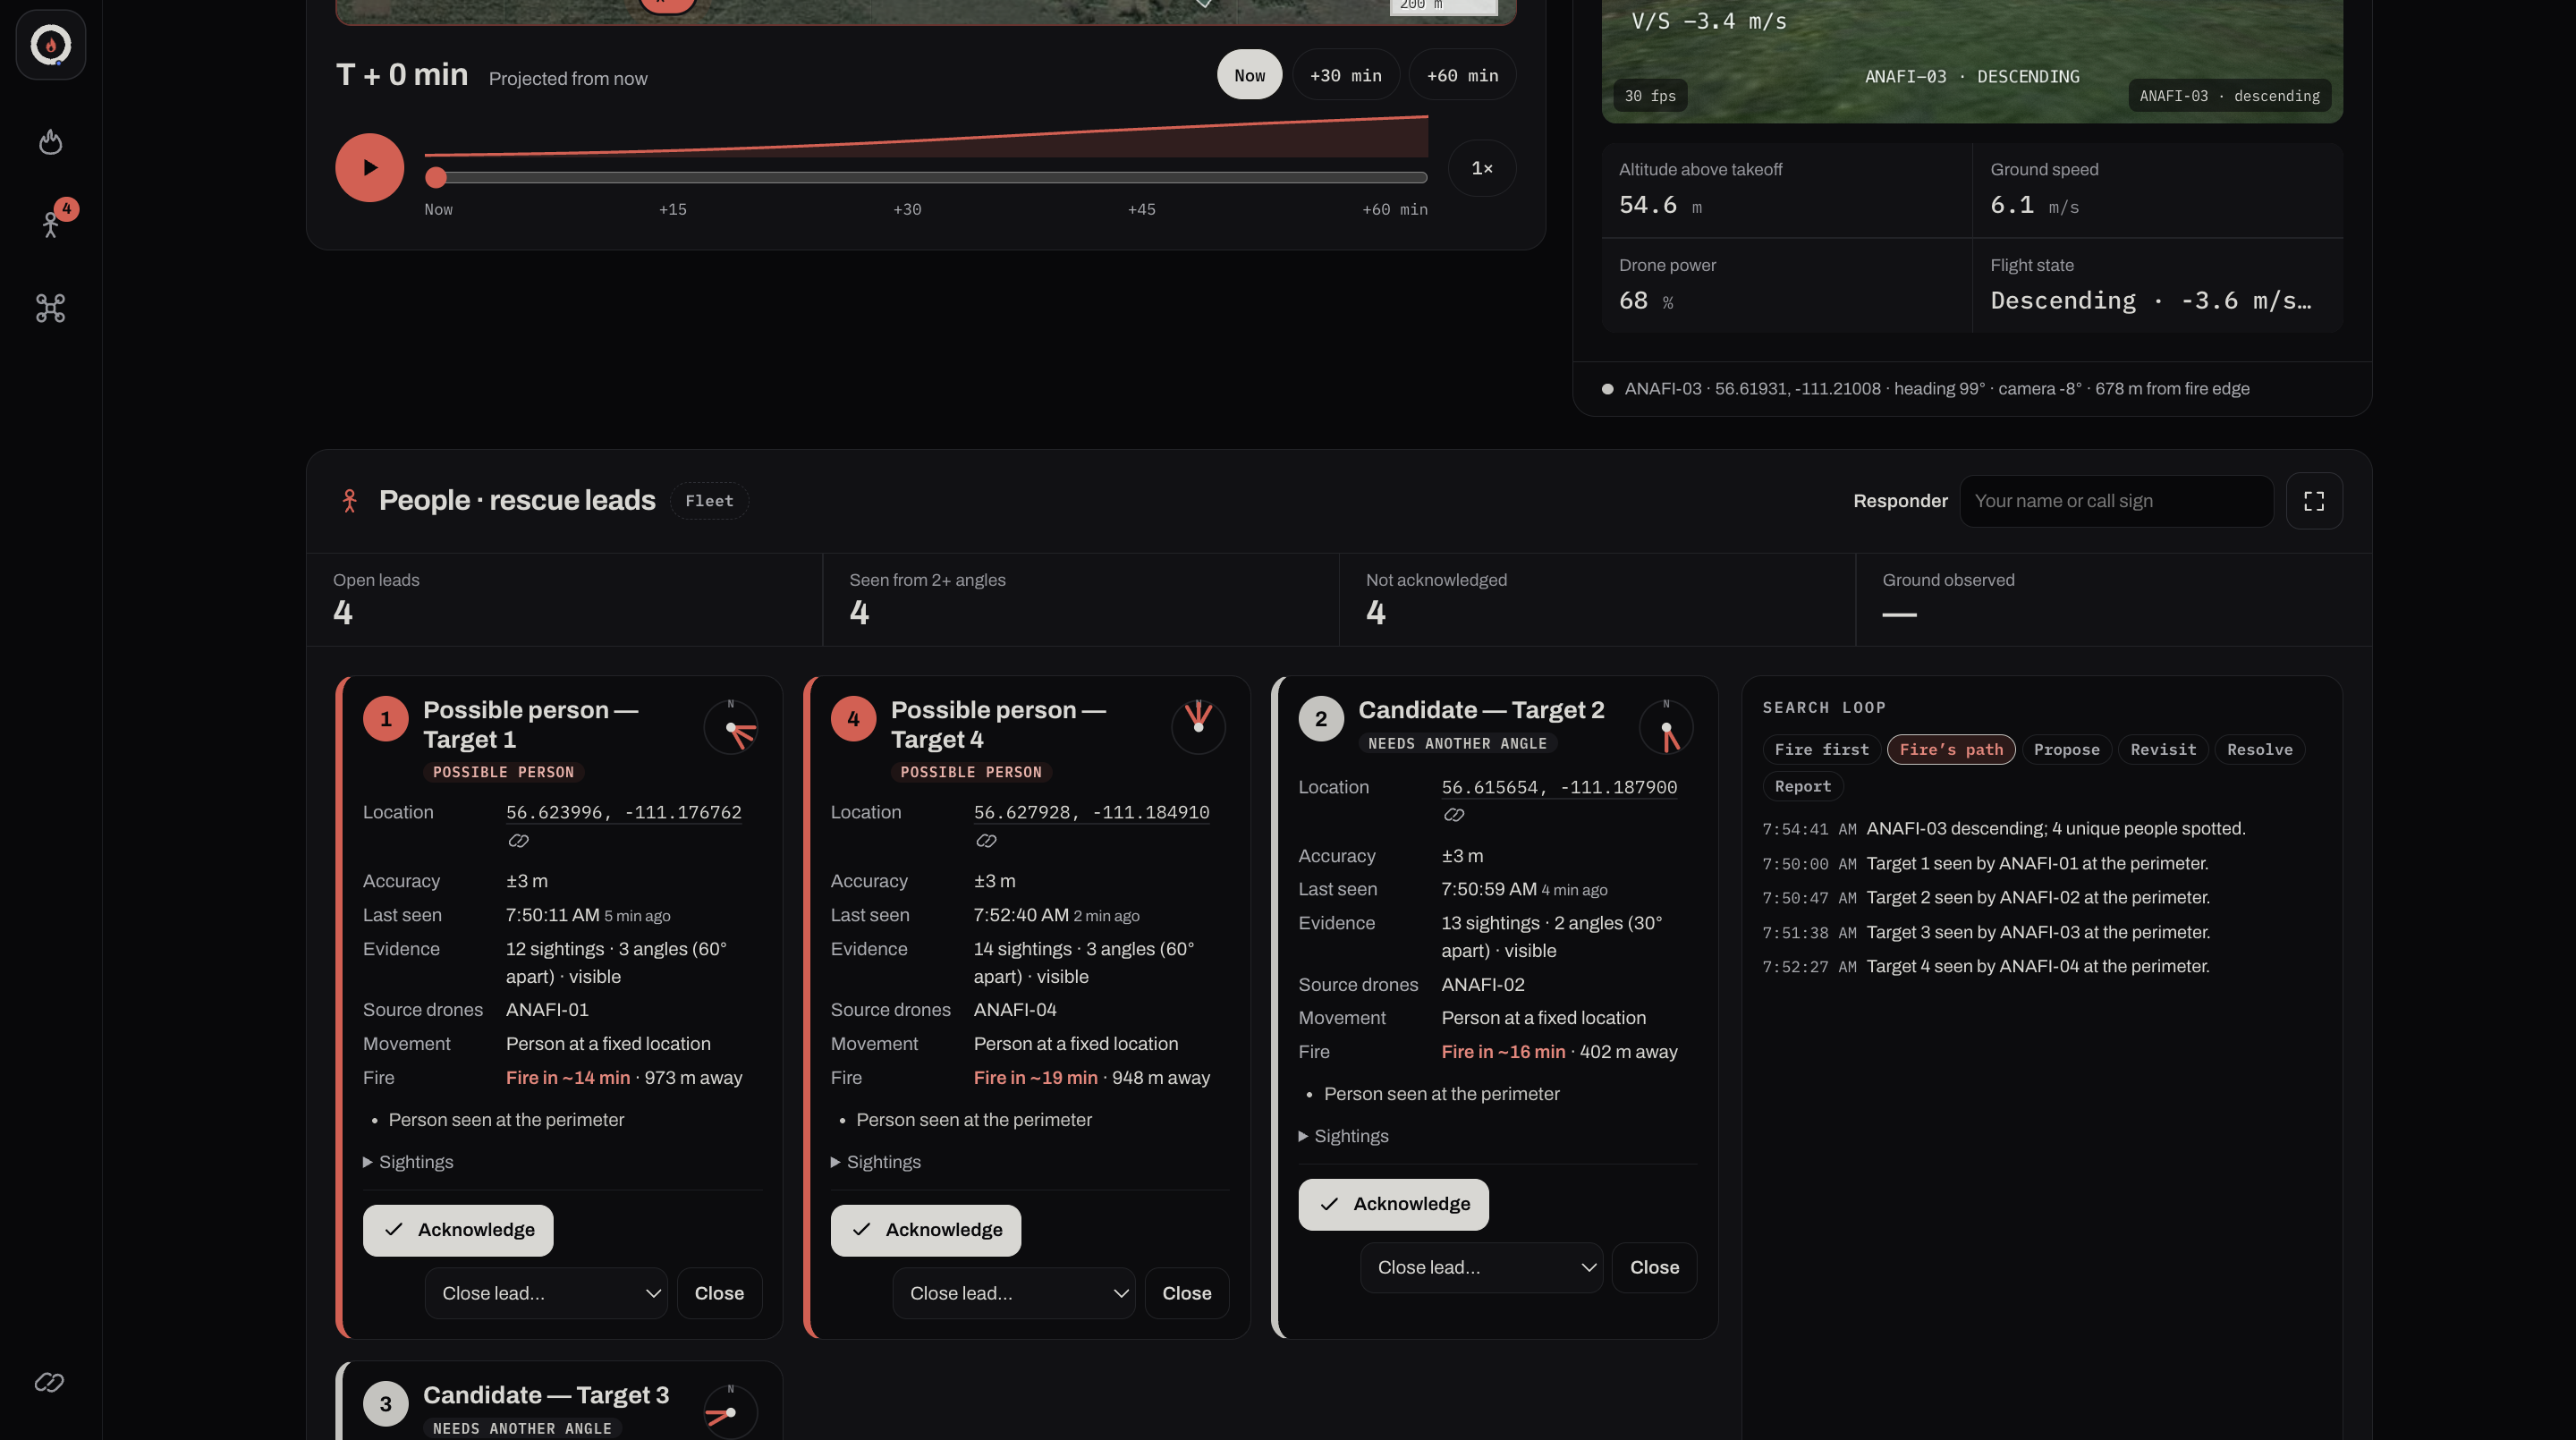
- Finds people: each person sighting becomes a rescue lead with a location error ellipse and a projected fire arrival time. A lead is never treated as a confirmed identity.
- Coordinates: a responder acknowledges or closes each lead by name, and the search log records who decided what. A person always decides. The dashboard can't fly the drone or dispatch anyone.
- Fleet replay: four simulated drones encircle a fire. They take turns descending to search its perimeter while the others keep watching, on one synchronised clock with switchable camera views.
How we built it
Hardware path. ANAFI → Raspberry Pi 4 running Parrot's Olympe SDK → SSH reverse tunnel → Node.js backend on a laptop → browser dashboard. The Pi joins the drone's Wi-Fi, and the laptop stays online for cloud services. Only one process may own the aircraft connection. Observation and flight run as separate programs, so the dashboard has no way to command the drone.
Backend. A dependency-light Node 22 server. It validates every ingest against a versioned contract, uses separate tokens for ingest and dashboard access, relays JPEG frames, and stores telemetry in TigerData (Timescale/Postgres hypertables). Rescue leads persist as local JSON.
Frontend. Plain HTML, CSS and JavaScript with no build step. Leaflet draws the map, and a scroll-driven canvas animation takes the drone apart on the home page. A token-based design system gives the dashboard dark and light themes.
The maths
Spread rate. The head of the fire advances at
$$ R = \bigl(1.5 + 0.505\,\min(v, 60)^{1.2}\bigr)\cdot E \quad \text{m/min}, $$
where $v$ is wind speed in km/h. Wind drives spread superlinearly until the fire front, not the wind, becomes the limit. $E$ is an environment factor:
$$ E = \operatorname{clip}_{[0.5,\,2.2]}!\left(1 + \frac{D-50}{120} + \frac{T-20}{90} - \frac{RH-40}{140}\right). $$
A growing fire feeds itself, so the rate is scaled by $1 + 0.35\tanh(d/300)$, where $d$ is how far the head has already travelled in metres. The footprint is an ellipse stretched downwind with a length-to-width ratio of $\min(4,\ 1 + v/35)$. We label all of this illustrative: it has the right shape, but it isn't fitted to data.
Wind from altitude. A drone at 60 m feels stronger wind than the 10 m reference height. We normalise with the Hellmann power law $v_{10} = v_h\,(h/10)^{-1/7}$, so altitude never looks like disagreement between drones.
Fleet wind consensus. Each drone's flight controller reports a wind vector $\mathbf{w}_i$. We weight each one by freshness, $\lambda_i = e^{-\Delta t_i/30\,\text{s}}$, and by flight-state confidence $c_i$:
$$ \mathbf{W} = \frac{\sum_i \lambda_i c_i \mathbf{w}_i}{\sum_i \lambda_i c_i}. $$
We then repeatedly drop outliers: more than $45^\circ$ off the mean, or more than $3\times$ the median magnitude. The set only shrinks, so this always converges. We report the circular spread $\sigma_{\text{dir}} = \sqrt{-2\ln \bar{R}}$, where $\bar{R}$ is the length of the mean unit vector, instead of hiding it.
Even spacing on the fire. Drones sit at equal arc length around the fire's elliptical perimeter, using Ramanujan's approximation
$$ C \approx \pi\left[3(a+b) - \sqrt{(3a+b)(a+3b)}\right], \qquad s_k = \frac{kC}{N}, $$
with a Newton iteration to turn each arc length $s_k$ into a position.
Where is the person? A detection is a pixel, not a GPS fix. We cast the camera ray from the drone's pose onto the ground. Then we combine the uncertainty in GPS, altitude, attitude, pixel position and terrain into a 95% error ellipse. Sightings from different angles narrow it.
Challenges we ran into
- Real hardware is slow to debug. Building Olympe on a Pi, holding a stable stream over an SSH tunnel and recovering when the drone power-cycles each took hours. We now recover a live feed after a drone restart in about 50 s without restarting the backend.
- Testing fire indoors. You can't light a fire in a lecture hall. A strict, exact-match QR marker is our "fire". It has to be seen in several consecutive frames, and every other QR code is ignored.
- Staying honest. It's easy for a demo to imply more than it does. We kept live, replay and simulated data visibly separate, labelled the spread model as illustrative, never showed made-up confidence percentages, and never called a route "safe".
- Safety boundaries. Automatic flight modes can take off once they recognise the marker. We kept them in a separate, explicitly enabled program with freshness checks and a landing step.
- Many drones, one picture. Keeping each drone's camera, telemetry and detections attached to the right identity while switching views took careful state isolation.
Accomplishments we're proud of
- Real ANAFI frames (640×360, around 8–9 FPS) and telemetry shown live in the dashboard.
- A short autonomous hover (about 1 m) with automatic landing.
- Rescue leads that show their uncertainty and require a named human to review them.
- A fleet replay where perimeter searches never pull every drone off fire watch at once.
What we learned
- Uncertainty is a feature: a responder trusts "±4 m, seen from 3 angles" more than a bare pin.
- The hardest part of drone software is the plumbing (SDKs, tunnels, reconnects), not the AI.
- A clear line between "observes" and "flies" made every other design decision simpler and safer.
- Good UI is mostly removing words. Our dashboard improved most when we cut it down.
What's next
- Live multi-drone ingest with per-drone isolation (currently replay only).
- Fitting the spread rate to measured perimeter changes, validated against historical fires.
- Thermal sensors, plus terrain and canopy-aware visibility.
- Field testing detector and location accuracy before anyone relies on them.
Built With
- css3
- google-gemini
- html5
- javascript
- leaflet.js
- node.js
- olympe
- opencv
- openstreetmap
- parrot-anafi
- python
- raspberry-pi
- tigerdata
- timescaledb
- ultralytics
- yolov8


Log in or sign up for Devpost to join the conversation.