tl;dr
At ground level, trees help reduce the temperature up to 4F, and the relative humidity by 3.5%. This can amount into a 20F difference in the perceived temperature (heat index)!
Inspiration
The qualitative effect of trees on improving pedestrian comfort is well known and intuitive; a quantitative assessment of the direct benefits of trees on reducing high temperatures and high humidity in their immediate vicinity would provide a valuable tool for reducing the urban heat island effect.
What we did
NYC weather station measurements scraped from Weather Underground constitute a data set of mean high temperature and mean peak humidity values at several elevations for August 2015.
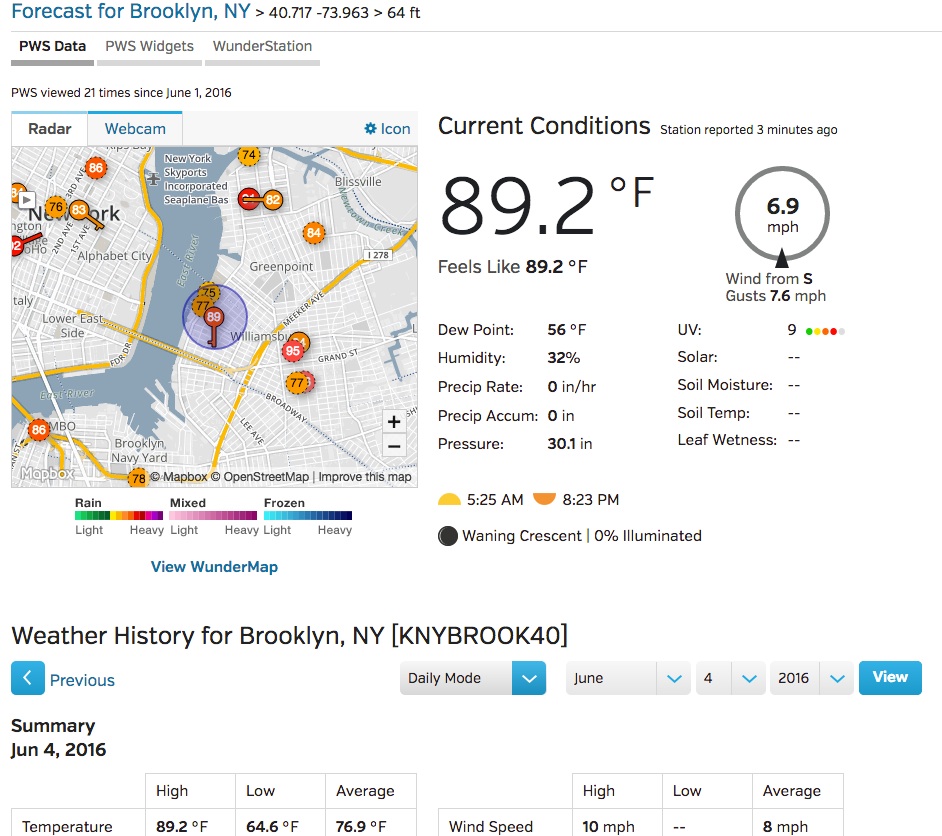
An example of a Weather Station page from Weather Underground
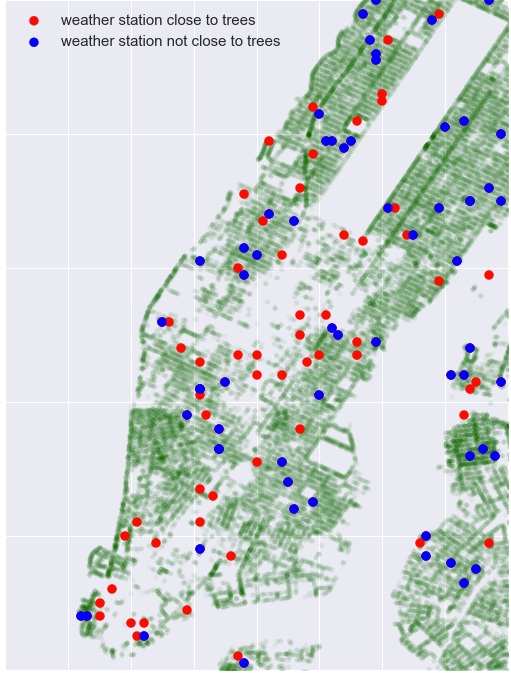
Weather Stations and the tree census (zoom in lower Manhattan). Stations in the proximity of trees are coded in blue, stations away from trees are coded in red
Elevation data are corrected with topographic data to yield comparable measurement heights above street level, providing information about temperature and humidity at several points above and below the tree canopy. Combining this weather data with the TreesCount2015 street tree data set provides a means to parse temperature and humidity data at various heights in the presence or absence of trees, as defined by distance of weather stations from street trees. The initial results suggest a statistically significant reduction of temperature and humidity in the proximity of street trees, especially below the tree canopy.
How we built it
Starting with an initial idea Mattia was testing, the team contributed spatial analysis (Jordan & Bob), data wrangling (Nick), python programming and scraping (Mattia), data analysis (Mattia & Joe), presentation (Nick), project management (Joe & all).
Challenges we ran into
The limited number of weather stations limits the flexibility of the analysis, as the stations are located across many different neighborhoods, and may be subject to quite different immediate local conditions concerning street orientation, prevailing wind conditions or proximity to the coastline. These differences could potentially affect excessive temperature and humidity.
We take these confounders into account with a statistical approach, by comparing stations in the presence/absence of trees at different heights from the street level. Intuitively, the impact of trees should be the strongest at street level, with diminishing impact above the canopies.
What we learned
The next plots show the distribution of high temperatures in August 2015 for stations in the proximity (<5m) of trees (blue histogram) and in absence of trees (red histogram) - Note: colors in the legend in the upper left corner are inverted (to be fixed!)
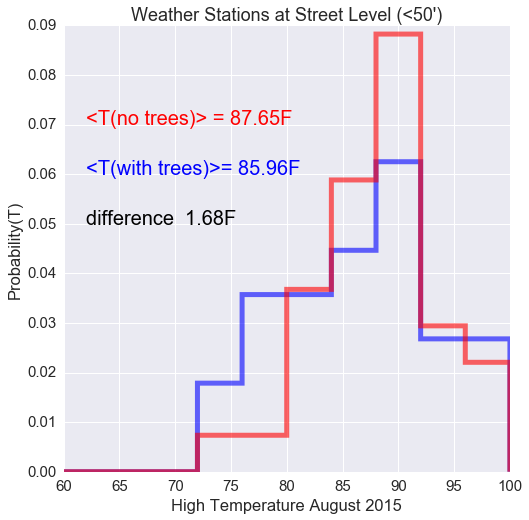
We can notice that the mean temperature of stations in the presence of trees is approximately 1.7 deg F lower than stations with an absence of trees, for measurements taken below 50 feet in elevation.
In order to take into account the fact that stations may be subject to quite different immediate local conditions, we repeat the analysis dividing the stations in different elevation ranges, expecting that the impact of trees is the highest for stations located closest to street level.
The next plots show the difference in temperature and humidity between stations without trees and stations with trees in their proximity, at different elevations from the street. As expected, the difference is the greatest closer to the street level, and tends to disappear for stations located above canopies.
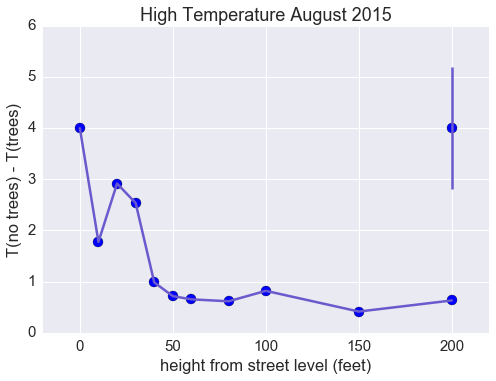
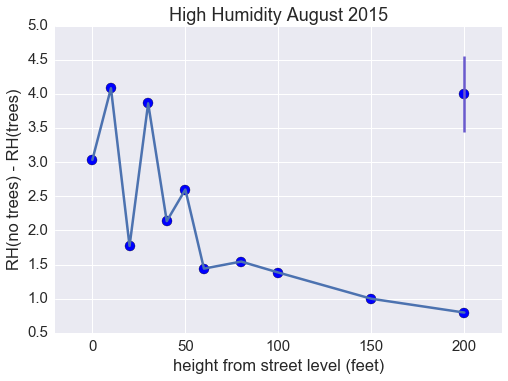
TAKE HOME MESSAGE: At ground level, trees help reduce the temperature up to 4F, and the relative humidity by 3.5%. This can amount to a 20F difference in the heat index!
Accomplishments that we're proud of
We quantified a human sensation/perception and dealt with limited data by benchmarking the observations with a sample in which we expected and found no effect.
What's next for Impact of Trees on Localized Weather
To improve the analysis (at the moment based only on the available weather stations from Weather Underground) we would like to compare temperature/humidity in comparable blocks, take into account other possible confounders (height of buildings, distance from water, street orientation....), by implementing more temperature measurements.
If we had more time, we would have also divided trees in species to compute their impact and checked for the health of the trees.
In the current analysis we did not study the seasonality effect, but only looked at the warmest month of the year.


Log in or sign up for Devpost to join the conversation.