-
-
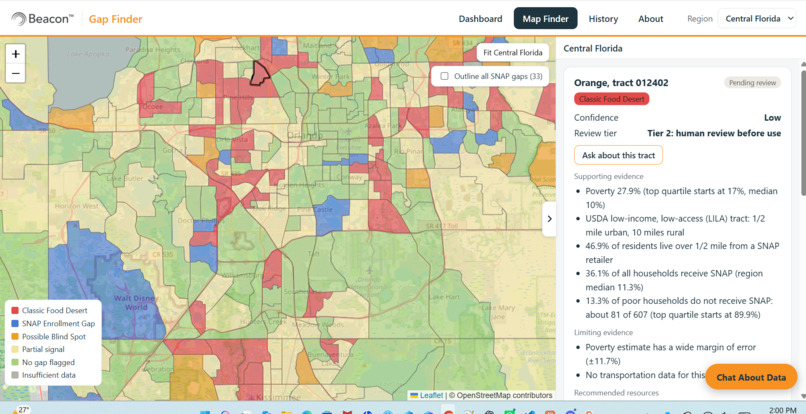
Map and Recommendation
-
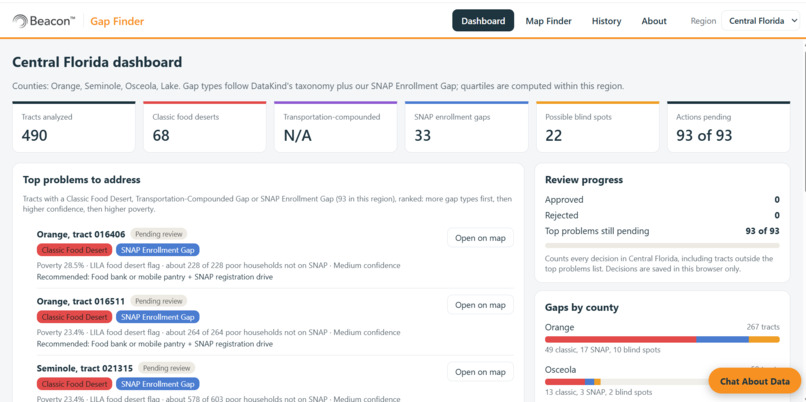
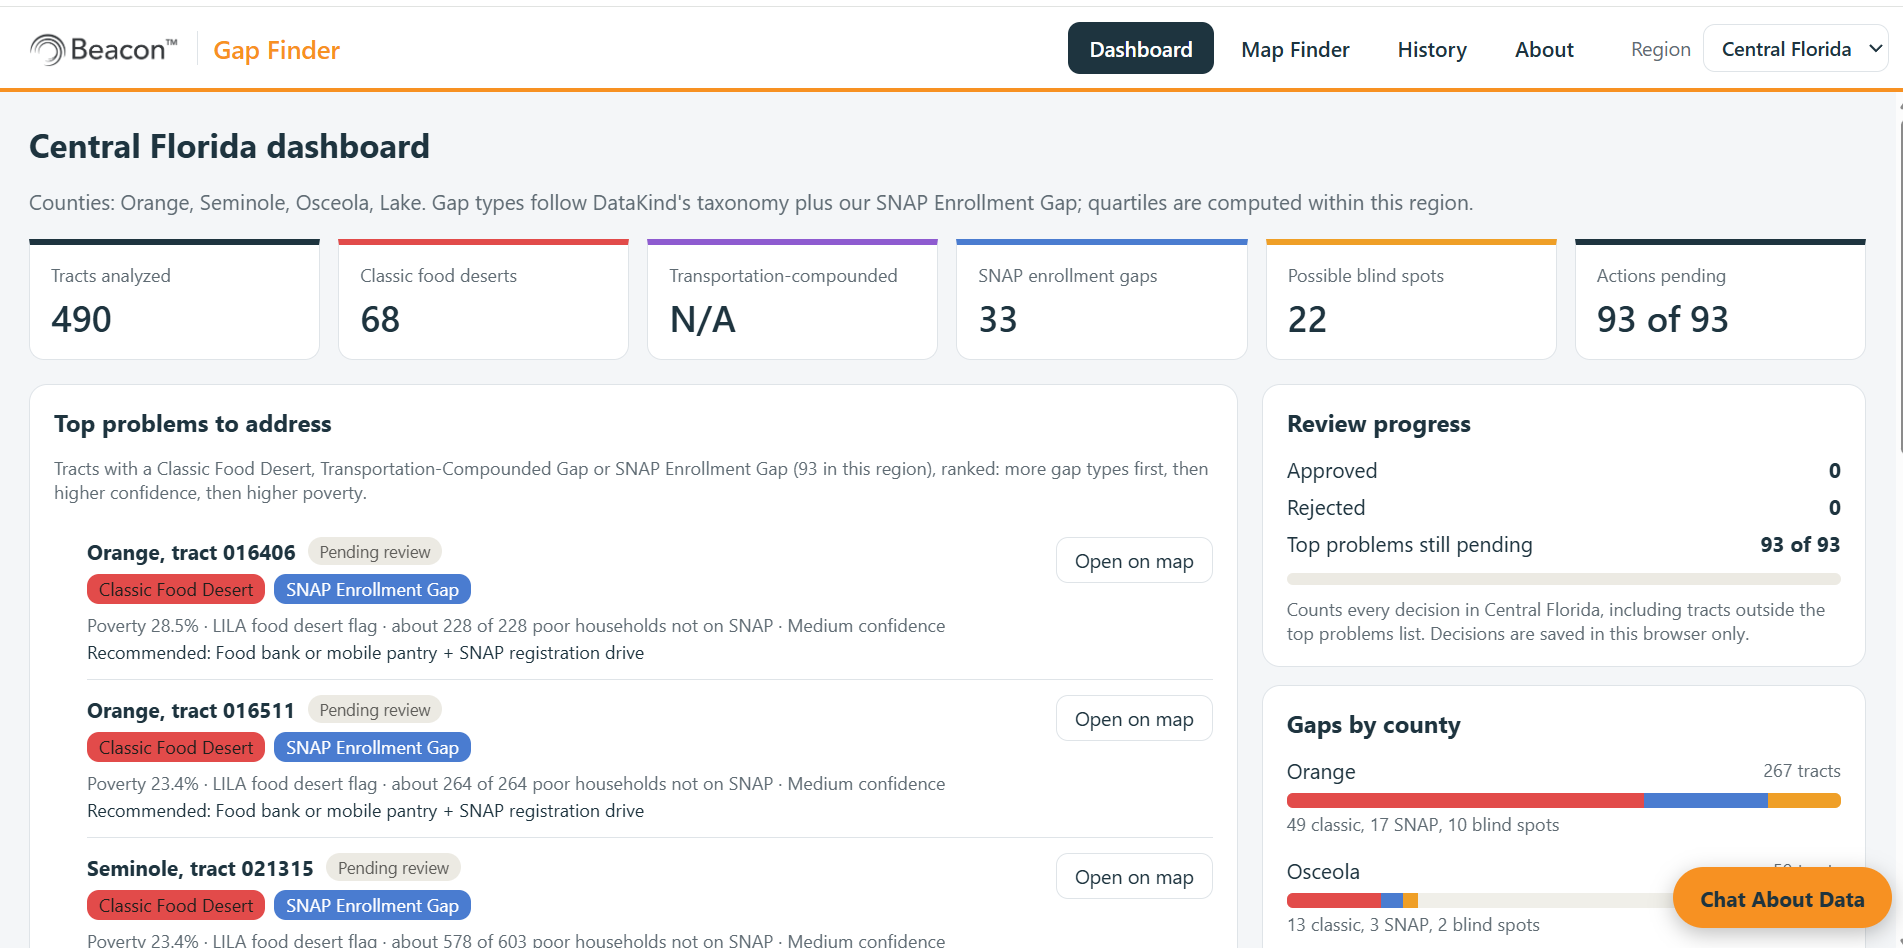
DashBoard
-
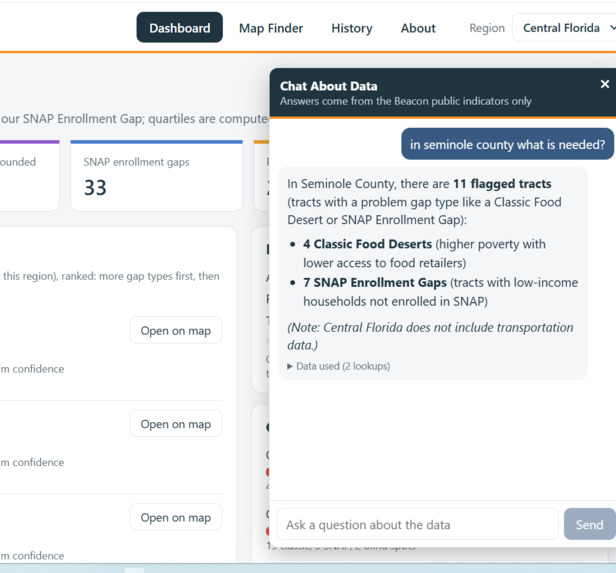
ChatBot to ask and get information
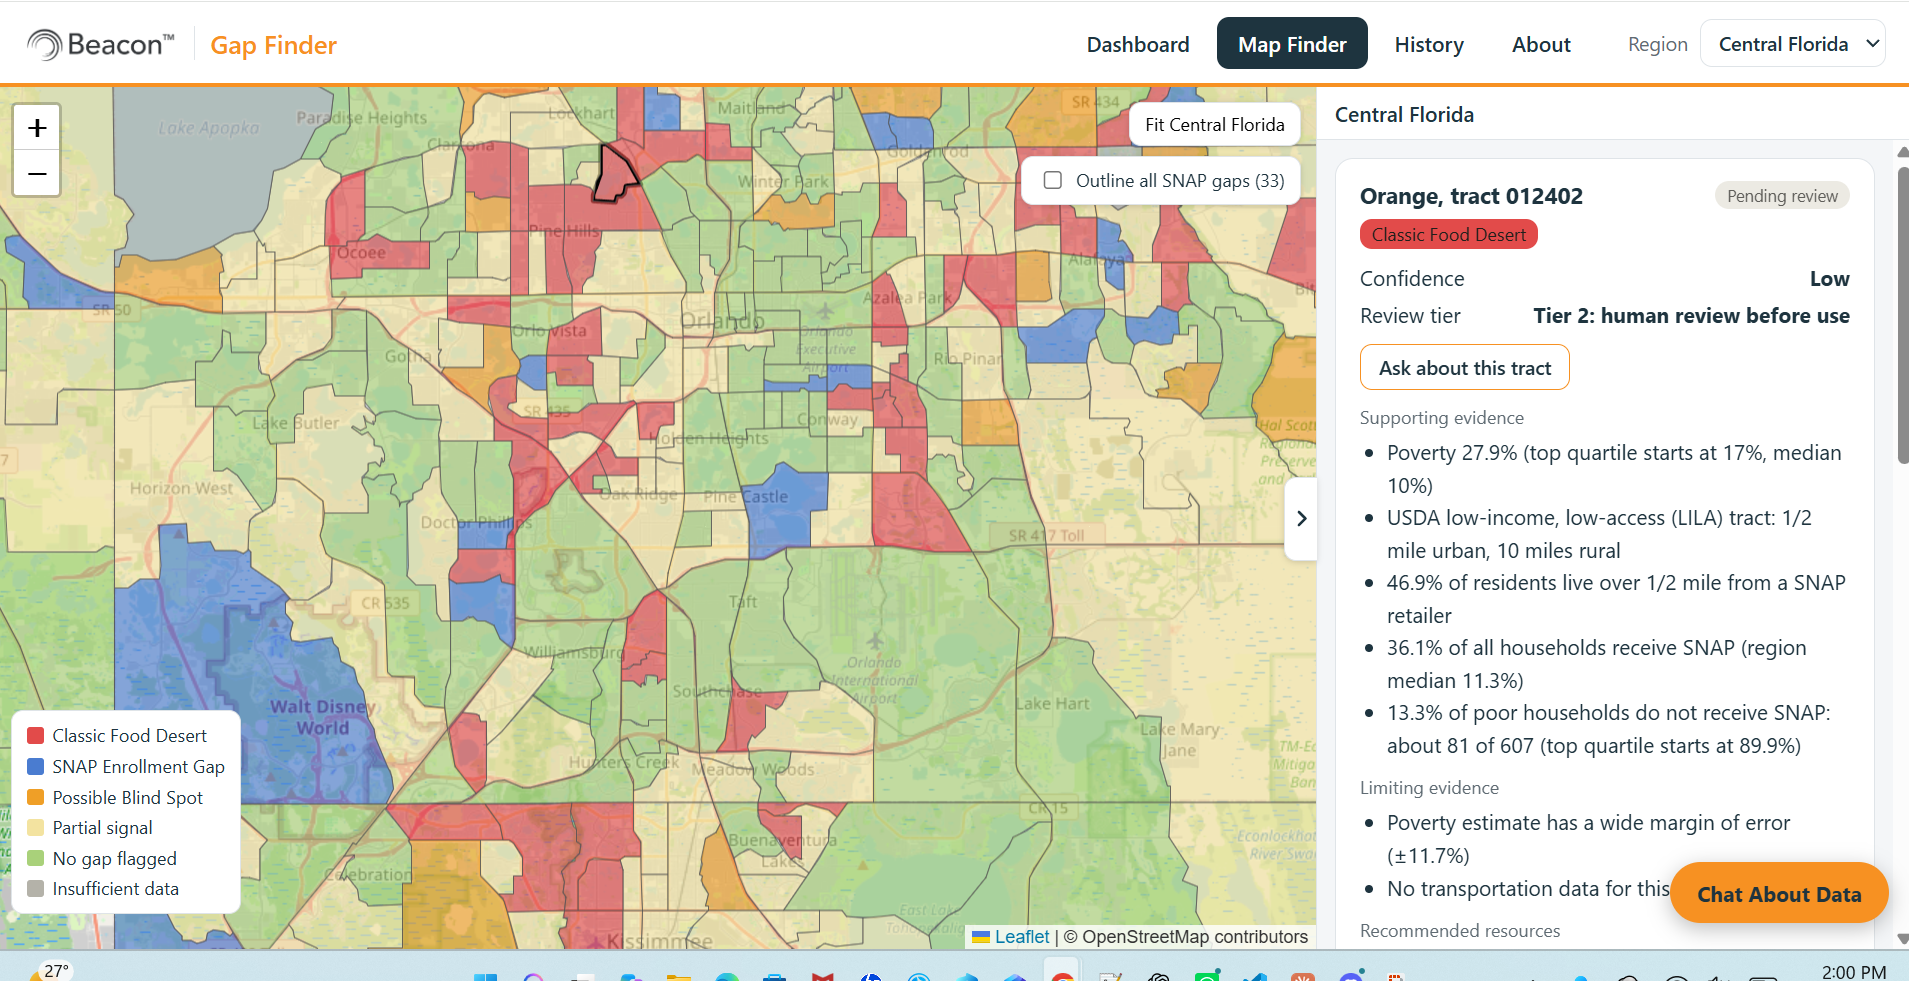
Inspiration
Food banks and pantries know their communities, but the public data that shows where need is greatest is scattered across separate Census and USDA files. Combining it takes an analyst most food organizations don't have, so help often goes where it always has. We took on DataKind's Beacon Challenge 2: from insight to coordinated community action.
What it does
Beacon Gap Finder turns Beacon's public data into a map a food bank team can act on.
- Dashboard: the top neighbourhoods to address, ranked, with a live count of decisions still pending.
- Map: every Census tract coloured by gap type. Click one to see why it was flagged, how sure the data is, and the recommended action.
- People decide: the team approves or rejects each flagged area with a reason, and can undo. The app never decides on its own.
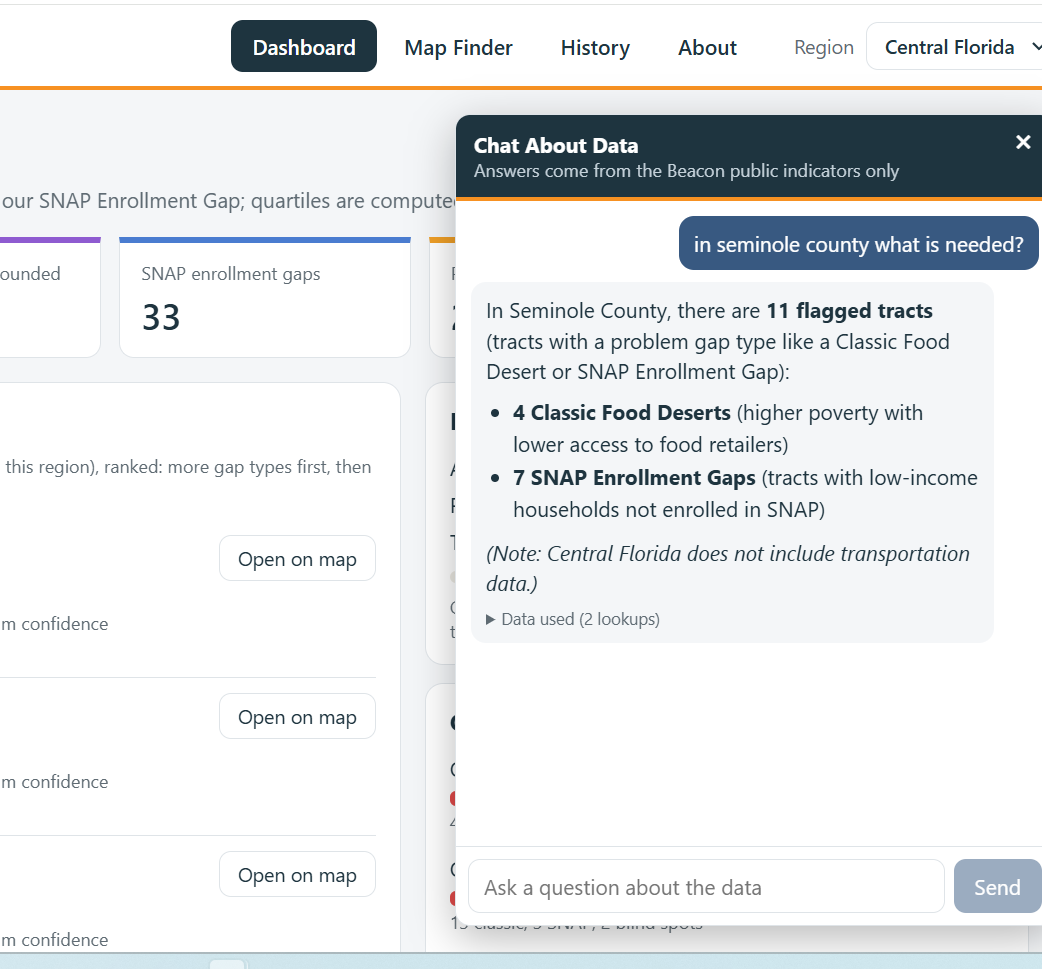
- Chat About Data: ask questions about the data in plain English.
It covers Central Florida, New York City and Salt Lake City: 3,085 tracts, 232 flagged, home to 1,083,015 people.
Chat About Data (our chatbot)
Not everyone on a food bank team reads maps or statistics, so we added a chatbot that answers questions about the data in plain English, for example:
- "Which 5 neighbourhoods have the most poor households not on SNAP?"
- "How many people live in Classic Food Desert tracts, by county?"
- "Why is this tract flagged, and how sure is the data?"
How it stays trustworthy:
- The AI never sees the raw files and never does arithmetic. It only picks a data lookup; our code runs it with the same rules as the map and computes every number.
- Any number in an answer that can't be matched to the data gets a warning.
- If the data can't answer (for example, store closures), it says so instead of guessing.
- Tract names in answers are links that open the tract on the map, and an "Ask about this tract" button starts a conversation about any neighbourhood.
- The team's decisions and notes are never sent to the AI.
It runs on Google's free Gemini model.
How we built it
- Data pipeline in Python joins Census ACS 2024 (poverty, SNAP, population), the USDA Food Access Research Atlas and CDC PLACES to Census tract boundaries.
- Web app in React, Vite and Leaflet with OpenStreetMap.
- Transparent rules: Classic Food Desert (top-quartile poverty plus the USDA low-income, low-access flag), Transportation-Compounded Gap, and our own SNAP Enrollment Gap. Each has a confidence level based on margins of error and population size.
- Chatbot: a small Node server calls Google's free Gemini model with function calling. The AI only picks a data lookup; our code runs it and computes every number. Automated tests check the data lookups against direct calculations.
Challenges we ran into
- Central Florida has no transportation data (the CDC column is empty), so we show that gap type as "not available" instead of guessing.
- Some SNAP numbers look extreme (100% of poor households not on SNAP), which can mean student housing or a small Census sample, so we added a separate confidence check.
- An early chatbot answer said 4 where the data said 18. We fixed it by moving every count and average into code and checking answers automatically.
Accomplishments that we're proud of
- Every flag explains itself, with its evidence and how sure we are.
- A chatbot that answers in plain English without making up numbers.
- A finding: 143 of 152 SNAP gaps are not food deserts, so a food-desert-only map would miss them. There, the answer is enrollment help, not a new pantry.
What we learned
Data gaps should be stated openly, odd numbers need local eyes, and an AI should never do the counting.
What's next for Beacon Gap Finder
- Dynamic data flow: refresh automatically when new Census or USDA numbers come out.
- Connect to food bank providers: send flagged neighbourhoods straight to local food banks and pantries.
- More regions: USDA and CDC data already cover the whole US.
Built With
- atlas
- cdc-places
- census-acs
- google-gemini
- javascript
- leaflet.js
- node.js
- openstreetmap
- python
- react
- usda-food-access-research
- vite

