Inspiration
We live in Lisbon. Between 2015 and 2019, rents and prices doubled in neighbourhoods like Mouraria and Arroios — and almost everyone we know who could have bought early didn't, because nothing told them it was coming. Families got priced out of streets they'd lived on for decades. Investors kept buying where prices had already peaked. Journalists wrote the story in 2020, after the wave had crashed.
But the signals were there. Reddit threads about "cheap European cities." Airbnb listings multiplying on the same three blocks. Google searches for "Lisbon apartments" climbing quarter after quarter. News articles in German and Dutch tourism sections. The information existed. It just wasn't connected.
Avalia is our attempt to connect it. The thesis is simple: attention precedes capital. Before a neighbourhood gentrifies, people search for it, post about it, list Airbnbs in it, and write articles about it — usually 12 to 24 months before the price index moves. If we can fuse those leading indicators at scale, we can predict where prices will go next — and give investors, developers, and eventually cities themselves a warning system that today simply does not exist.
What it does (target state)
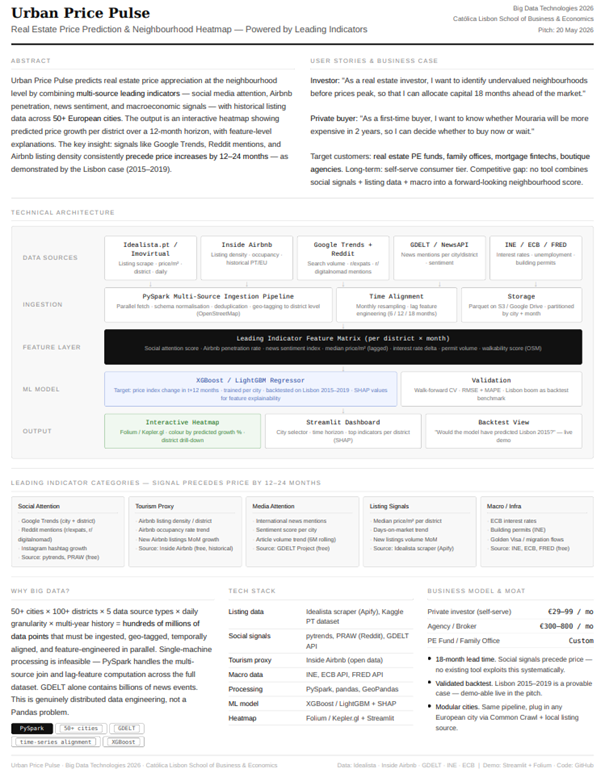
Avalia predicts real estate price appreciation per neighbourhood over a 12-month horizon and visualises it as an interactive heatmap. The intended user flow is: pick a city, drill into a district, and see:
- The predicted price growth (%) at t+12 months
- The top 3 leading indicators driving the prediction (via SHAP)
- A backtest view answering: "Would this model have predicted Lisbon 2015?"
Who it's for
Primary customers are institutional real estate investors — funds, family offices, REITs, and developers — who today make neighbourhood-level bets using broker hunches and lagging transaction data. A secondary consumer tier serves individual buyers and expats trying to get ahead of the next wave. In the long run, cities and housing agencies are a natural fit: the same signals that flag investment opportunities also flag displacement risk.
Where we are right now
We're mid-build on the MVP. The architecture and thesis are locked; the implementation is in progress, and several components are still moving:
- Data sources are not final. The current shortlist is Idealista (via Apify), Inside Airbnb, Google Trends, Reddit, GDELT, and INE/ECB/FRED — but we're still validating which sources actually deliver clean, district-level signal at acceptable cost. Idealista's anti-scraping in particular may push us toward Imovirtual or a Kaggle-based historical fallback for the demo.
- Scope for the pitch is Lisbon-first. Long-term we want 50+ European cities; for the hackathon we're targeting Lisbon as a working demo, with the architecture proven to scale. Porto and the rest of Iberia come next, in the first expansion phase.
- The model is being trained iteratively. Walk-forward validation on the Lisbon 2015–2019 boom is our key proof point, and we'll only make claims about lead time once the backtest results are in.
How we're building it
Five categories of leading indicators feed the pipeline:
- Listing data — Idealista.pt scraped via Apify (price/m², district, daily)
- Tourism proxy — Inside Airbnb (listing density, occupancy, historical)
- Social attention — Google Trends (pytrends) + Reddit (PRAW) on r/expats, r/digitalnomad
- Media attention — GDELT Project (international news mentions + sentiment)
- Macro signals — INE Portugal, ECB, FRED (interest rates, permits, unemployment)
Ingestion runs through a PySpark pipeline that fetches in parallel, normalises schemas, geo-tags everything to district level using OpenStreetMap, and produces a unified feature matrix per district × month with 6/12/18-month lags.
The model is an XGBoost regressor trained per city, with the target being the price index change at t+12 months. Validation uses walk-forward cross-validation. SHAP gives us per-district feature explanations — which is what turns a black-box number into something an investment committee can actually defend.
The frontend is a Streamlit dashboard with a Folium heatmap, city selector, time-horizon slider, and district drill-down.
Why this is possible now
Three things had to be true for this to work, and only recently are all three:
- Alt data is open. Google Trends, Reddit, GDELT, and Inside Airbnb are all publicly accessible. Five years ago, half of this pipeline would have required enterprise deals.
- Compute is cheap enough to run a multi-source PySpark pipeline on district-month granularity for a whole continent.
- The gentrification question is now a political one. From Lisbon to Barcelona to Berlin, housing crises have made "where is the next Mouraria" a question regulators, investors, and residents all want answered.
Challenges we've run into so far
- Geo-tagging at scale. Mapping Reddit posts, news articles, and Airbnb listings to consistent district polygons is harder than it sounds — district names overlap, boundaries change, and OSM tags are inconsistent. We're standardising to OSM
admin_level=8. - Time alignment. Daily listing data, monthly macro indicators, and event-stream news (GDELT) need a common monthly grid without leaking future information into lag features.
- Backtest discipline. A random split would let the model "see" 2018 prices when predicting 2017. Walk-forward CV is mandatory and easy to get subtly wrong.
- Source reliability. Idealista's anti-scraping is the main open risk; we have Apify and a Kaggle historical dataset as fallbacks.
What we've learned so far
- PySpark is overkill for one city, essential for fifty. The architecture decision pays off the moment we add the second city.
- SHAP is what makes the model trustable. A black-box prediction tells an investor nothing; a feature-level explanation tells them a story they can act on.
- Scoping honestly matters more than scoping ambitiously. A working single-city demo with a clean backtest beats a half-built 50-city prototype.
What's next
- Finalise the data source mix and lock the ingestion pipeline
- Complete the Lisbon 2015–2019 backtest and report honest lead-time numbers
- Ship the Streamlit demo for Lisbon
- Post-hackathon: expand to Spain and the rest of the EU, add prediction confidence intervals, and explore a self-serve consumer tier alongside the B2B offering
Built With
- apify
- ecb-api
- folium
- fred-api
- gdelt
- geopandas
- github
- ine-api
- kepler.gl
- lightgbm
- openstreetmap
- pandas
- parquet
- praw
- pyspark
- python
- pytrends
- scikit-learn
- shap
- streamlit
- xgboost

Log in or sign up for Devpost to join the conversation.