Inspiration
We were learning about data visualization in our college courses and wanted to build something interactive with it. As our team brainstormed, one teammate mentioned how difficult it can be to choose a location for a business. That was when the idea clicked: could we use a map to help someone see the competition around a place before they decide to open there?
What it does
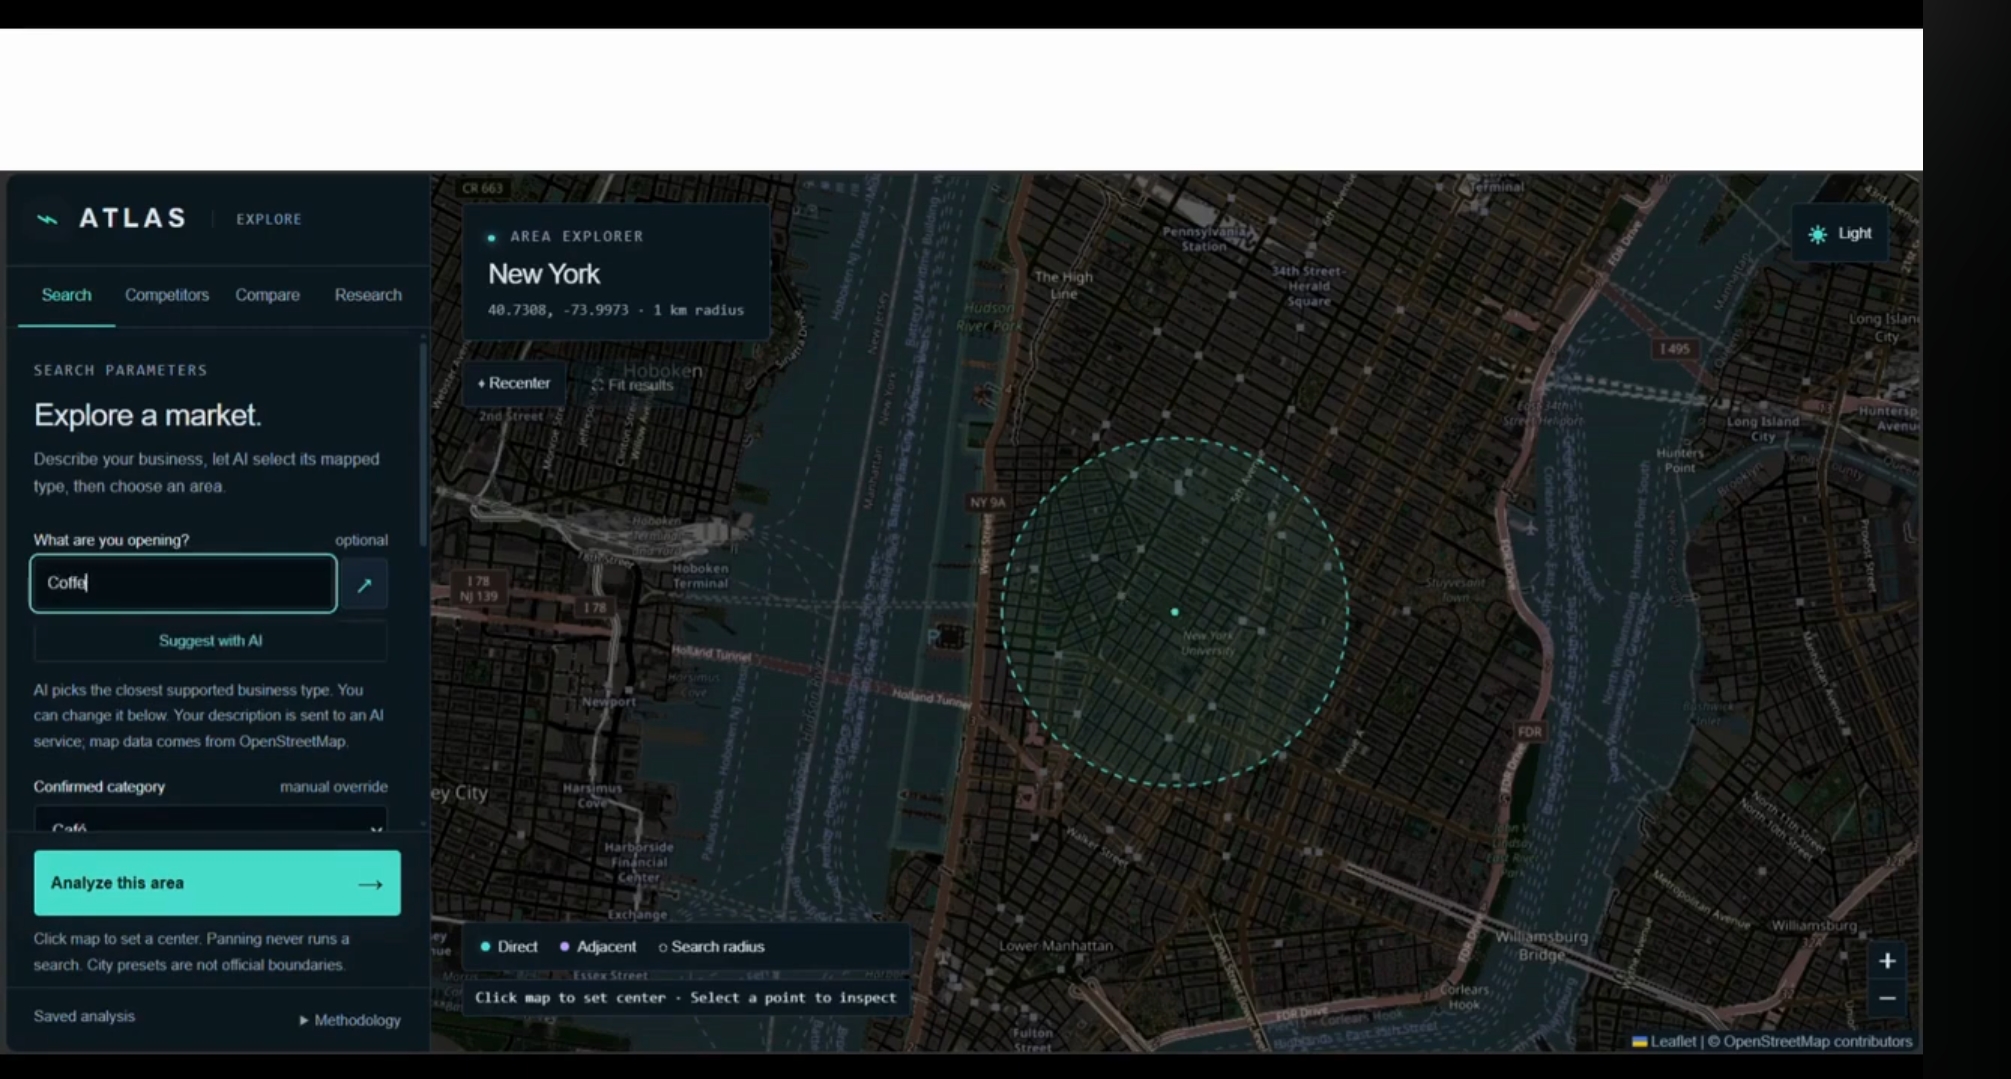
ATLAS starts by asking, “What are you opening?” It suggests a business category from the user’s description, but users can select one manually if their idea does not fit neatly into a single category.
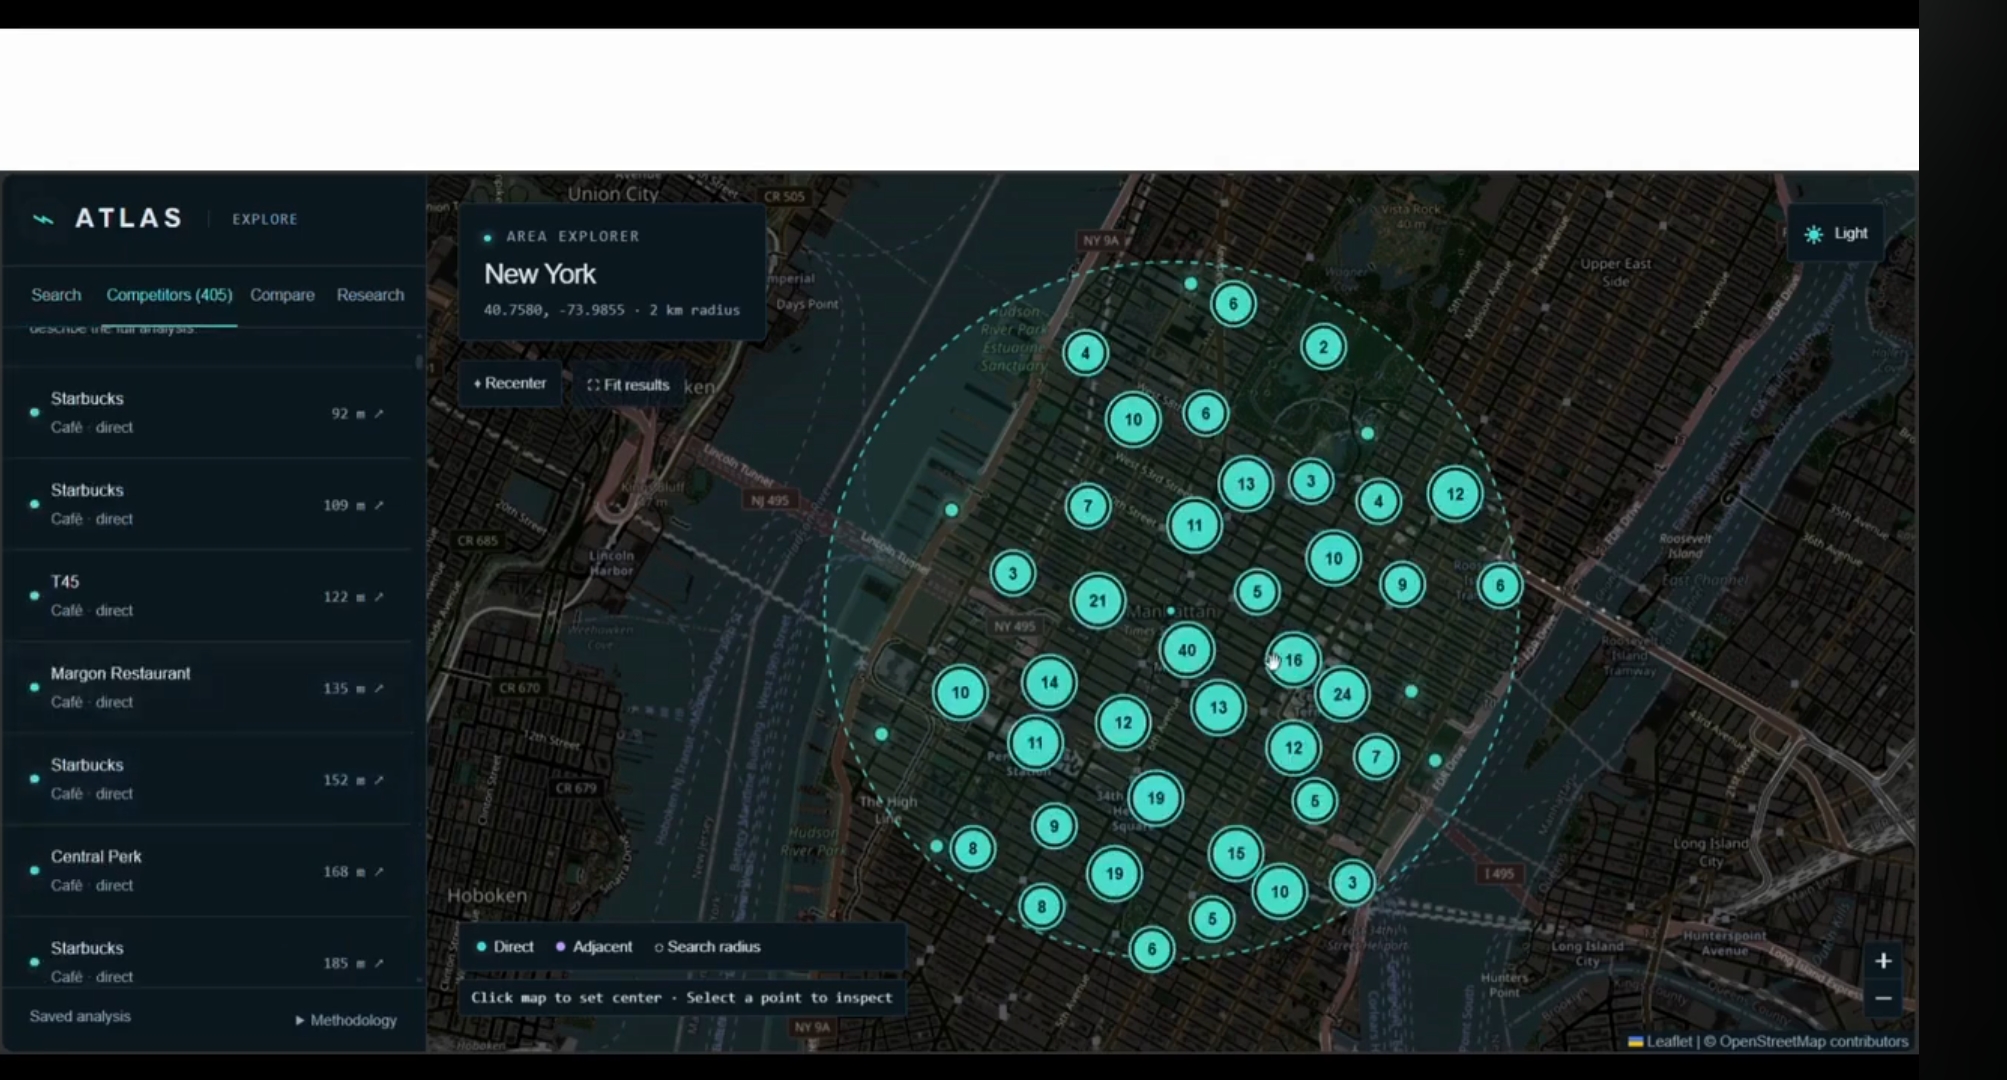
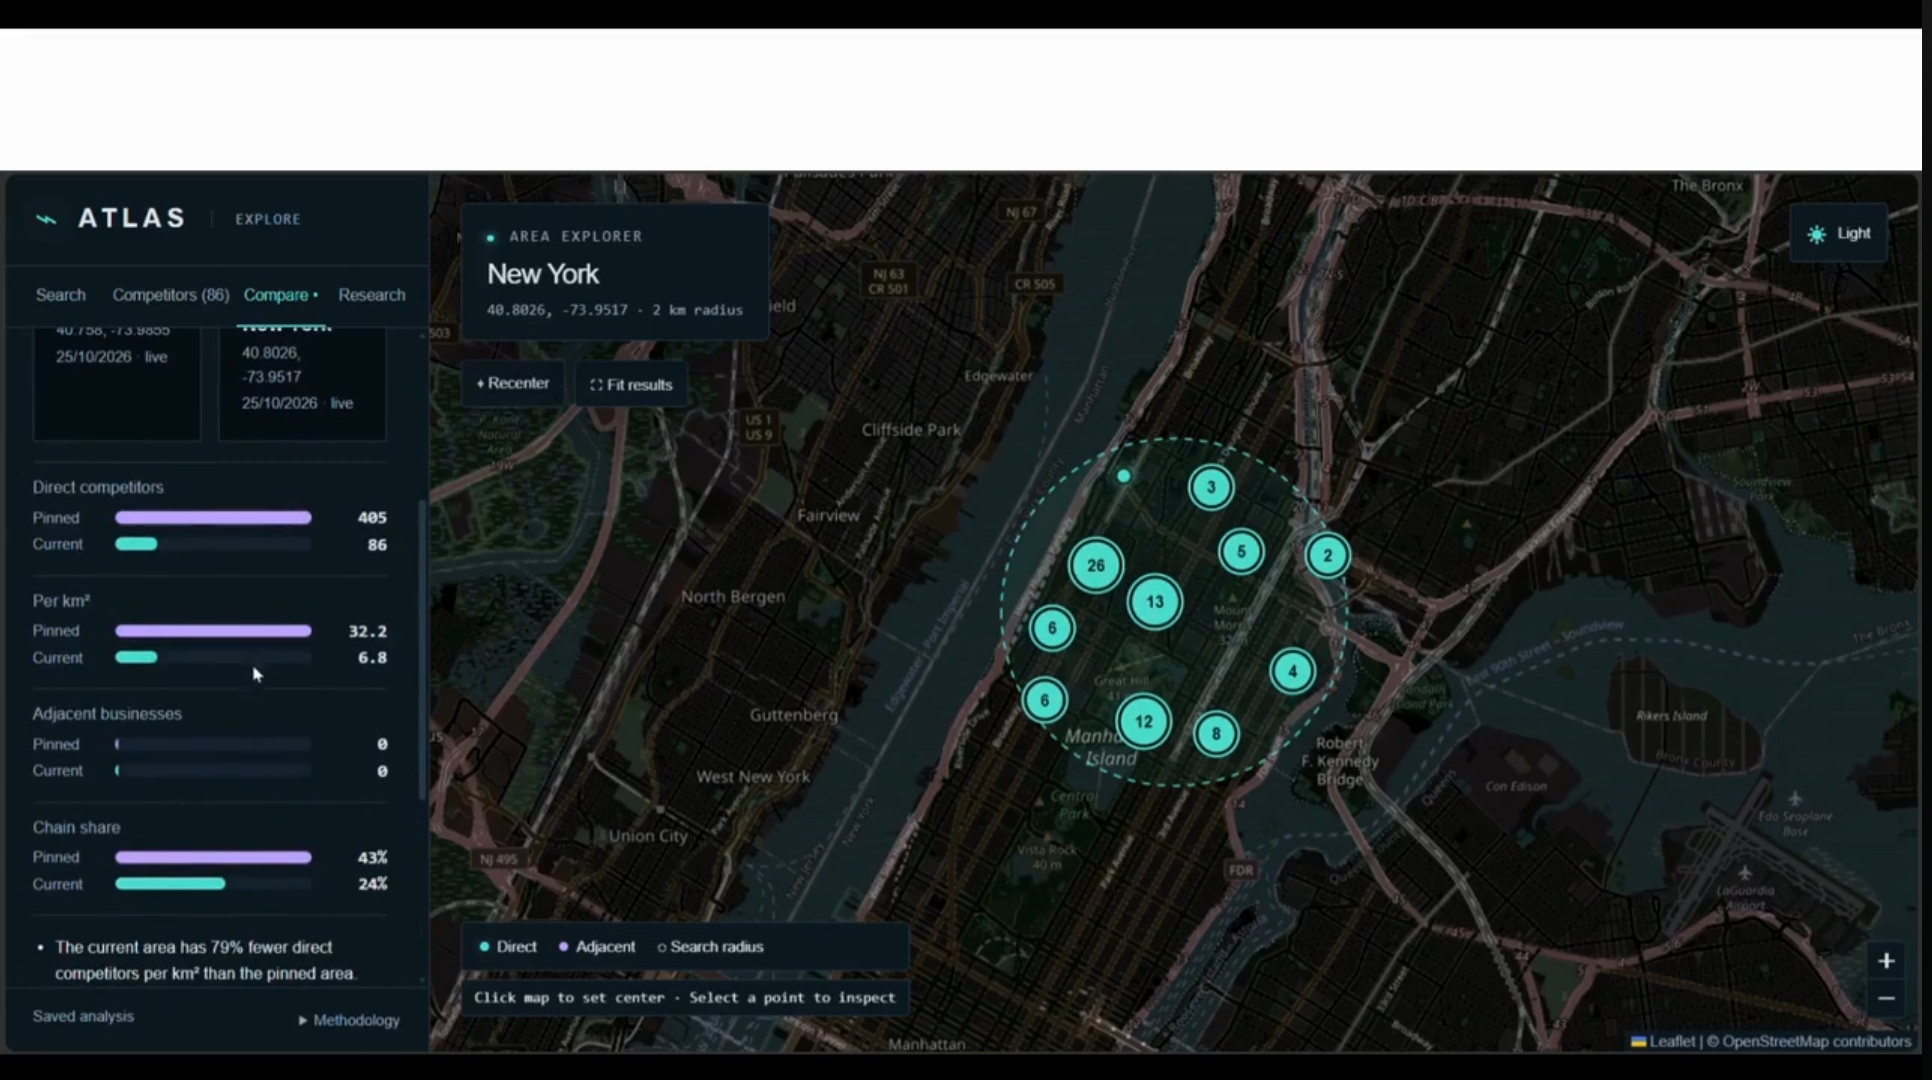
Users choose a location and a search radius of up to 2 km. ATLAS maps nearby businesses recorded in OpenStreetMap. Clicking a business opens a card with its distance, available details, and source information. Users can also pin one area and compare it with another.
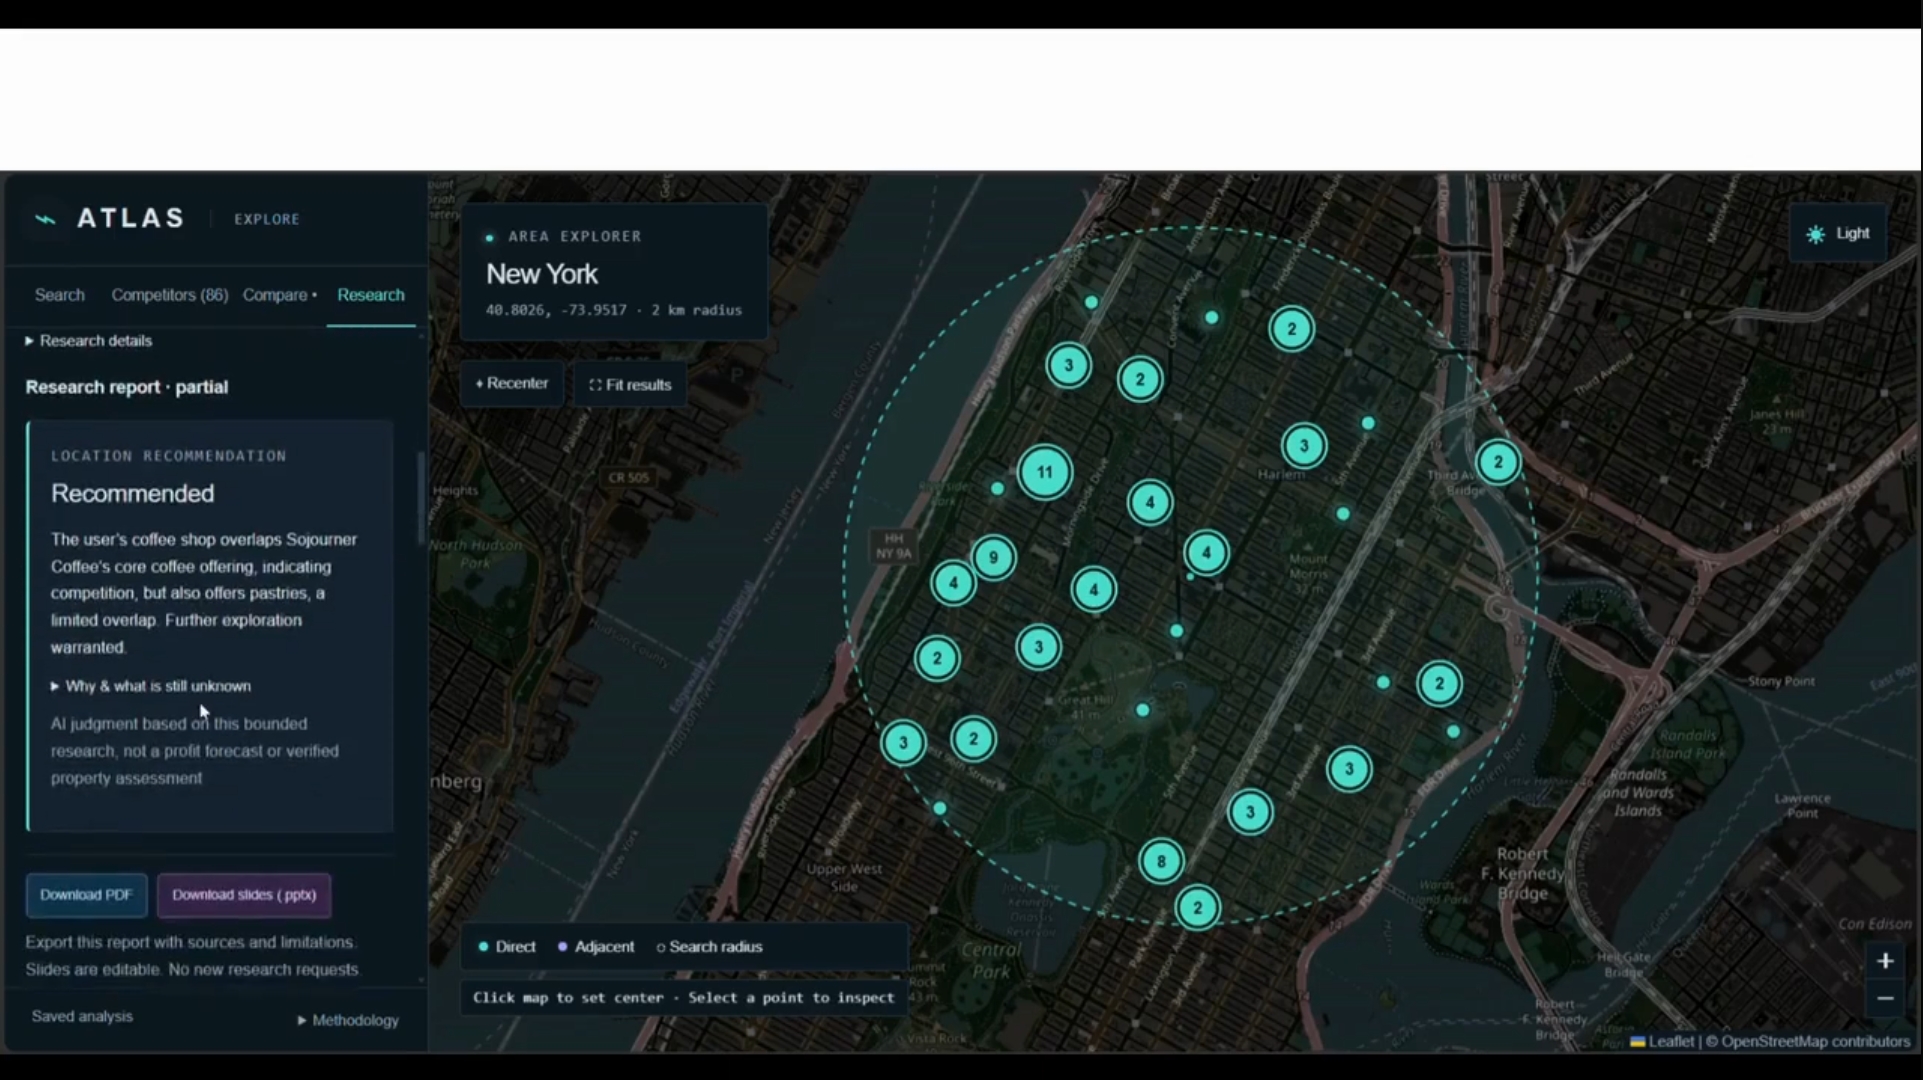
The Research tab investigates a shortlist of nearby businesses using web sources. It generates cited insights about how those businesses might affect the user’s idea, along with a provisional opening assessment. The report can be downloaded as a PDF or an editable slide deck.
How we built it
We built ATLAS with TypeScript, Next.js, React, and Leaflet. OpenStreetMap and Overpass provide the mapped business data. For research, Tavily retrieves web sources and NVIDIA NIM runs four focused AI roles: a researcher, an extractor, an analyst, and an evidence verifier.
We used this approach because we did not have a complete source of local business information or reviews. Giving each role a specific job helped us connect the report to actual sources and show uncertainty where the evidence was limited.
Challenges we ran into
Our biggest challenge was the lack of complete, reliable data. Many services required paid API access, while OpenStreetMap did not have every business or every detail we wanted. Web pages could also describe an entire brand rather than the exact branch shown on our map. We had to build a useful pipeline while being honest about those limits.
Accomplishments that we're proud of
We are proud that an idea from a team conversation became a working product. ATLAS combines an interactive map, business detail cards, location comparison, AI research, and downloadable reports. We also learned how to divide the work, bring different features together, and improve them through testing.
What we learned
This hackathon taught us that the goal is not always to build something groundbreaking in a few days. We learned how to collaborate, make decisions with limited time and resources, and change our approach when something did not work. We also learned that showing the limits of the data is just as important as showing the results.
What's next for ATLAS
We want to support more cities and other parts of the U.S. We would also like to compare verified prices, reviews, and services, while making sure that information belongs to the correct business location. In the future, we hope to let users choose different AI models for research, with our current model still available as the default.
Built With
- css
- github
- gpt-oss
- leaflet.js
- next.js
- nvidia-nim
- openstreetmap
- overpass-api
- pdf-lib
- playwright
- pptxgenjs
- react
- tavily
- typescript
- vitest
- zod

Log in or sign up for Devpost to join the conversation.