
Inspiration
chitchart.com --> they make the best infographics on the planet. Their work is interesting, easy to understand, and beautiful to look at.
What it does
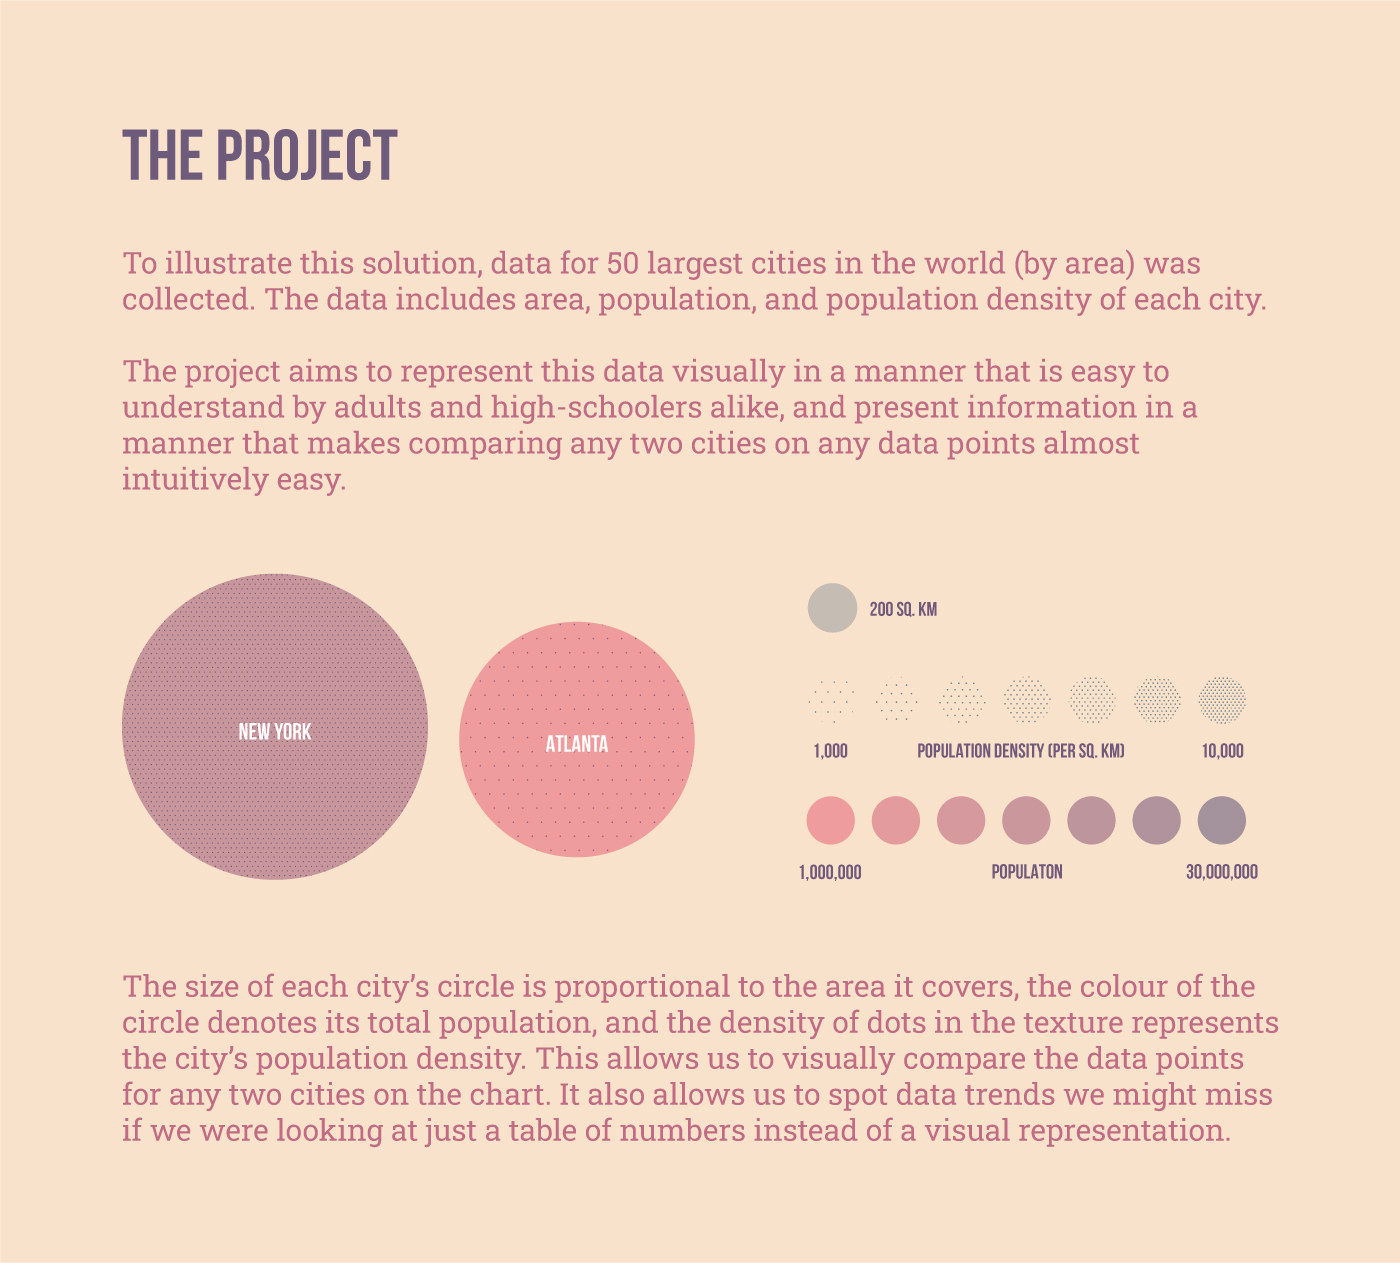
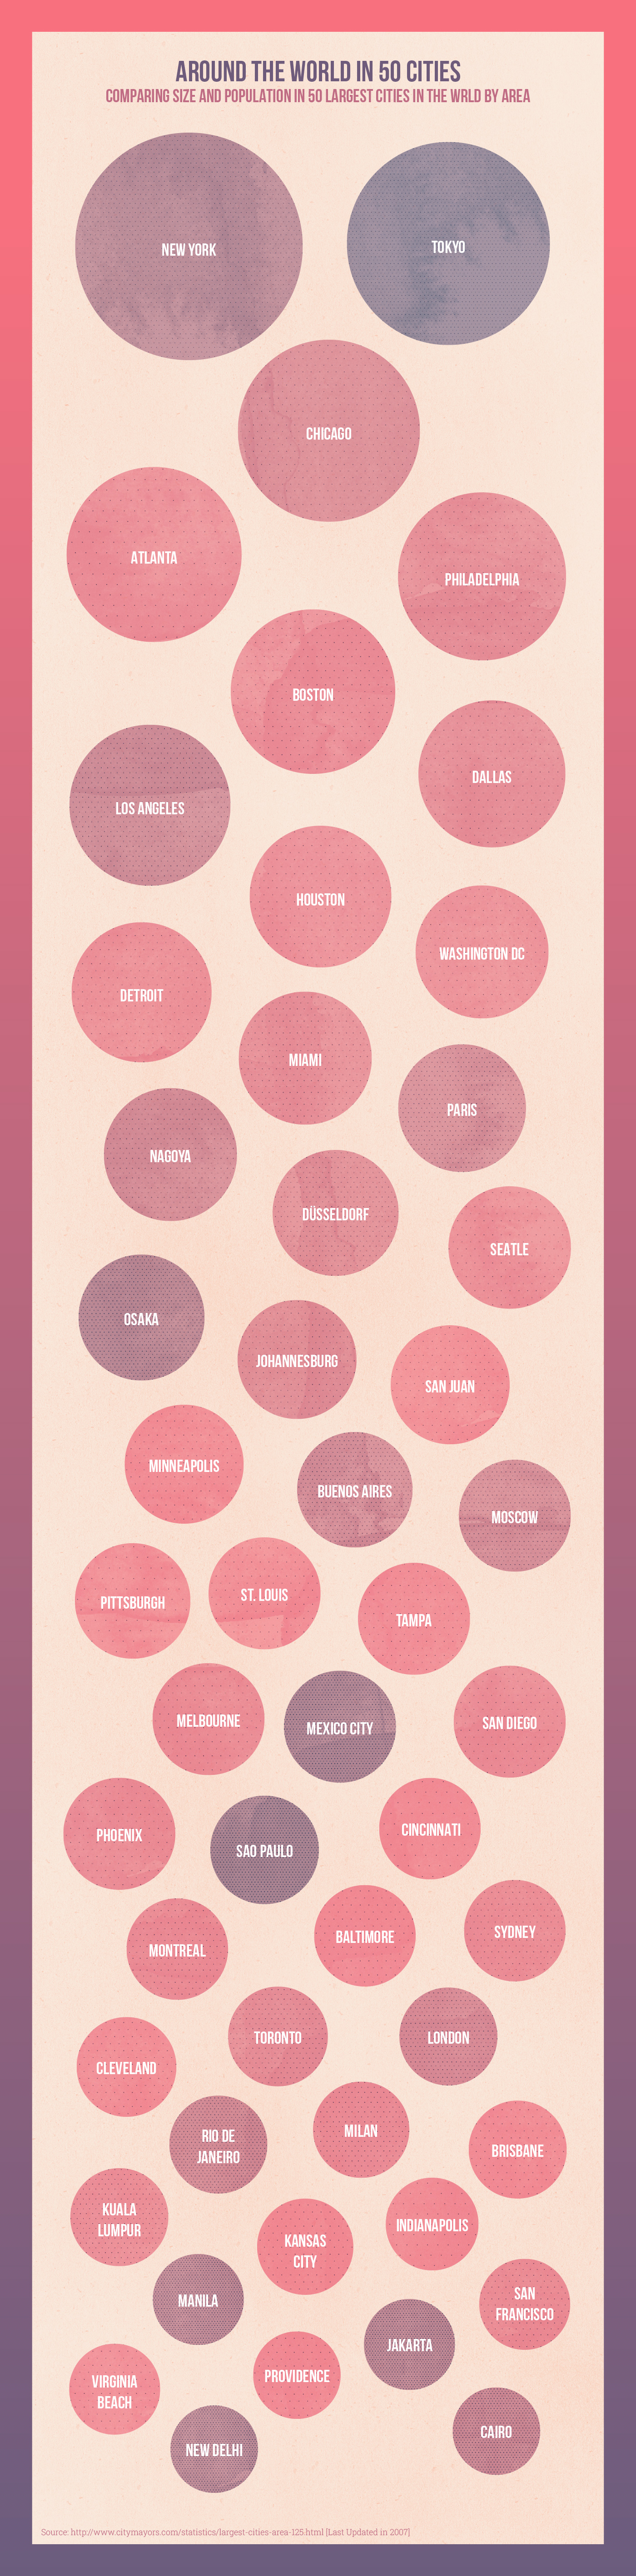
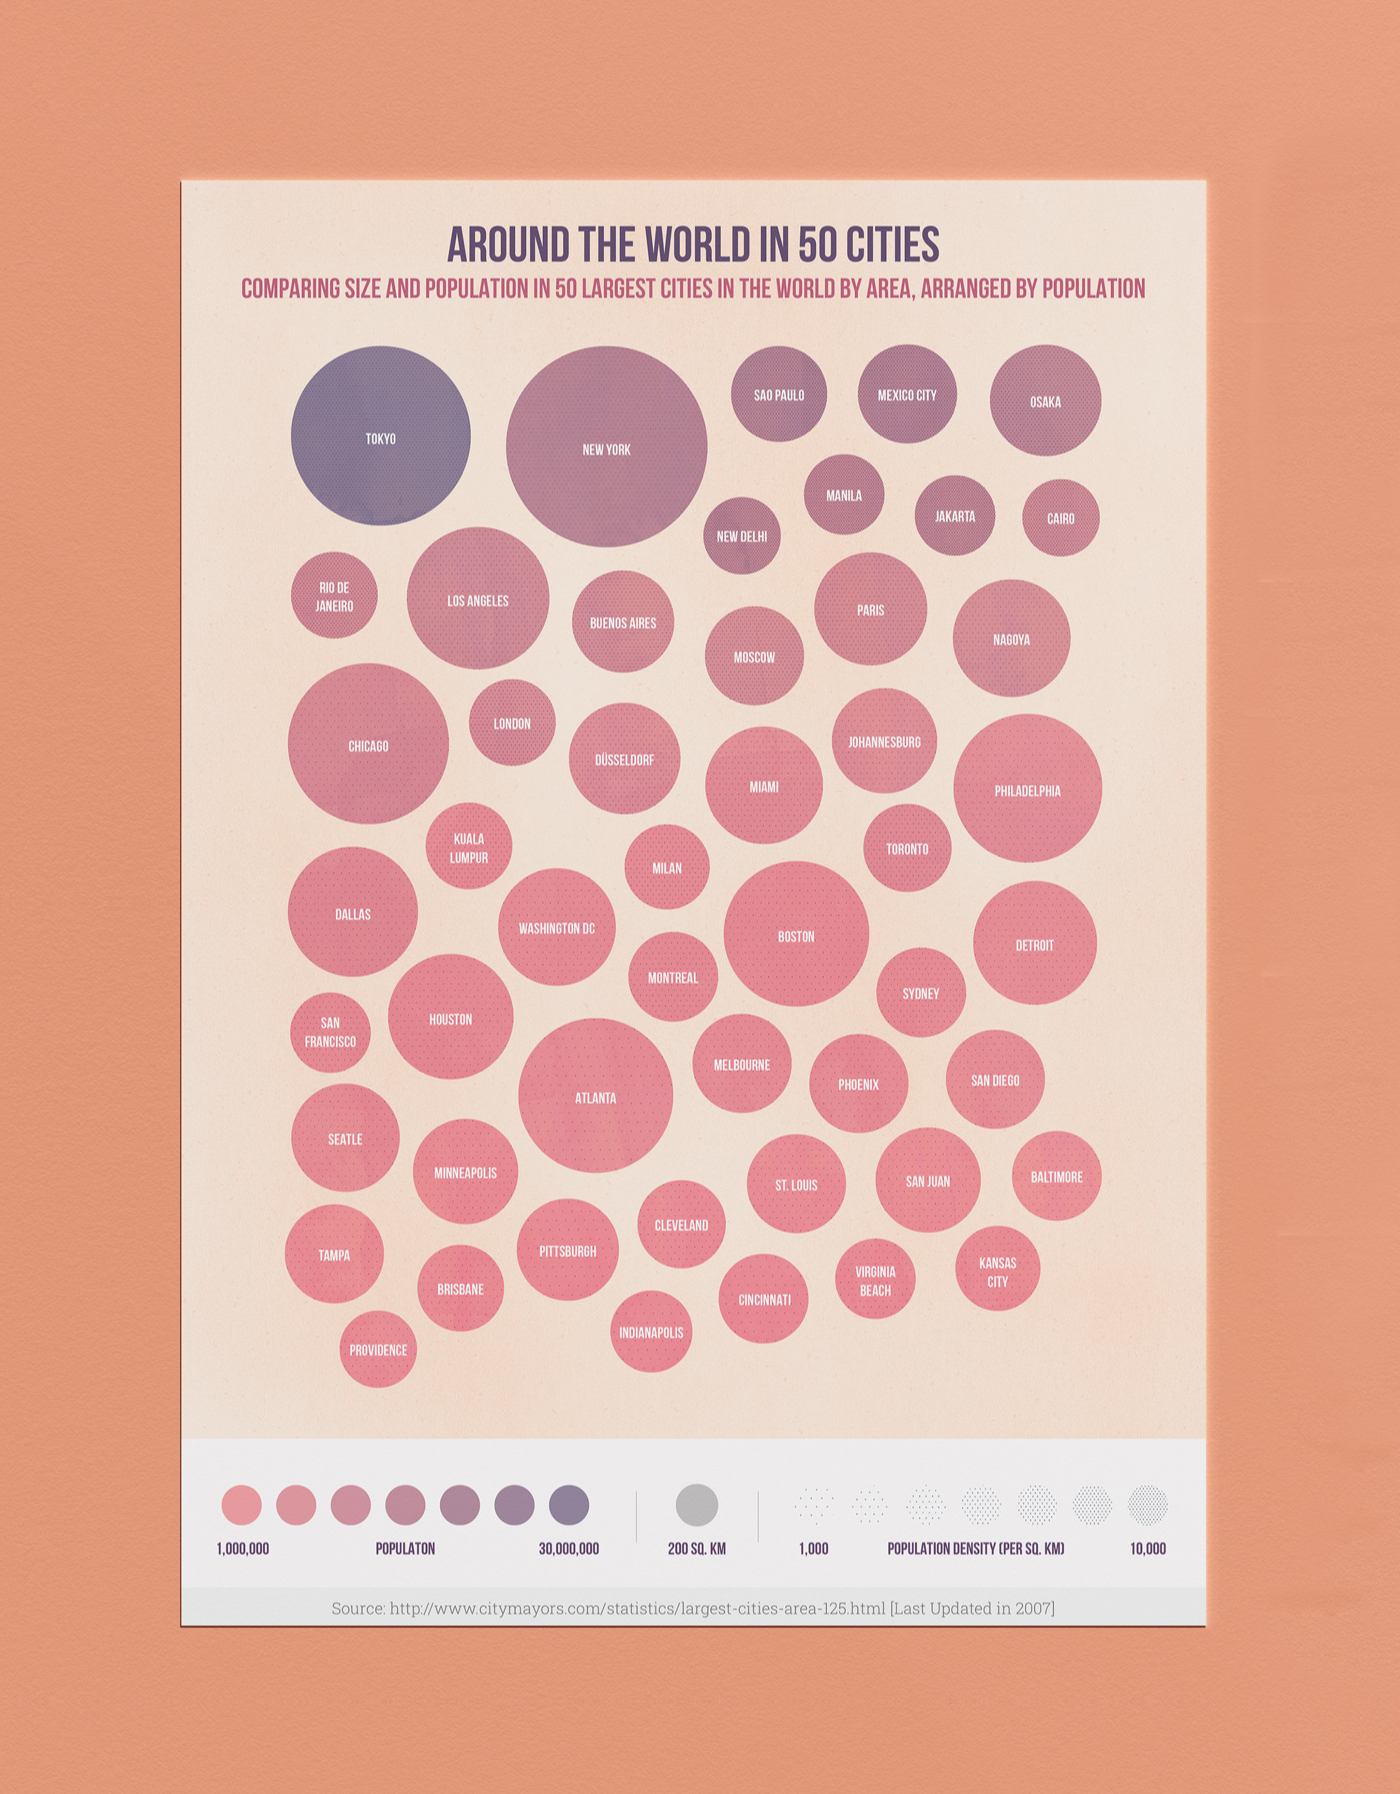
Best viewed on: https://www.behance.net/gallery/139296367/Around-the-World-in-50-Cities-Data-Visualization The project aims to represent data (area, population, population density) for 50 largest cities in the world visually in a manner that is easy to understand by adults and high-schoolers alike, and present information in a manner that makes comparing any two cities on any data points almost intuitively easy.
How we built it
- Step 1. Source Data
- Step 2. Determine what data should and should not be included - what would be most useful. Eg: it was decided that including geographical location of the cities would complicate the chart without yielding comparable benefits
- Step 3. Iterating over data representation schemes and colour/font combinations
- Step 4. Setting visual representation guidelines and creating a representation for each city
- Step 5. Ordering and Arranging the shapes into the two charts
- Step 6. Preparing mockups and the final presentation
Challenges we ran into
Mainly choice of colours - it took time to pick a scheme that is modern and aesthetic, yet keeps the chart easy to read and understand
Accomplishments that we're proud of
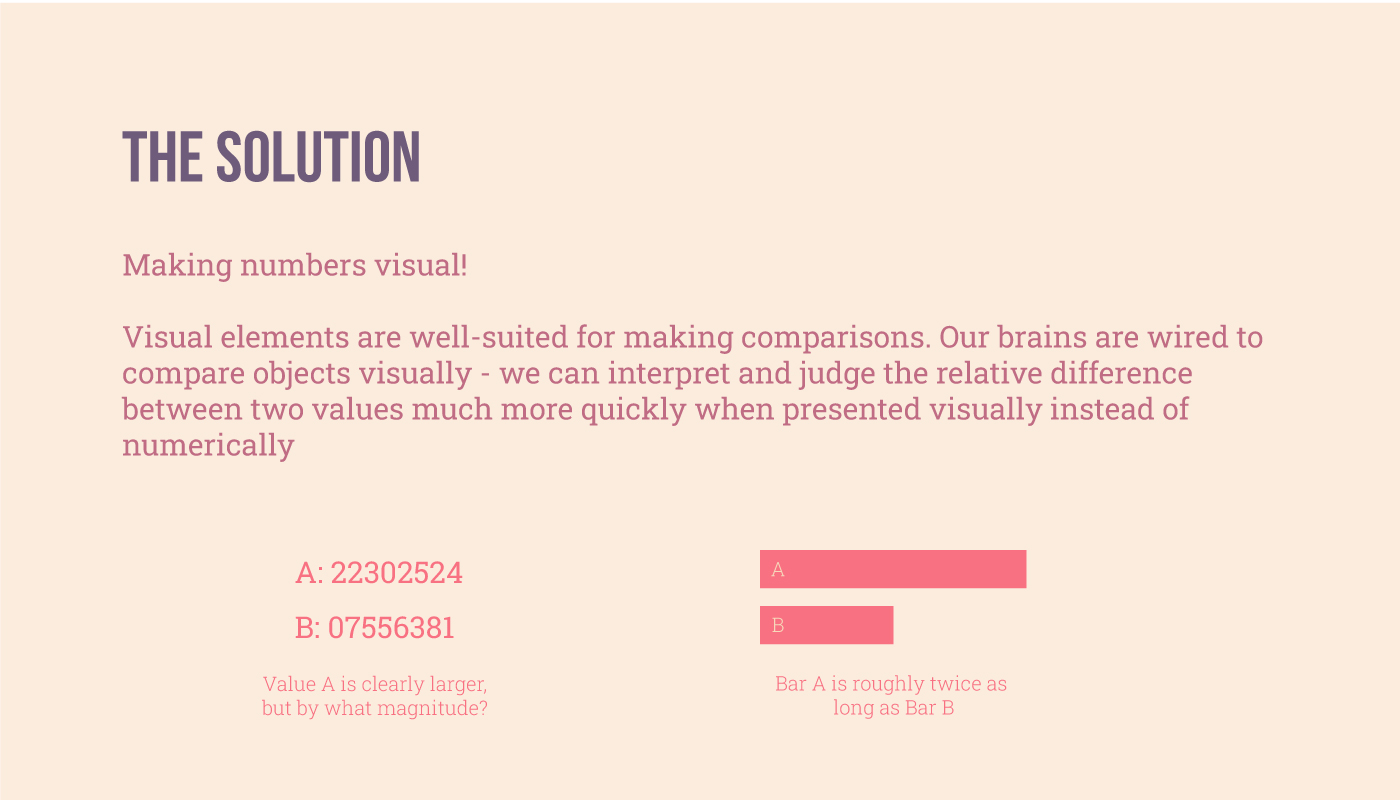
It looks really nice and is extremely functional at the same time. The aesthetics pull the viewer in and invite them to read further. Minimal text is used, leaving most of the communication to be done visually. Most importantly, this is something the average high-schooler will be able to understand just as easily as an adult.
What we learned
Data Visualization is tougher than it looks! But seriously, this was a great experience in creating a data visualization that is ready for use and looks professional.
What's next for Around the world in 50 cities | Data Visualization
Develop this into a tool that can generate similar charts based on your requirements. You only want cities in the US for your chart or you want top 37 cities by population, you have it. The tool will be able to generate such charts based on the user requirements and also orient it in any size required, from 24"x36" posters to standard letter-size prints.

Log in or sign up for Devpost to join the conversation.