-
-
Homepage

# ARGUS: Open-Source Geospatial Intelligence Fusion
**[argusweb.bond](https://argusweb.bond)** — Real-time geospatial intelligence. Public data. Zero API keys. $24/month Droplet.
---
## 🌍 What is ARGUS?
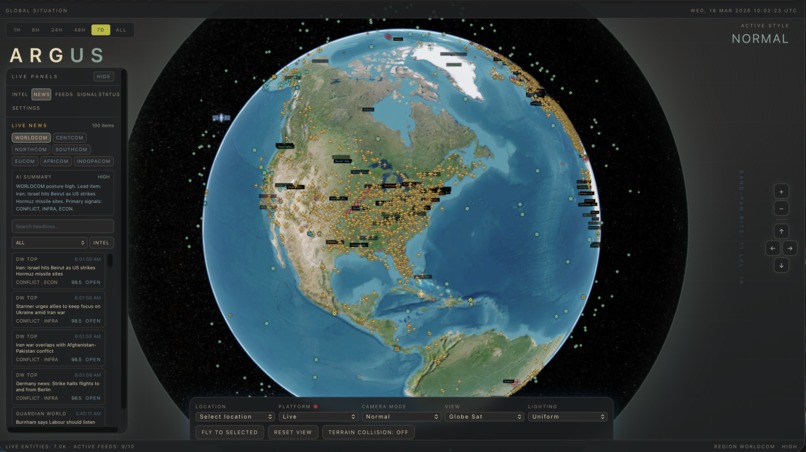
ARGUS is a real-time geospatial intelligence platform that fuses live data streams — commercial flights, military aircraft, orbital satellites, seismic activity— into a single 3D globe with intelligence-grade correlation. Think of it as the open-source OSINT version of what classified national intelligence agencies build with billions of dollars and restricted data. ARGUS does it with public APIs, no auth keys, and a DigitalOcean Droplet.
---
## 💡 Inspiration
The National Reconnaissance Office's SENTIENT program — declassified in 2022 — haunted me. Here was a system built by the US government to correlate satellite imagery, flight patterns, and atmospheric data into predictive intelligence. The architectural insight was profound: **it wasn't the individual data streams that mattered. It was the correlations between them.**
A flight over a military base is noise. A flight over a military base during a low-pressure system, with radar ghost contacts 5km away and an ADS-B data loss — that's a signal.
I'd been watching OSINT dashboards pile up online — beautiful visualizations of planes on maps, satellites orbiting in 3D, earthquake rings. But they all had the same flaw: they were passive monitors, not intelligence systems. They showed you *everything*. They told you *nothing*.
I wanted to build the thing that crossed the line from dashboard to fusion engine.
The name comes from Argus Panoptes — the hundred-eyed giant of Greek mythology. All eyes open. Nothing missed.
---
## 🔧 How We Built It
ARGUS runs as a split architecture, and DigitalOcean is the backbone of it.
### Frontend (Next.js + CesiumJS)
Built on **Next.js 16 + React 19 + TypeScript** with **CesiumJS** as the visualization substrate and **Zustand** for global state management. The frontend handles real-time 3D visualization — a spinning globe with live flight paths, satellite orbits, seismic events, and CCTV feeds rendered as billboards. Four visual modes (Normal, NVG, FLIR, CRT) are applied as WebGL post-process shaders directly on the Cesium viewer.
### Data Layer
Six live data adapters, all proxied through Next.js API routes (`/api/feeds/*`):
| Source | What It Provides | Update Frequency |
|--------|-----------------|-----------------|
| OpenSky | ~1.2M commercial flights/day | Every 10s |
| ADS-B Exchange | Military + untracked aircraft | Every 5s |
| CelesTrak | 4,000+ orbital satellites (TLE) | Daily |
| USGS | Magnitude 4.5+ earthquakes | Real-time |
| TFL JamCam | London CCTV traffic cameras | Every 60s |
| NOAA GFS | Global atmospheric grid | Every 6 hours |
A staggered polling manager prevents thundering herd — fast feeds every 10s, atmospheric every hour, TLE updates daily.
### Intelligence Layer
The spatial correlation engine evaluates rules across all active events simultaneously — combining proximity, temporal windows, and atmospheric thresholds. Example rule in production:
```typescript
// "Aircraft entering military corridor during atmospheric anomaly"
const rule: CorrelationRule = {
id: "military-airspace-anomaly",
triggers: [
{ proximity: { eventTypes: ["flight", "military"], distanceKm: 10 } },
{ temporal: { windowSeconds: 300 } },
{ atmospheric: { pressureHPa: 950, windSpeedM_s: 20 } },
],
};
When a rule fires, ARGUS surfaces an incident alert directly in the HUD overlay.
Backend (DigitalOcean Droplet — Docker Compose)
The Droplet runs the heavy compute work:
- PostgreSQL + PostGIS — spatial event storage with
GEOGRAPHY(POINT, 4326)columns and GIST indexes for fast proximity queries - TiTiler — serves Cloud-Optimized GeoTIFFs as Cesium imagery tile layers
- Python ingestor — parses NOAA GFS GRIB2 atmospheric data every 6 hours via
cfgrib → rasterio → gdal_translate, stores as spatial grid points in PostGIS
A single docker compose up -d brings the entire intelligence backend online.
⚔️ Challenges We Faced
GRIB2 is a nightmare. NOAA's atmospheric data comes in a binary gridded format designed for meteorologists, not web developers. Parsing it, converting it to Cloud-Optimized GeoTIFF, and serving it as Cesium imagery layers required building a full Python pipeline before a single atmospheric pixel appeared on the globe.
Cesium entity lifecycle management. Naively recreating entities every poll cycle caused massive GC spikes and frame drops. The solution: mutable entity updates — find the entity by ID, mutate its position in-place, never destroy and recreate. This kept the globe running smoothly with 1,000+ active entities at 60fps.
CORS everywhere. Every external data source has different CORS policies. Proxying all upstream requests through /api/feeds/* gave us a single place to handle errors, cache responses, and swap backends — without touching the frontend.
Docker networking on the Droplet. Getting Next.js (3000), PostGIS (5432), and TiTiler (8000) to communicate correctly — with TiTiler reading files written by the Python ingestor — required careful volume mounts and service dependency ordering in docker-compose.yml.
🏆 Accomplishments That We're Proud Of
- A fully operational intelligence fusion engine running on a $24/month Droplet. The same architectural pattern that underpins classified geospatial systems — correlating atmospheric, seismic, flight, and satellite data in a unified view — running entirely on public data and commodity cloud infrastructure.
- Sub-second entity updates on a live 3D globe for 1,000+ simultaneously tracked objects without frame drops, using mutable Cesium entity patterns.
- Four visual rendering modes (Normal, NVG, FLIR, CRT) applied as real-time WebGL post-process shaders — because if you're watching a 3AM military flight anomaly, you might as well look the part.
- Zero external API costs. Every data source is free and public. The only bill is the Droplet.
🧠 What We Learned
1. Correlation is the product, not the data. Every data source is noise on its own. The moment you start asking "what happens when X and Y occur simultaneously within Z kilometers," the platform transforms from a map into an intelligence tool. Implementing the spatial correlation engine was the biggest architectural revelation of this build.
2. Public data is rich enough. OpenSky tracks ~1.2 million flights per day. CelesTrak maintains orbital elements for 4,000+ satellites. USGS reports every earthquake above magnitude 2.5 in real-time. NOAA publishes global atmospheric grids every 6 hours. None of this requires an API key. The intelligence gap isn't the data — it's the tooling to correlate it.
3. Cesium is not a map, it's a substrate. It's a GPU-accelerated geospatial runtime that handles satellite positioning, terrain rendering, post-processing shaders, and time-series playback natively. Learning entity mutation patterns to avoid GC spikes was the core technical skill of this project.
4. Polling architecture matters more than the data sources. The non-overlapping poll scheduler — tiered at 10s for flights, 60 min for atmospheric, 6h for TLE — was one of the highest-leverage architectural decisions. It transformed a jittery prototype into a stable runtime.
5. The VPS/local split is the right infrastructure model.
GRIB2 parsing, PostGIS spatial queries, and satellite imagery tiling are compute-intensive. Running those on a DigitalOcean Droplet while the interactive Cesium globe handles visualization means neither side is compromised. The frontend is fast and responsive. The backend is powerful and scalable. DigitalOcean made the ops side disappear — one docker compose up -d and the entire intelligence stack is live.
🔭 What's Next for ARGUS
- Copernicus/Sentinel-2 imagery — 10m optical satellite tiles overlaid on the globe, updated every 5 days
- Timeline replay — scrub backwards through 30 days of events and replay incidents at any speed
- Incident Notebook — capture a geospatial snapshot (location + active feeds + correlation alert) and export as a shareable PDF brief
- Rule builder UI — define custom correlation rules without touching code (proximity, temporal, and atmospheric thresholds)
- WebSocket fanout — push correlation alerts to connected clients in real time instead of polling from the frontend
ARGUS is no longer a dashboard. It's a fusion engine. The roadmap is about making that engine queryable, collaborative, and auditable by anyone.
Built With
- ads-b-exchange
- and-cctv-feeds-rendered-as-billboards.-four-visual-modes-(normal
- celestrak
- cesiumjs
- cfgrib
- cloud-optimized-geotiff
- digitalocean
- docker
- docker-compose
- element
- flir
- gdal
- geojson
- grib2
- next.js
- noaa-gfs
- node.js
- nvg
- opensky-api
- postgis
- postgresql
- python
- rasterio
- react
- satellite-orbits
- satellite.js
- seismic-events
- tfl-jamcam-api
- titiler
- two-line
- typescript
- usgs-earthquake-api
- webgl
- zustand

Log in or sign up for Devpost to join the conversation.