Inspiration
The Aravalli range is India's oldest mountain range and the green wall between the Thar desert and Delhi, Gurugram and Faridabad. It is being carried away. In 2018 the Supreme Court said 31 of 128 hills in Rajasthan's Aravallis had vanished. A report to the National Green Tribunal put Gurugram's protected-zone loss at 10,000 acres in eight years, and Faridabad's administration counted 1,200 acres lost to encroachment. Residents film the trucks and file complaints, and as one told The Tribune, "We make complaints, submit videos, but nobody cares." A complaint with a photo can be dismissed. A satellite pass with a timestamp is harder to dismiss.
What it does
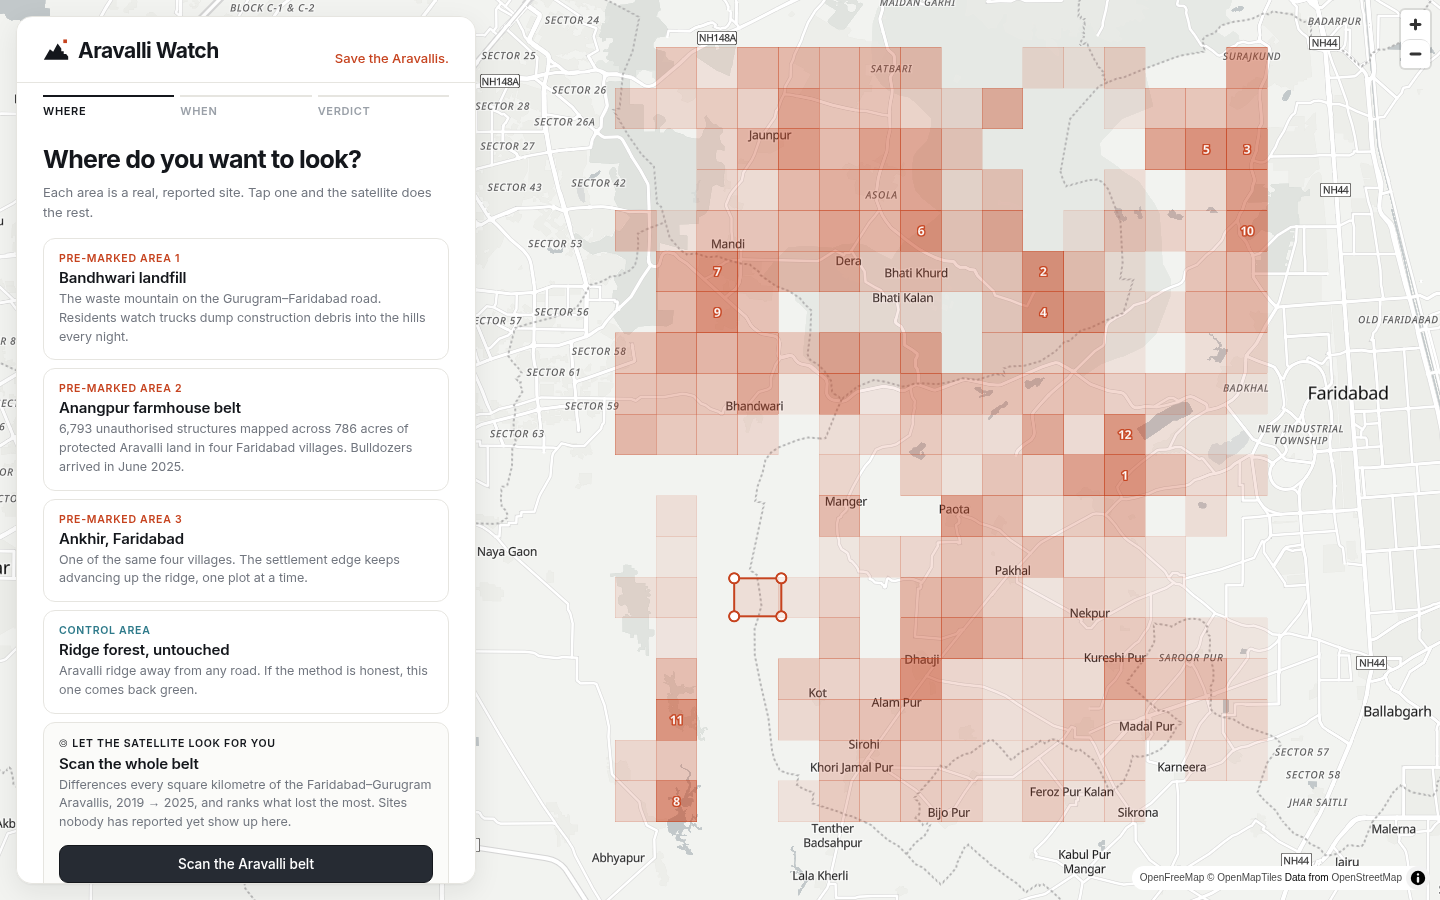
- Pick a place: a pre-marked site, a search, or an outline you draw.
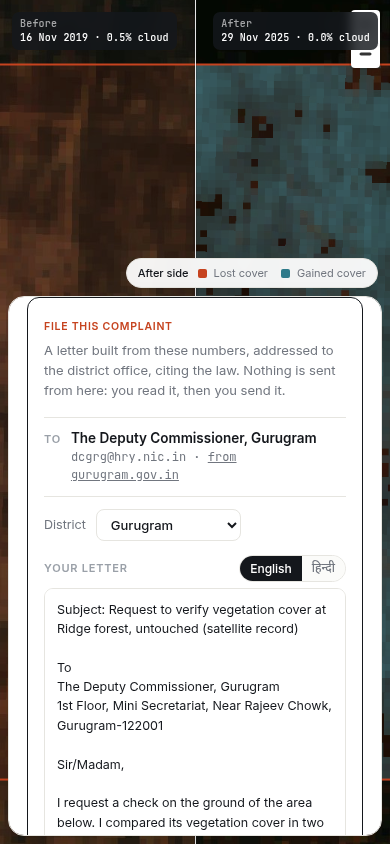
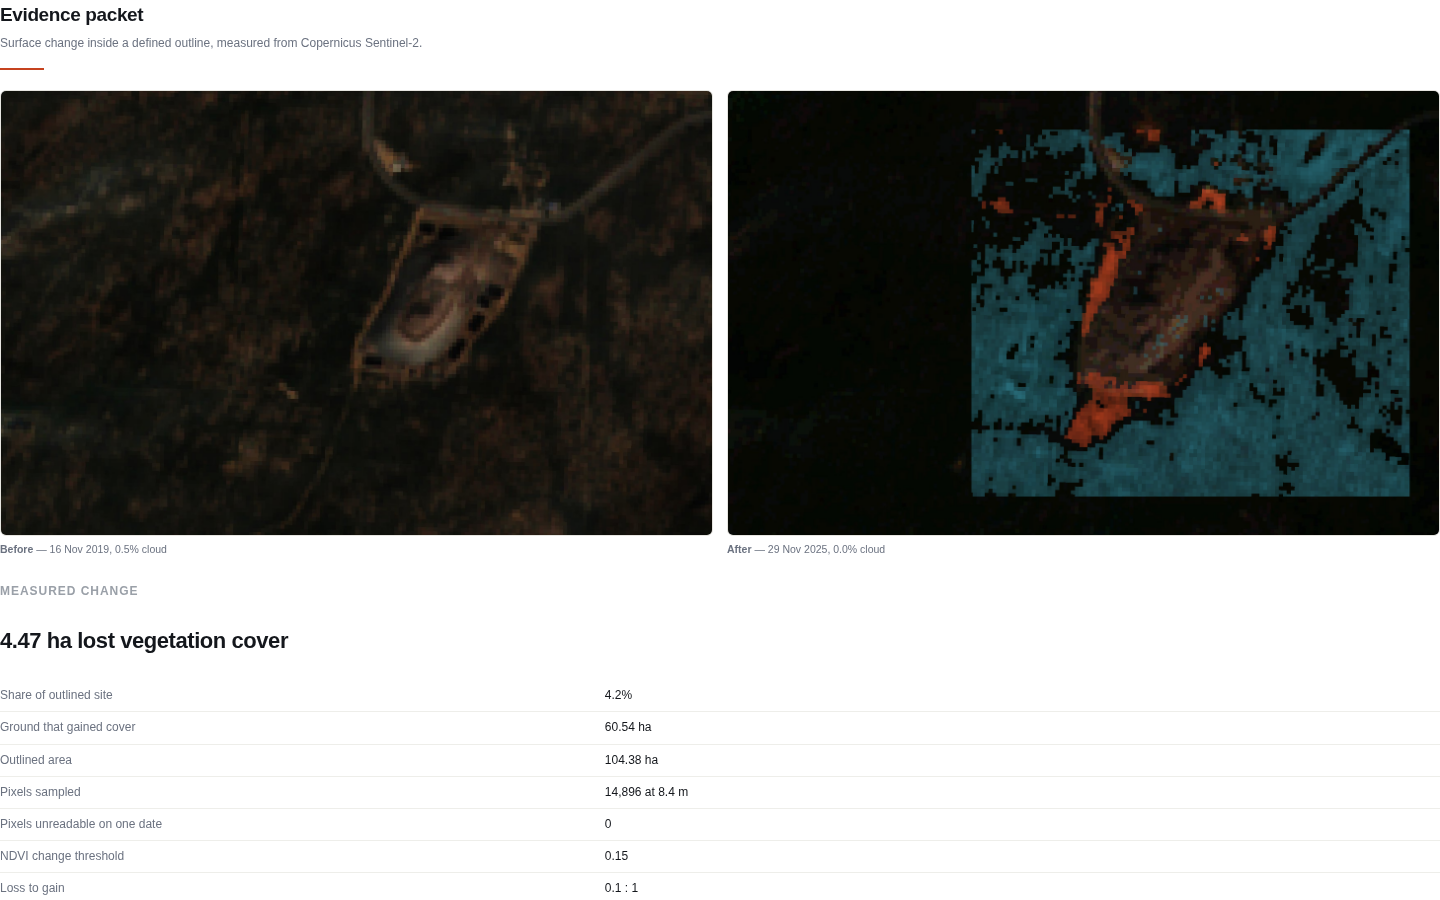
- Measure it from orbit: two dry-season Sentinel-2 passes (Nov–Dec of two years, the same satellite tile) are compared pixel by pixel. You get lost cover, share of area, and a loss-to-gain ratio, with a swipe view and a red/teal change map.
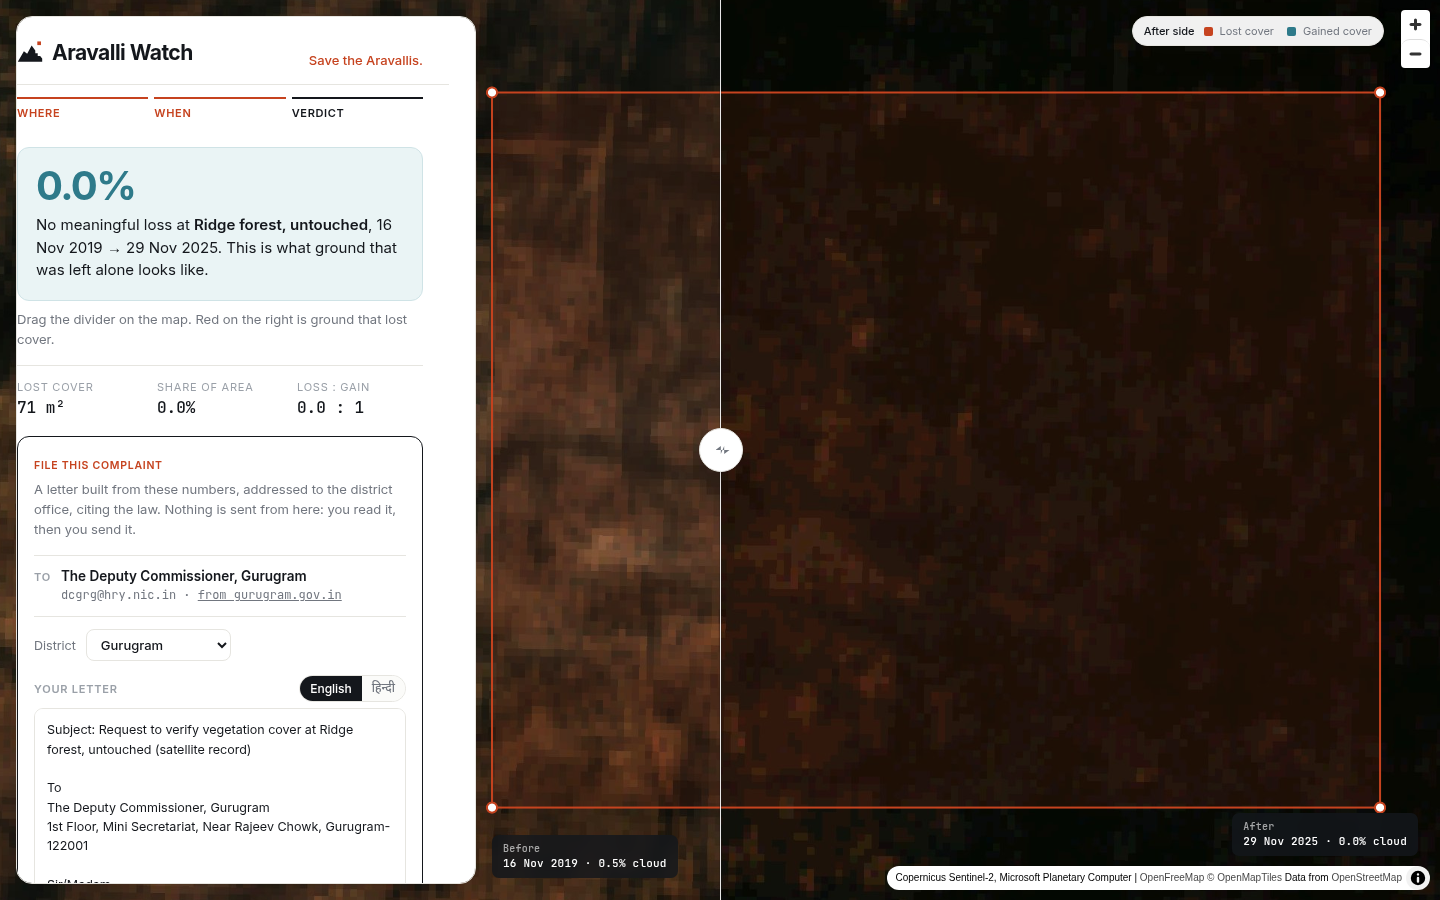
- An honest verdict: if loss and gain balance, it says "season and sampling, not clearing" instead of painting a scary red map. An untouched ridge-forest control is measured the same way and reads 0.0%.
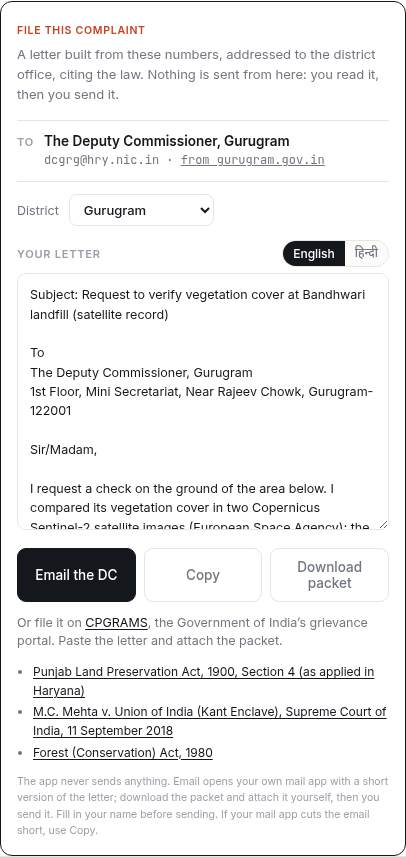
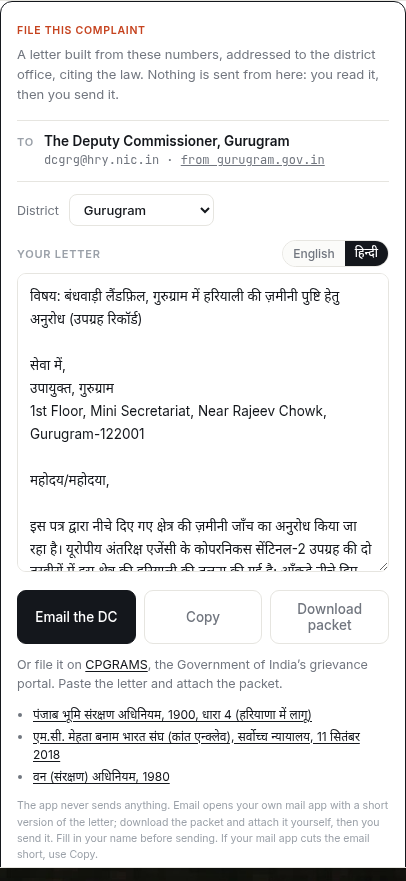
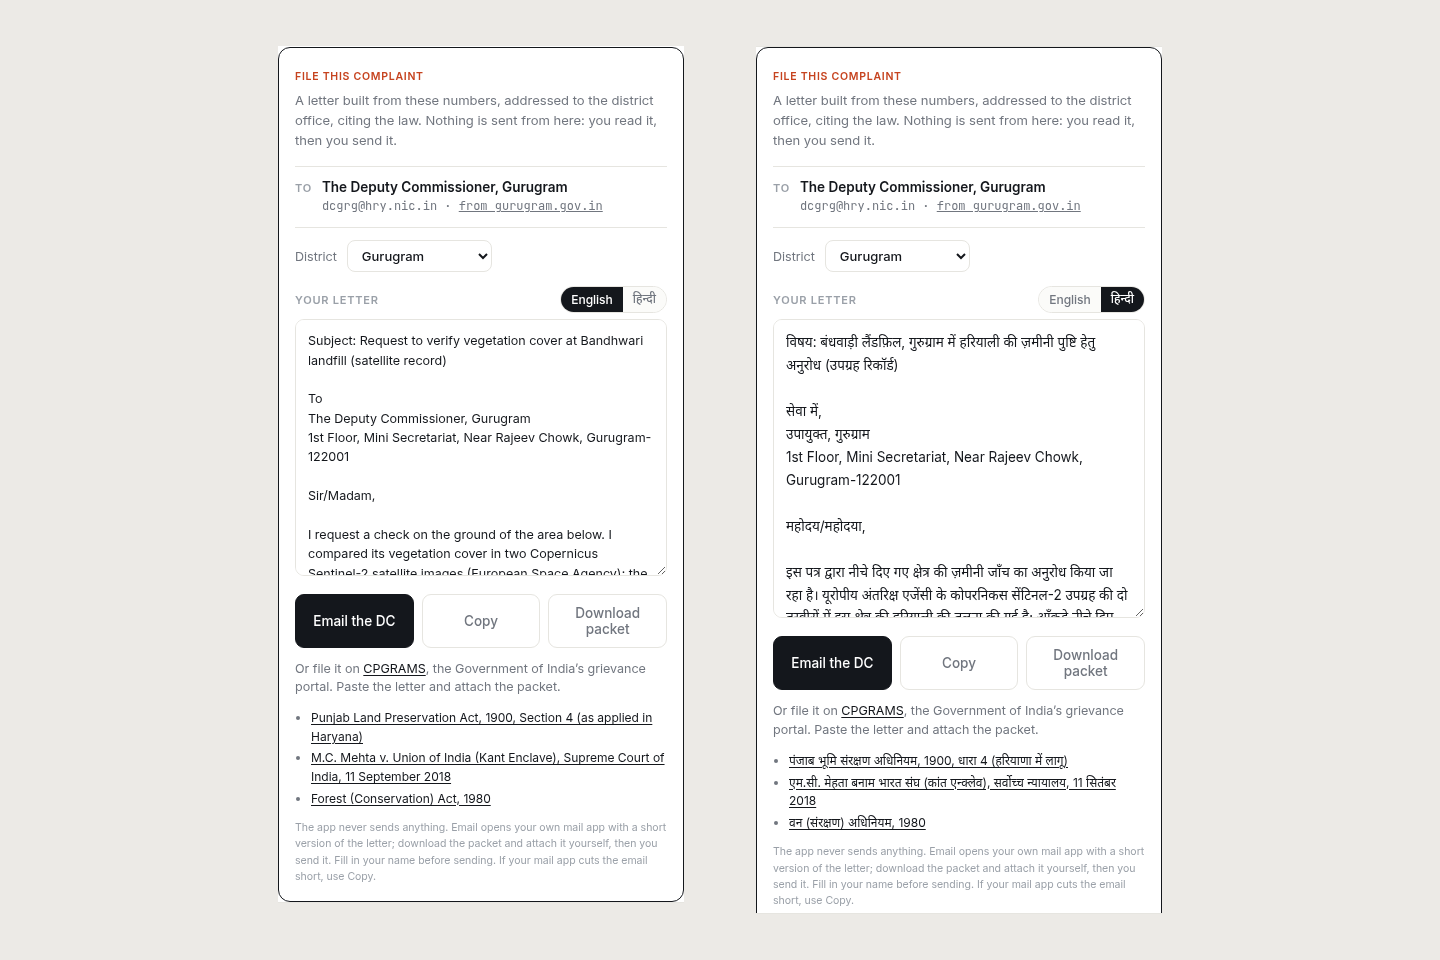
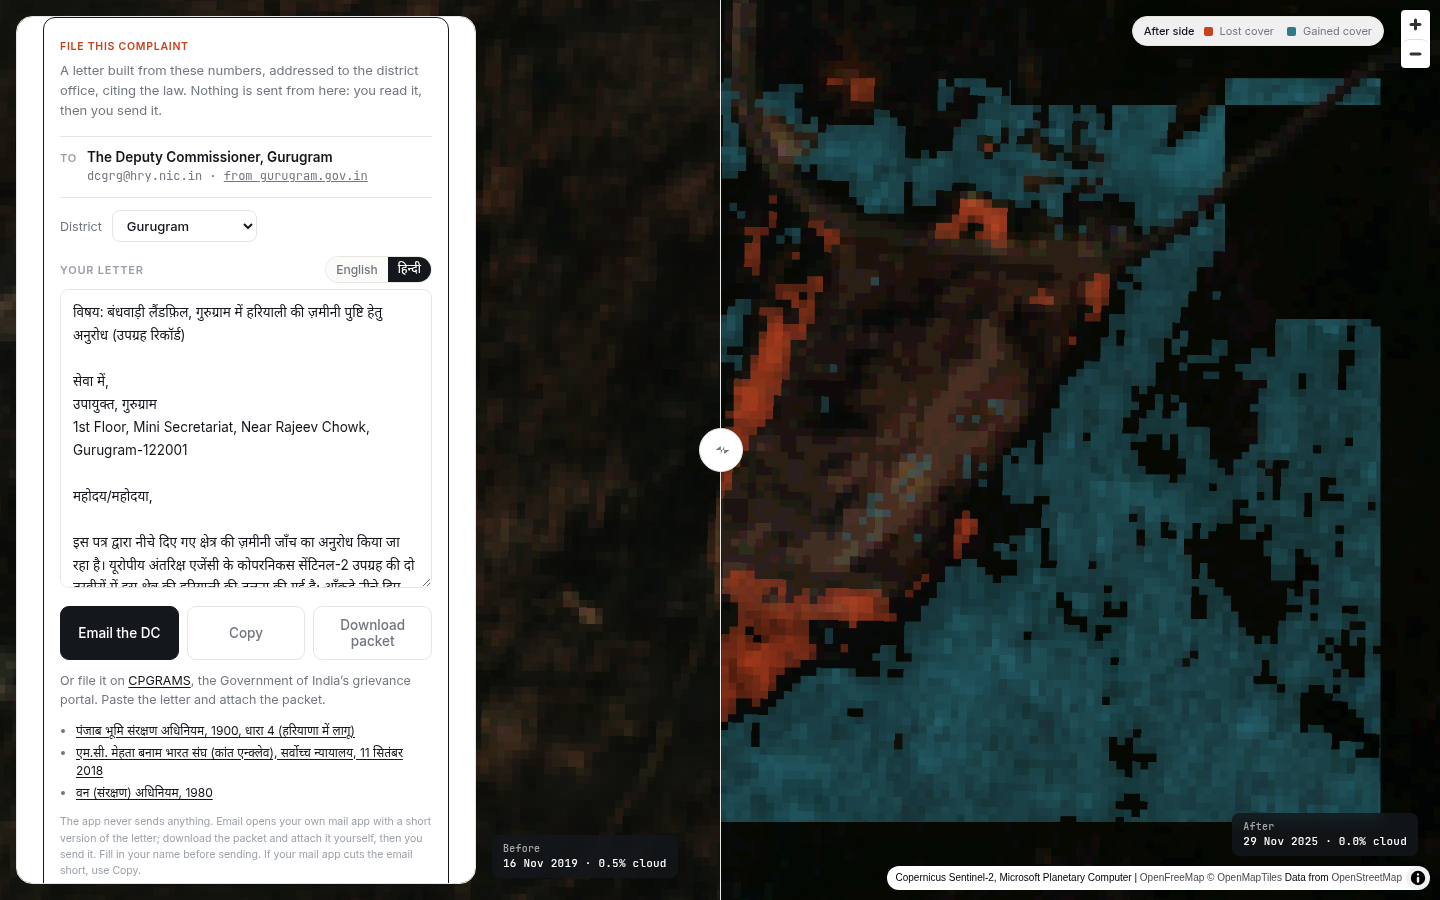
- File this complaint: one click writes a letter to the right district officer (Deputy Commissioner Gurugram or Faridabad, emails checked against the official district pages). It cites the Punjab Land Preservation Act 1900 (Section 4, "where the land is notified"), the Supreme Court's 2018 Kant Enclave judgment and the Forest (Conservation) Act 1980, with the measured numbers and satellite scene ids. It works in English and Hindi, from a fixed template, so no AI is needed. If the measurement doesn't show clearing, the letter asks for an inspection instead of making an accusation. The app never sends anything: you read it, then you send it, or file on CPGRAMS, the national grievance portal.
- Scan the whole belt: the Gurugram–Faridabad hills in about 12 seconds, ranked hotspots, each flagged if it matches no public record.
- Evidence packet: before/after images, scene ids, timestamps, method and limits, in one page you can attach.
How I built it
- Sentinel-2 L2A from Microsoft Planetary Computer (STAC search + tiler). No account, no key. The least-cloudy pass per window, pinned to one MGRS tile so the footprints match.
- NDVI is computed per tile in the browser through a custom MapLibre protocol, differenced inside the outline, and summarised with zonal statistics.
- The noise test: loss is reported next to gain, and each 4 km scan tile's own seasonal shift is removed before ranking hotspots.
- District from OpenStreetMap boundaries (Nominatim). TypeScript + Vite on Vercel. An optional Featherless model (Qwen3-30B) writes only the plain-English brief; the letter and every number are deterministic.
Challenges: I found a bug in my own evidence
Since January 2022, Sentinel-2 processing (baseline 04.00+) adds 1,000 to every reflectance value. My first version never removed it, so every recent image looked less green than it really was. That produced a dramatic "110 : 1 loss" at the Bandhwari site. After fixing it per scene (reading each scene's processing baseline), the same place over the same dates shows 0.1 : 1: more ground gained cover than lost it. I withdrew the old number, corrected the README, and made the tool and the letter say exactly what the data supports. I also clipped the belt scan to the hills, because the first version was ranking city construction east of NH44 as hill loss.
Accomplishments
- A civic tool that reaches a real office in one click, in two languages, with the exact law cited.
- A method that checks itself: the control, the loss-to-gain test, and a bug fix that made the result less dramatic and more true.
- Everything runs on free public data, in the browser.
What I learned
Remote sensing is easy to make look convincing and hard to make honest. Processing baselines, seasons and haze can all fake a "loss". The most important feature turned out to be the one that says "this is not clearing".
What's next
- Place names on every hotspot and a district leaderboard.
- A time-lapse of each site across all years.
- A verifiable evidence fingerprint (a hash of scene ids, outline and method) so anyone can re-derive a number.
- Ground-truthing hotspots with residents before anyone files anything.
Disclosure
I started Aravalli Watch in September 2026 as a personal project and never submitted it anywhere. For WarriorHacks 2.0 I built: the Sentinel-2 offset fix and re-measurement, the "File this complaint" flow (English and Hindi letters, district detection, legal citations, CPGRAMS route), clipping the belt scan to the hills, the evidence-packet capture fix and plain-language errors. The GitHub commit history shows what was built when.
Built With
- featherless
- maplibre-gl
- microsoft-planetary-computer
- nominatim
- openstreetmap
- sentinel-2
- stac
- typescript
- vercel
- vite

Log in or sign up for Devpost to join the conversation.