-
-
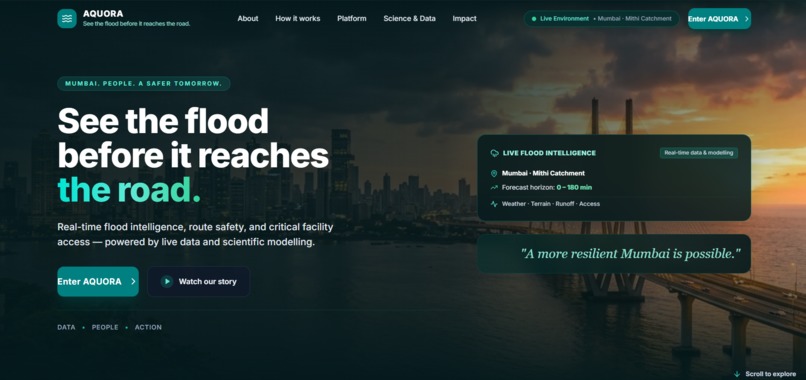
Floating Page
-
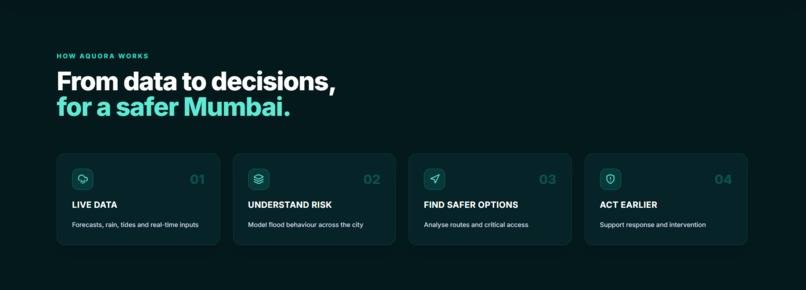
Process
-
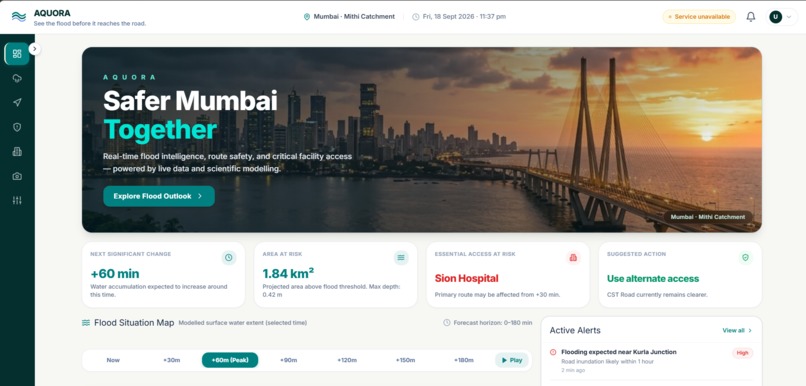
Dashboard
-
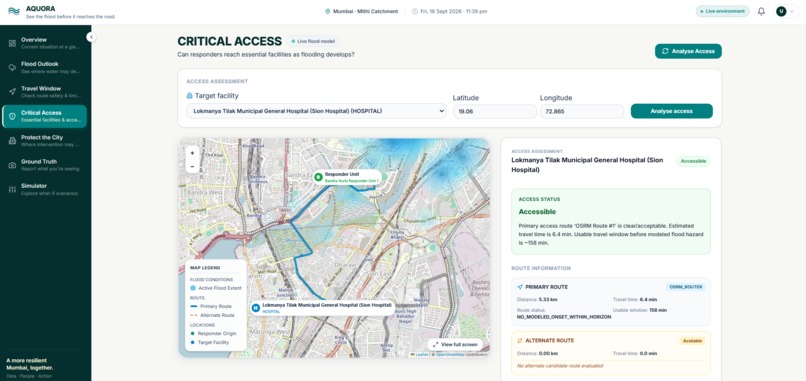
Critical Access
-
Protect the City
-
Travel Window
-
Floud Outlook
-
Simulator
-
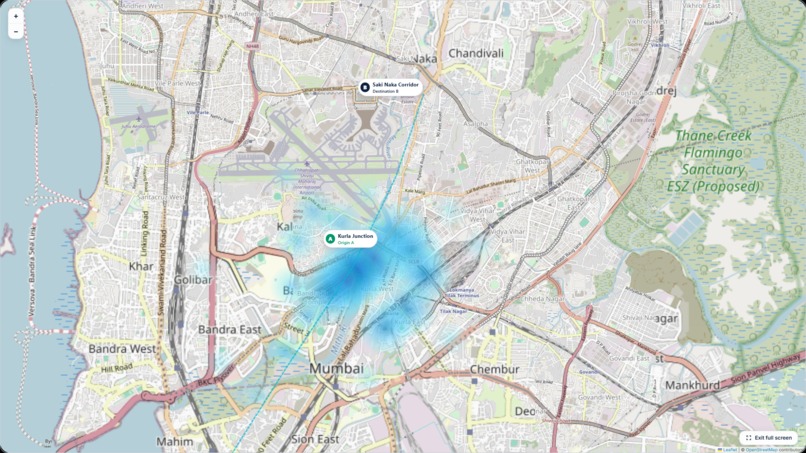
Map View
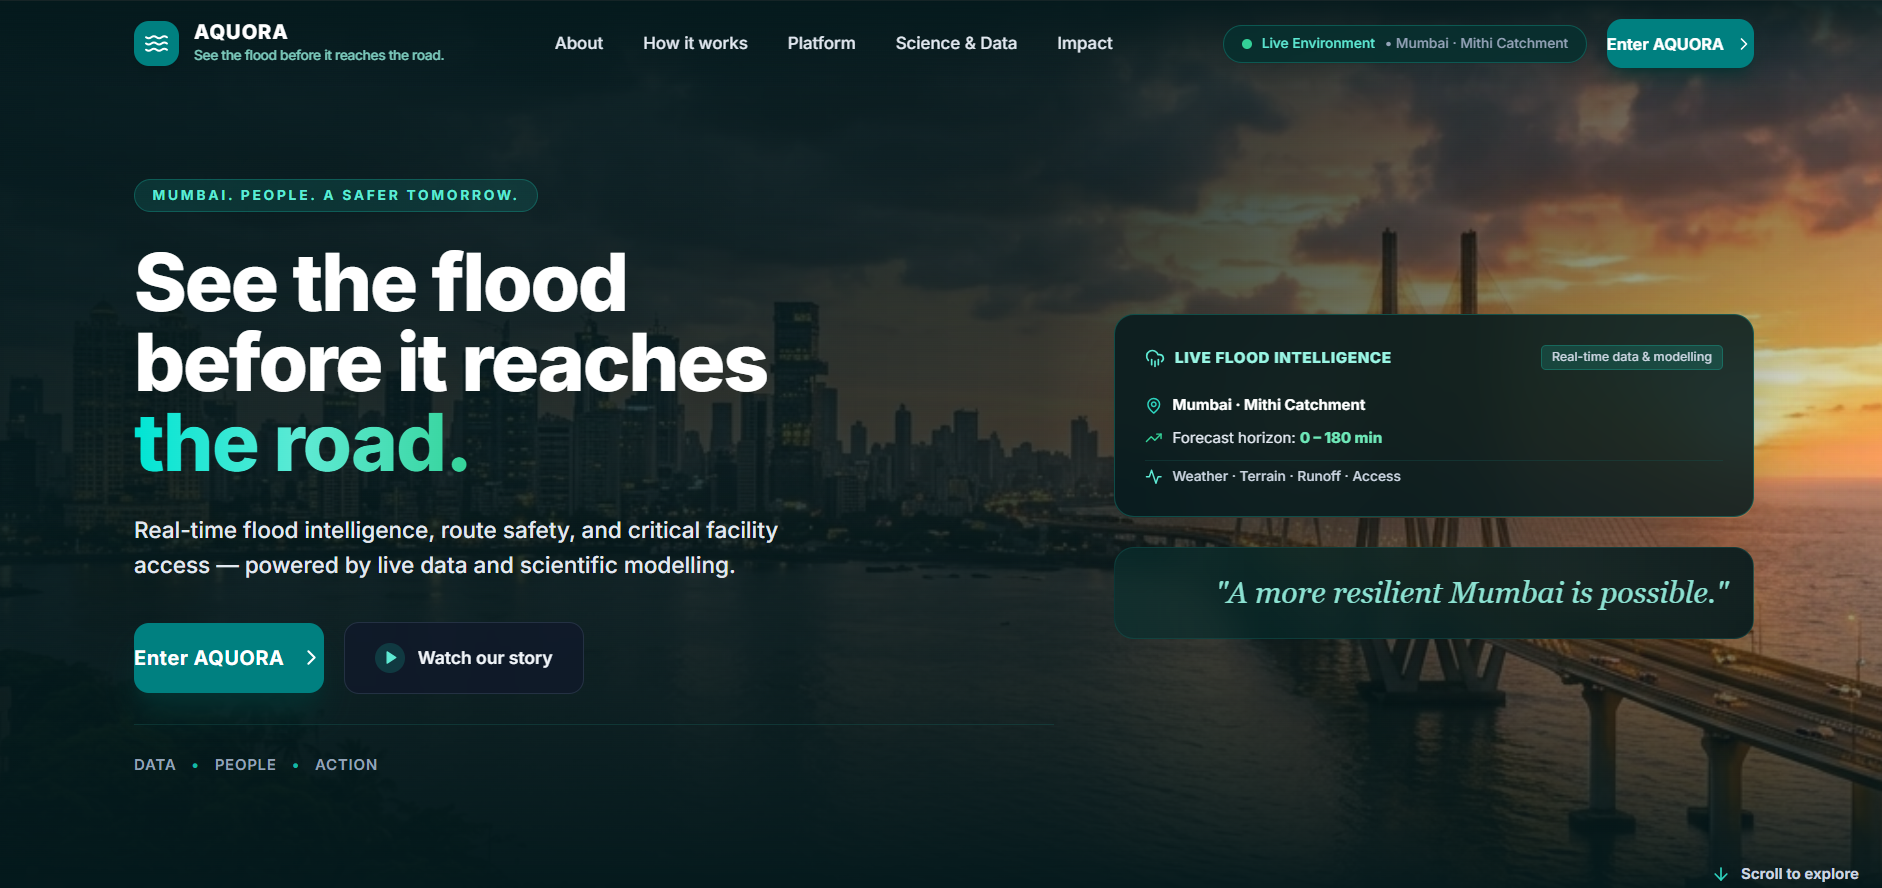
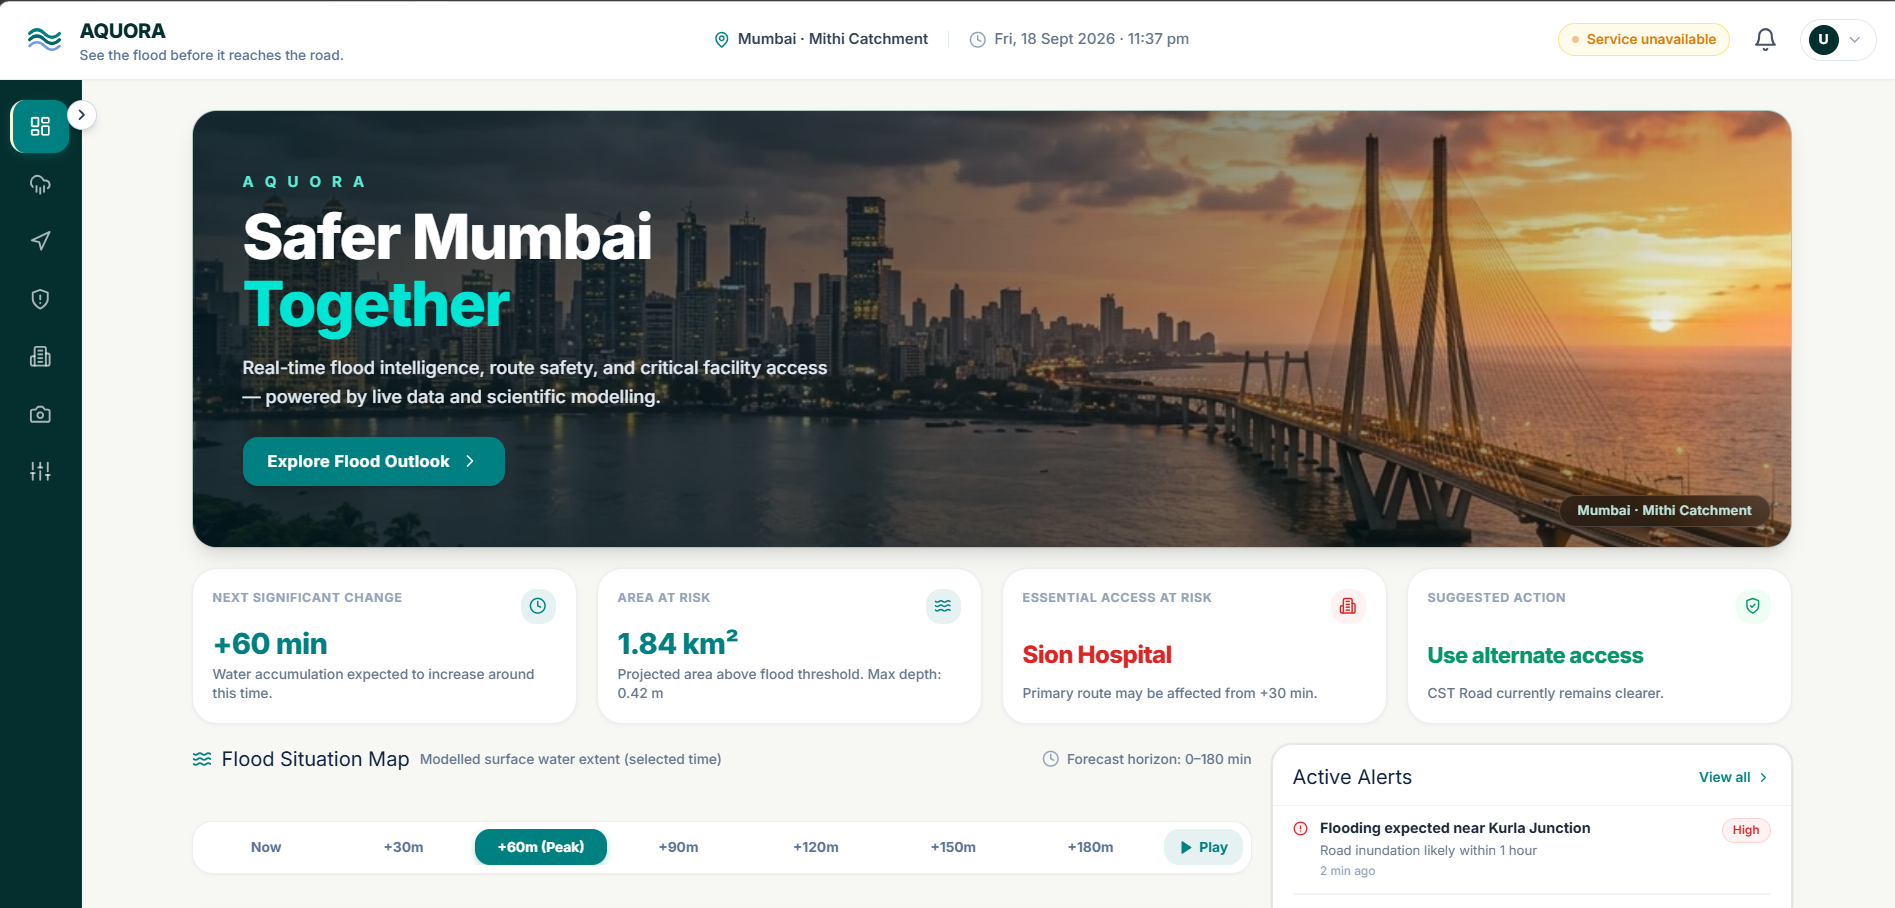
🌊 AQUORA — Urban Flood Intelligence & Response Platform
🌊 Inspiration
Urban flooding is not only a question of where water will accumulate. For a responder, city operator, or person trying to travel through an affected area, the important questions are:
- When will flooding become dangerous?
- Which roads may become unsafe, and how much travel time is available?
- Which hospitals, fire stations, and other critical facilities could lose access?
- What intervention could be considered before conditions worsen?
- What are people actually observing on the ground?
- How can every decision be traced back to the underlying evidence and model run?
We built AQUORA around these questions.
Our pilot focuses on the Mithi River urban catchment in Mumbai, where intense rainfall, dense urban development, constrained drainage, waterways, and critical transport corridors can interact during extreme rainfall events.
The core idea was simple:
Don't stop at predicting the flood. Connect prediction to decisions.
💡 What is AQUORA?
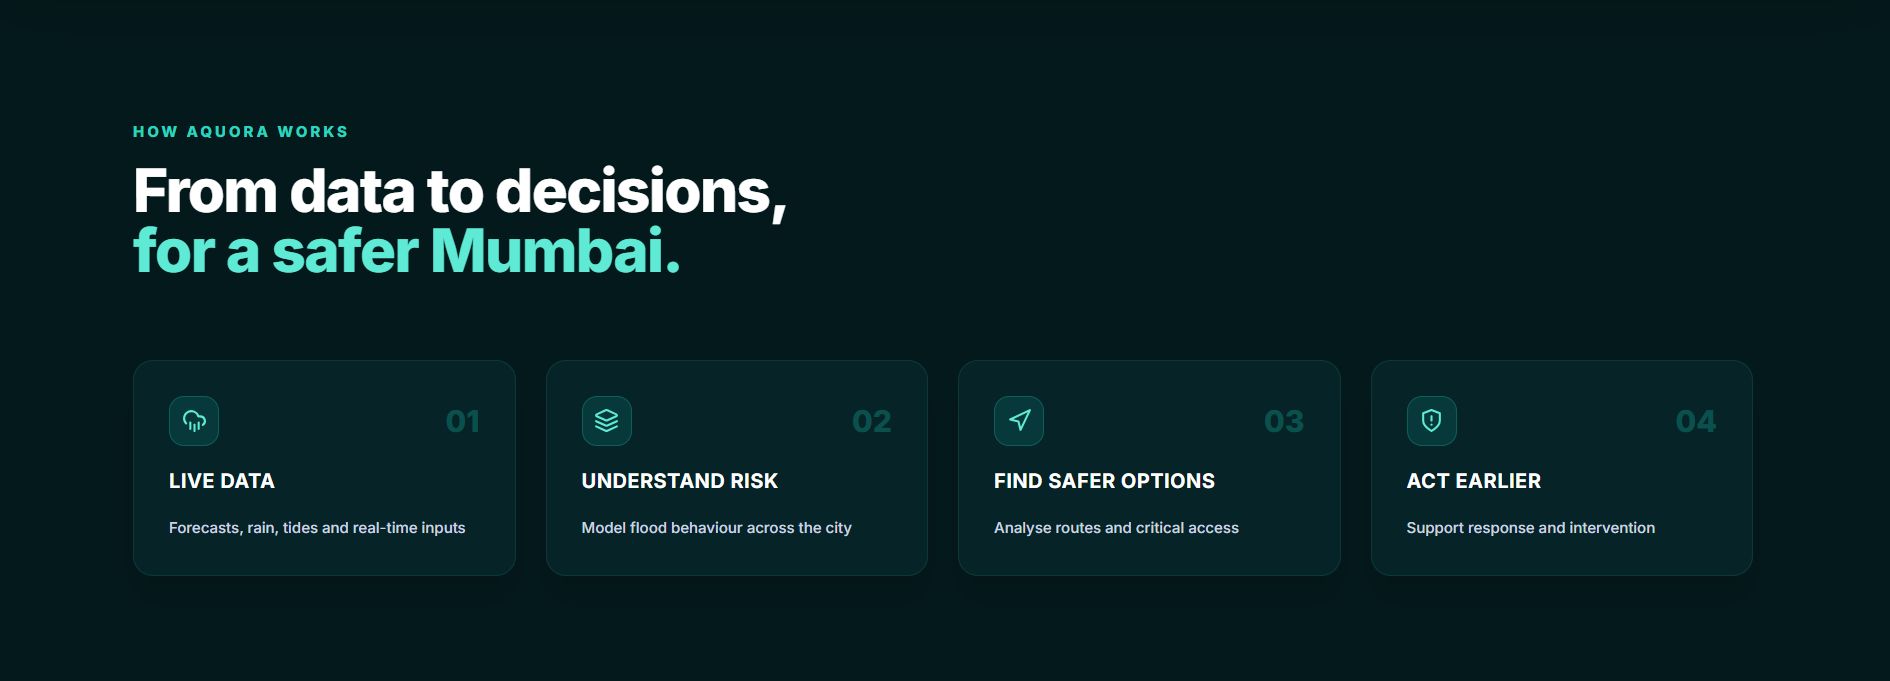
AQUORA — Urban Flood Intelligence & Response Platform is an end-to-end urban flood intelligence and decision-support platform designed to connect the complete operational chain:
Rainfall & Geospatial Data → Physical Flood Simulation → Future Flood Timeline → Route Exposure → Critical Access → Intervention Planning → Ground Observations → Explainable Alerts
Instead of presenting a single static flood-risk map, AQUORA builds a time-aware picture of how a flood situation can evolve and what parts of the urban system may be affected.
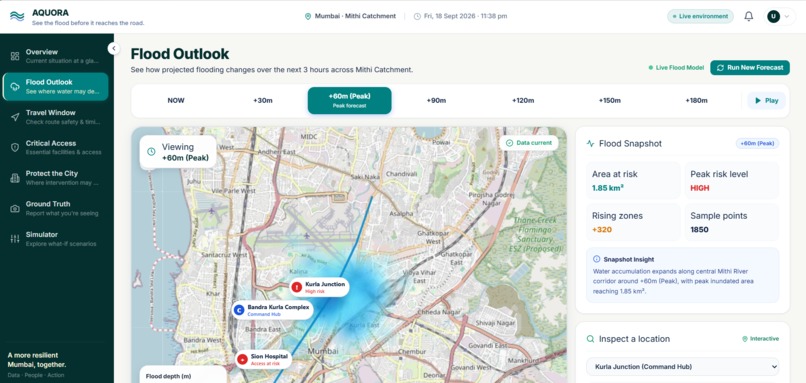
Its Digital Twin represents the modeled flood state through seven canonical time slices:
T+0 → T+30 → T+60 → T+90 → T+120 → T+150 → T+180 minutes
This allows an operator to inspect how modeled flood conditions change over time.
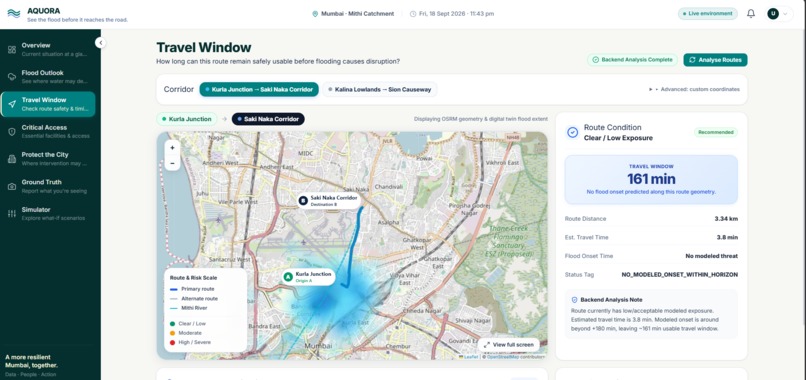
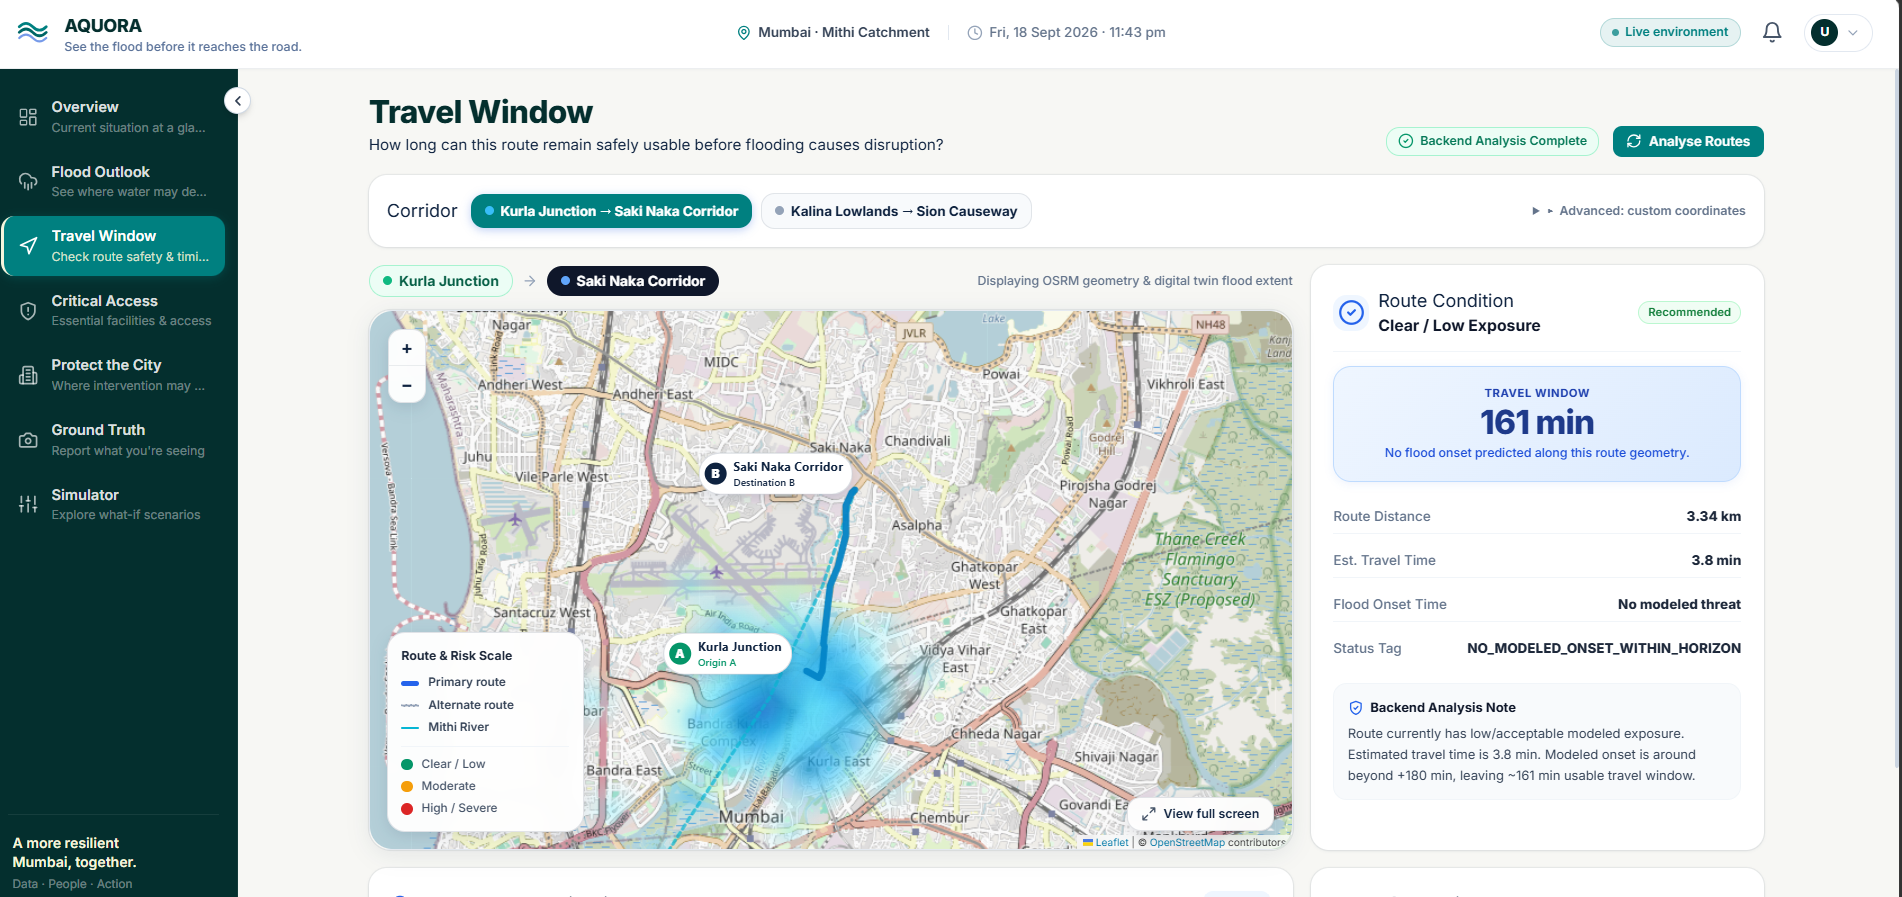
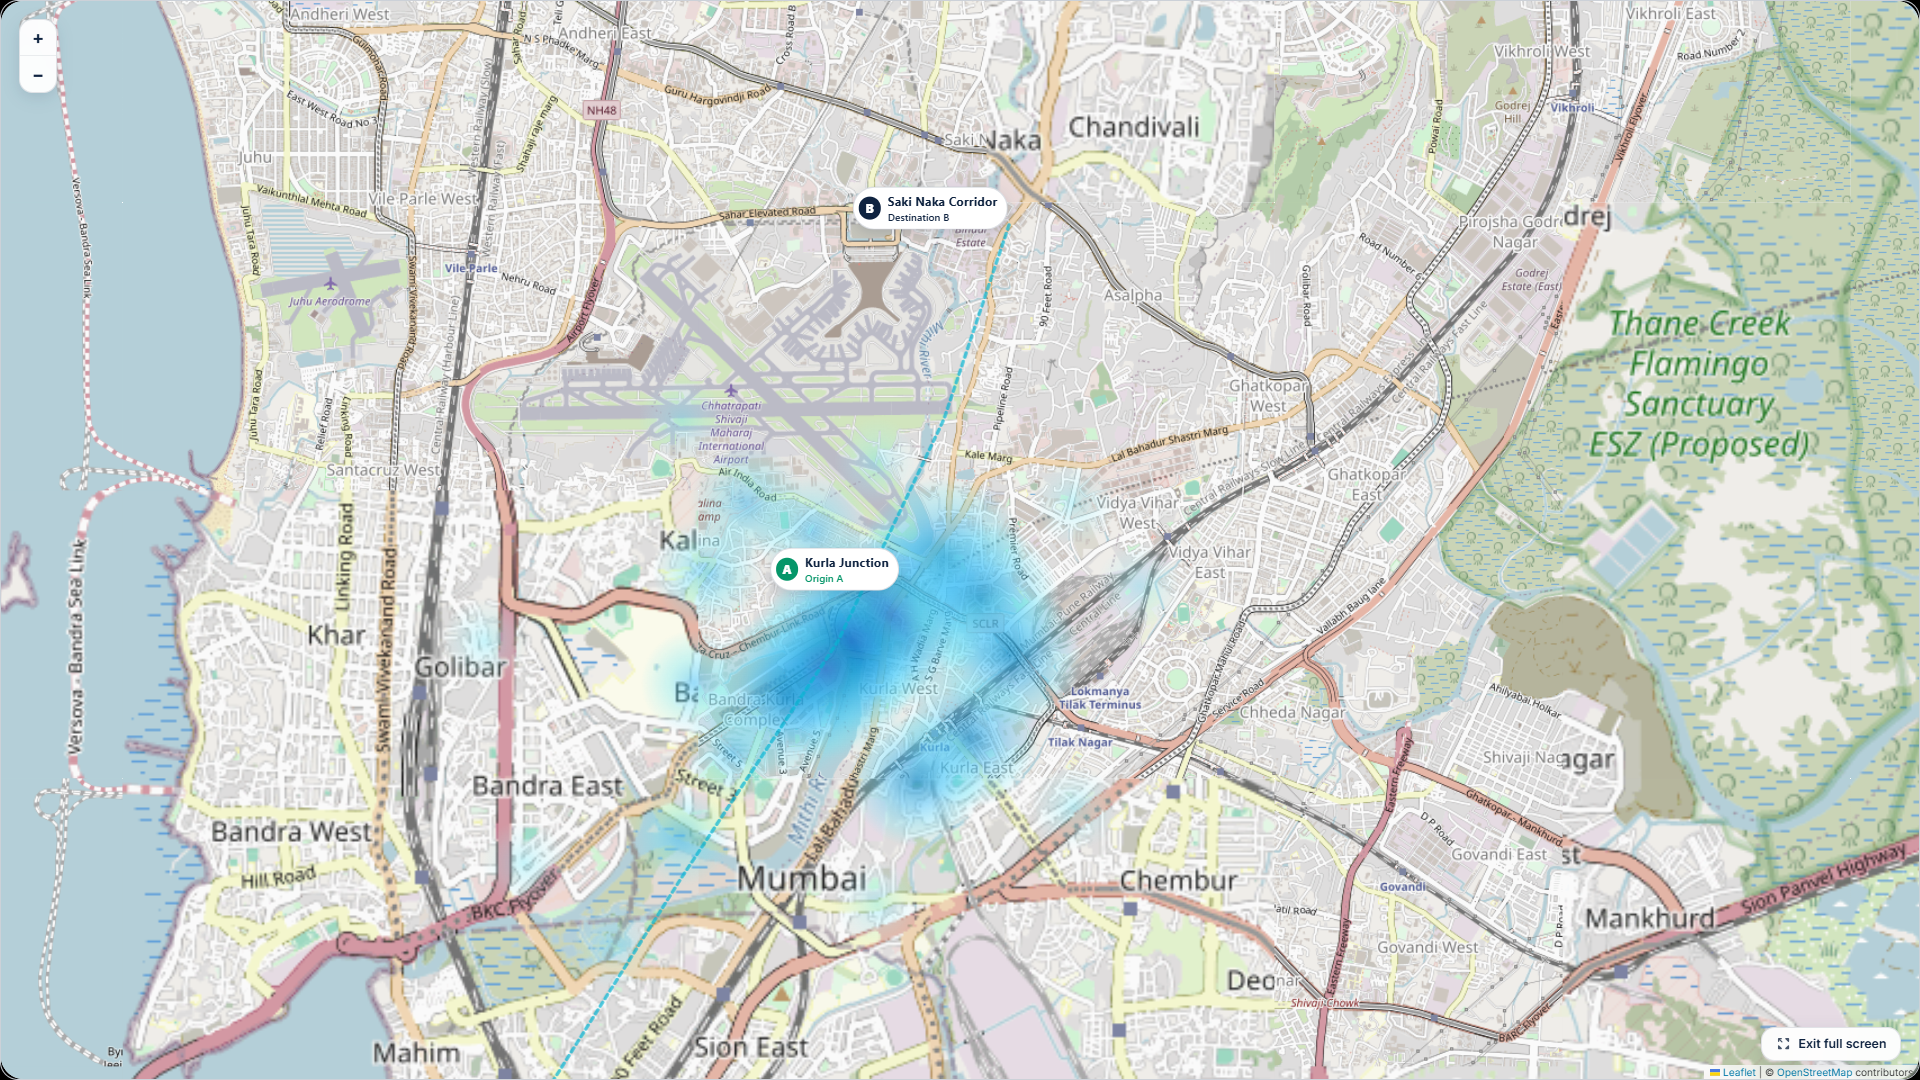
From the same modeled state, AQUORA can evaluate road exposure and calculate a usable travel window by considering flood onset, route travel time, and a safety buffer.
The platform also includes:
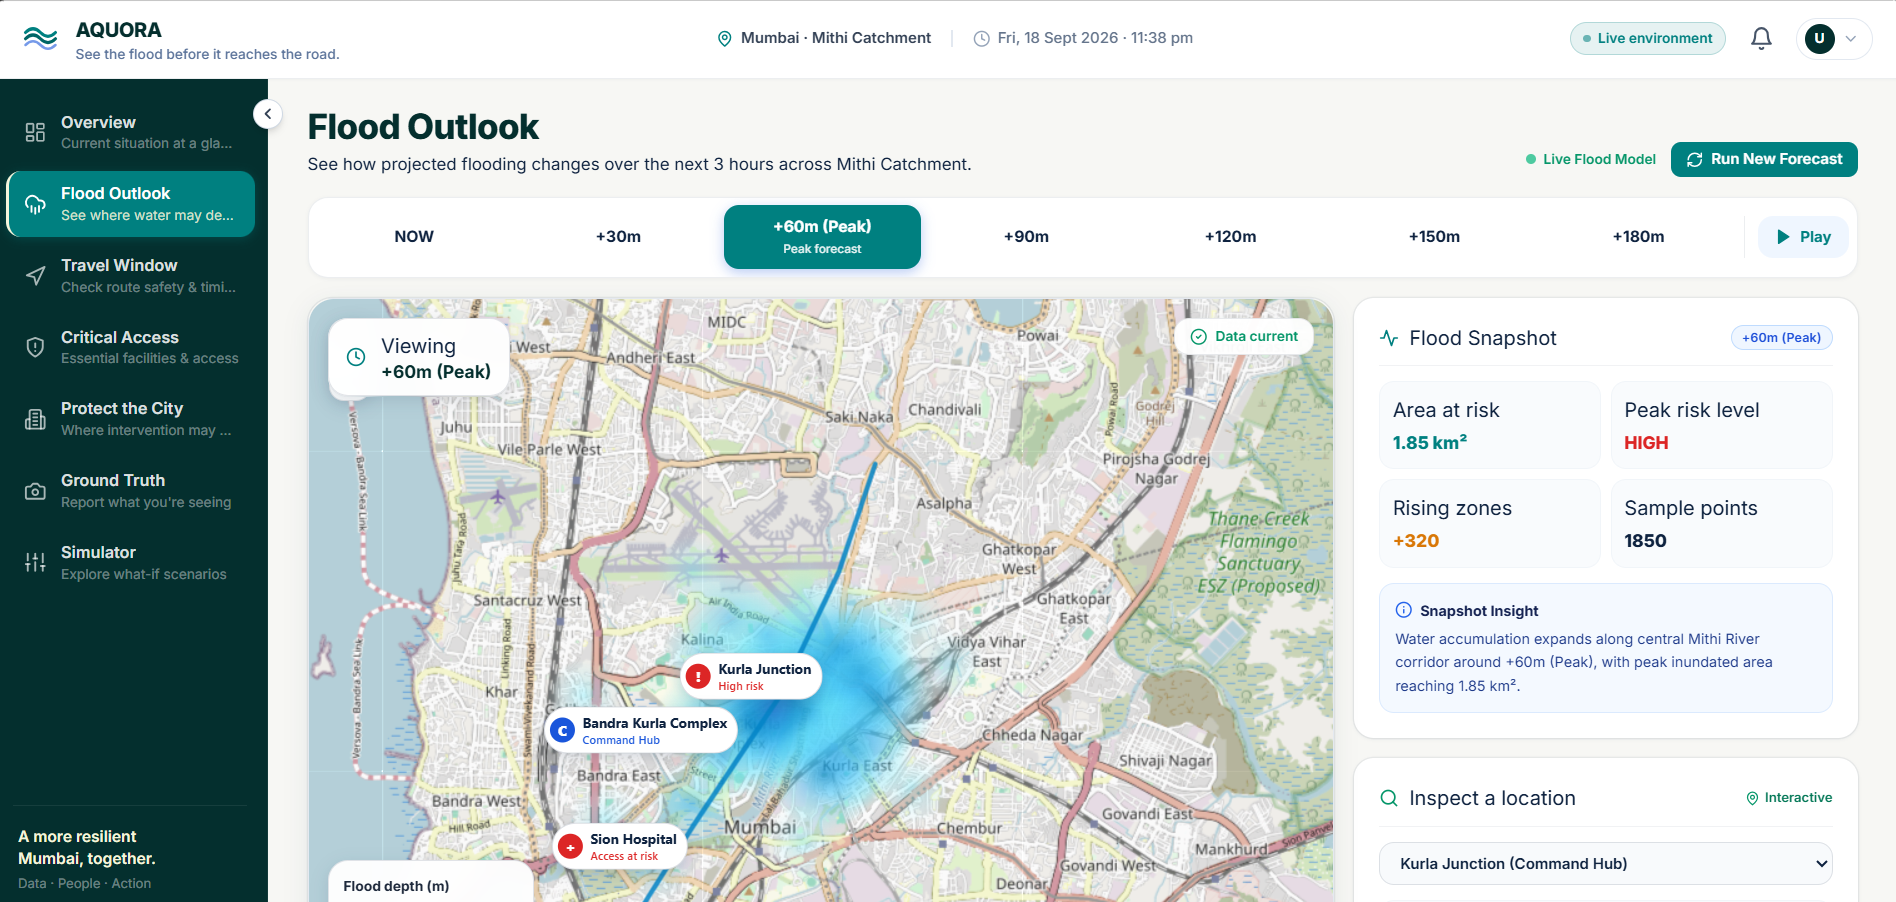
- 🗺️ Future Flood Digital Twin
- 🚗 Flood-Aware Routing / Travel Window
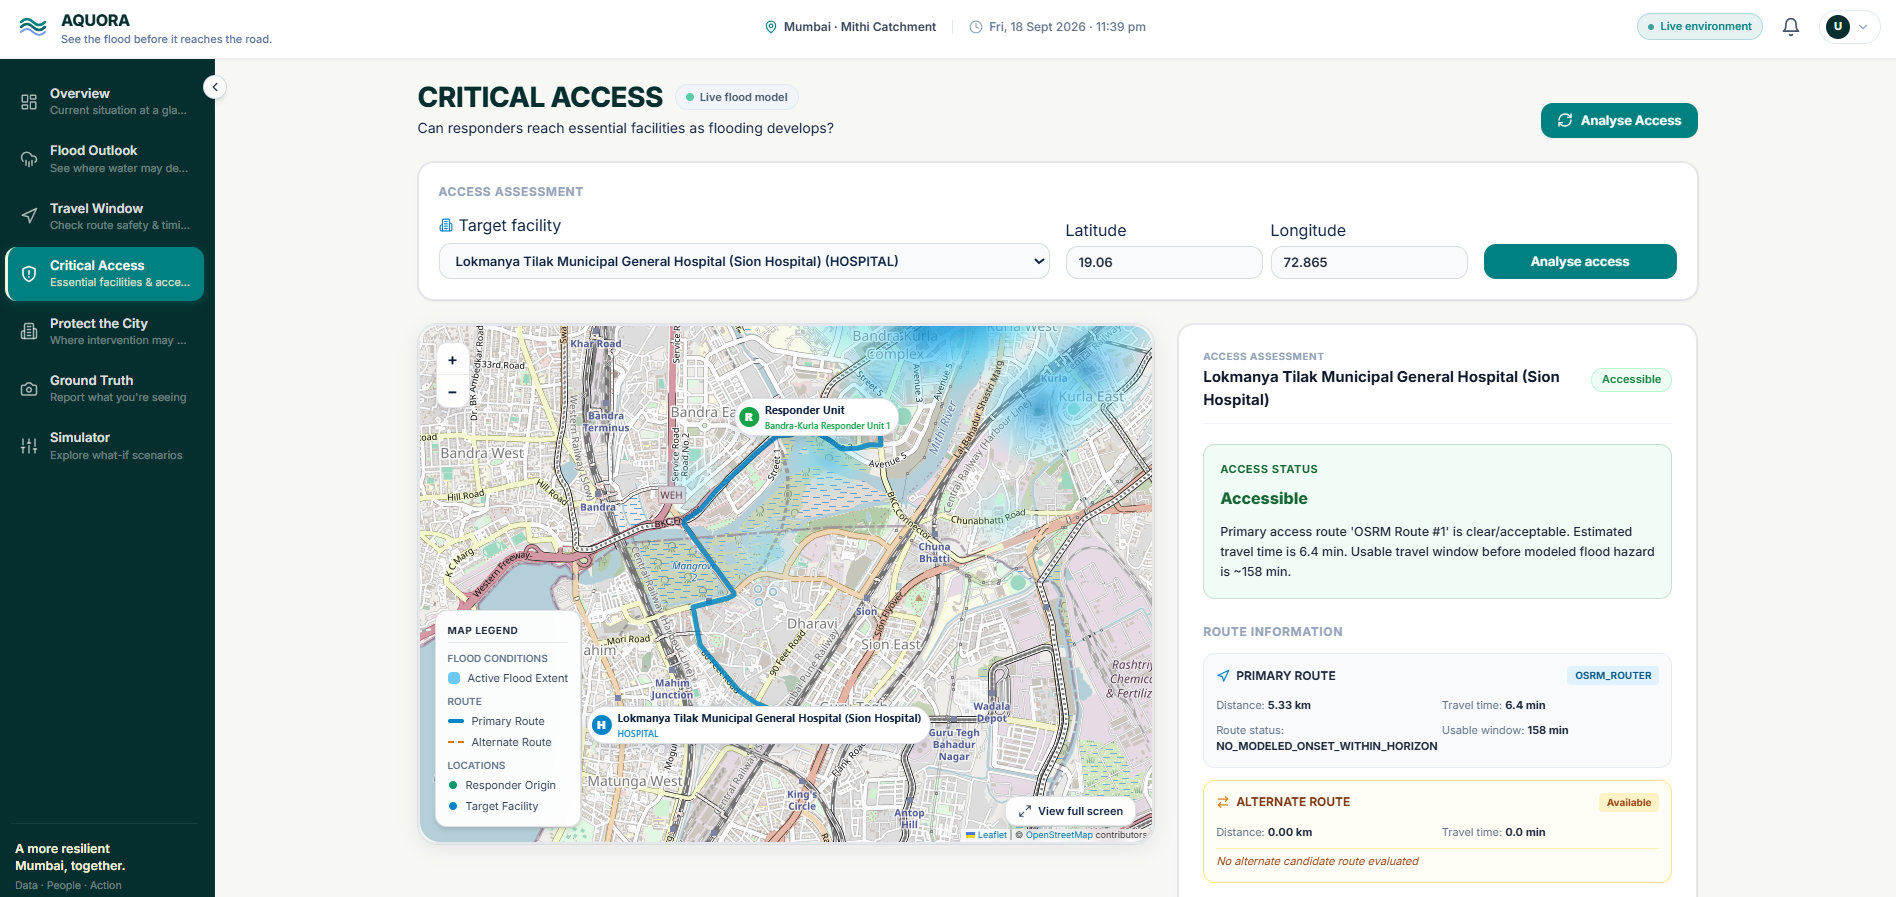
- 🏥 Critical Access Guardian
- 🏙️ Protect City
- 🔬 What-If Flood Simulator
- 📡 Ground Truth & Evidence Loop
- 🚨 Explainable Alert Center
- 🔍 Provenance and Auditability
This creates a much broader operational question than simply:
"Will this area flood?"
AQUORA is designed to help answer:
"Where, when, what is exposed, what can be done, and what evidence supports that decision?"
🧠 Our Key Differentiator: Physics First, ML Second
One of the most important design decisions we made was not to make a black-box ML model the authoritative flood solver.
AQUORA uses a deterministic, physics-based flood simulation engine as the authoritative physical layer.
The system uses terrain, rainfall, drainage-related information, surface characteristics, and flow relationships to model flood behavior.
The ML component is deliberately kept as an advisory/prototype calibration layer rather than replacing the physical model.
This separation makes the system easier to:
- inspect
- reproduce
- test
- diagnose
- explain
If something looks wrong, the physical state and its inputs can be investigated instead of treating an ML probability as an unexplained answer.
Our principle is:
Physics establishes the modeled flood state. ML assists calibration. Evidence helps validate and challenge the model.
🗺️ From Flood Maps to an Operational Digital Twin
AQUORA's Digital Twin is one of the central components of the platform.
Rather than showing only one predicted flood map, it produces a sequence of future modeled states:
T+0 → T+30 → T+60 → T+90 → T+120 → T+150 → T+180
The interactive map allows users to:
- move through future time slices
- inspect flood severity
- view time-specific metrics
- inspect individual cells
- investigate diagnostic information about modeled conditions
This time dimension enables downstream features to reason about flood onset and evolving exposure, rather than treating flooding as a static spatial problem.
The result is a shift from:
"Where is it flooded?"
to:
"How is the situation expected to evolve over the next three hours?"
🚗 Flood-Aware Routing & Critical Access
A flood forecast becomes much more useful when it is connected to mobility.
AQUORA evaluates route geometry against the time-indexed flood hazard and calculates a usable travel window:
Usable Travel Window = Flood Onset − Travel Time − Safety Buffer
The routing layer produces explainable states such as:
GO_NOWALTERNATE_RECOMMENDEDAVOIDUNKNOWN
The Critical Access Guardian extends this idea to important facilities and responder access.
Instead of only asking whether a facility itself is flooded, AQUORA evaluates whether access routes remain usable and whether alternate access may be required.
This allows the system to connect flood hazard with an important operational question:
Can people and essential services still reach where they need to go?
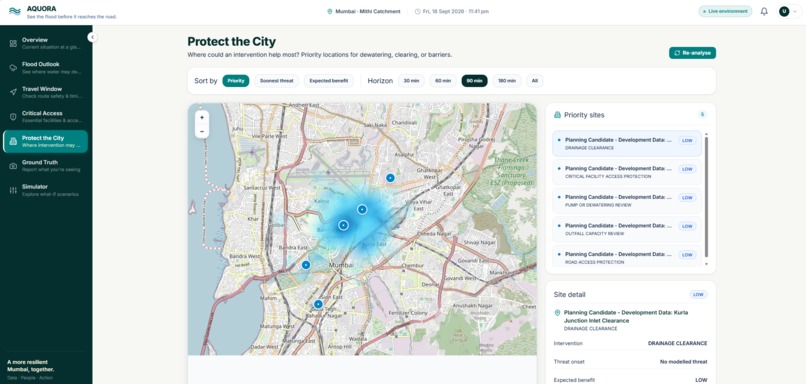
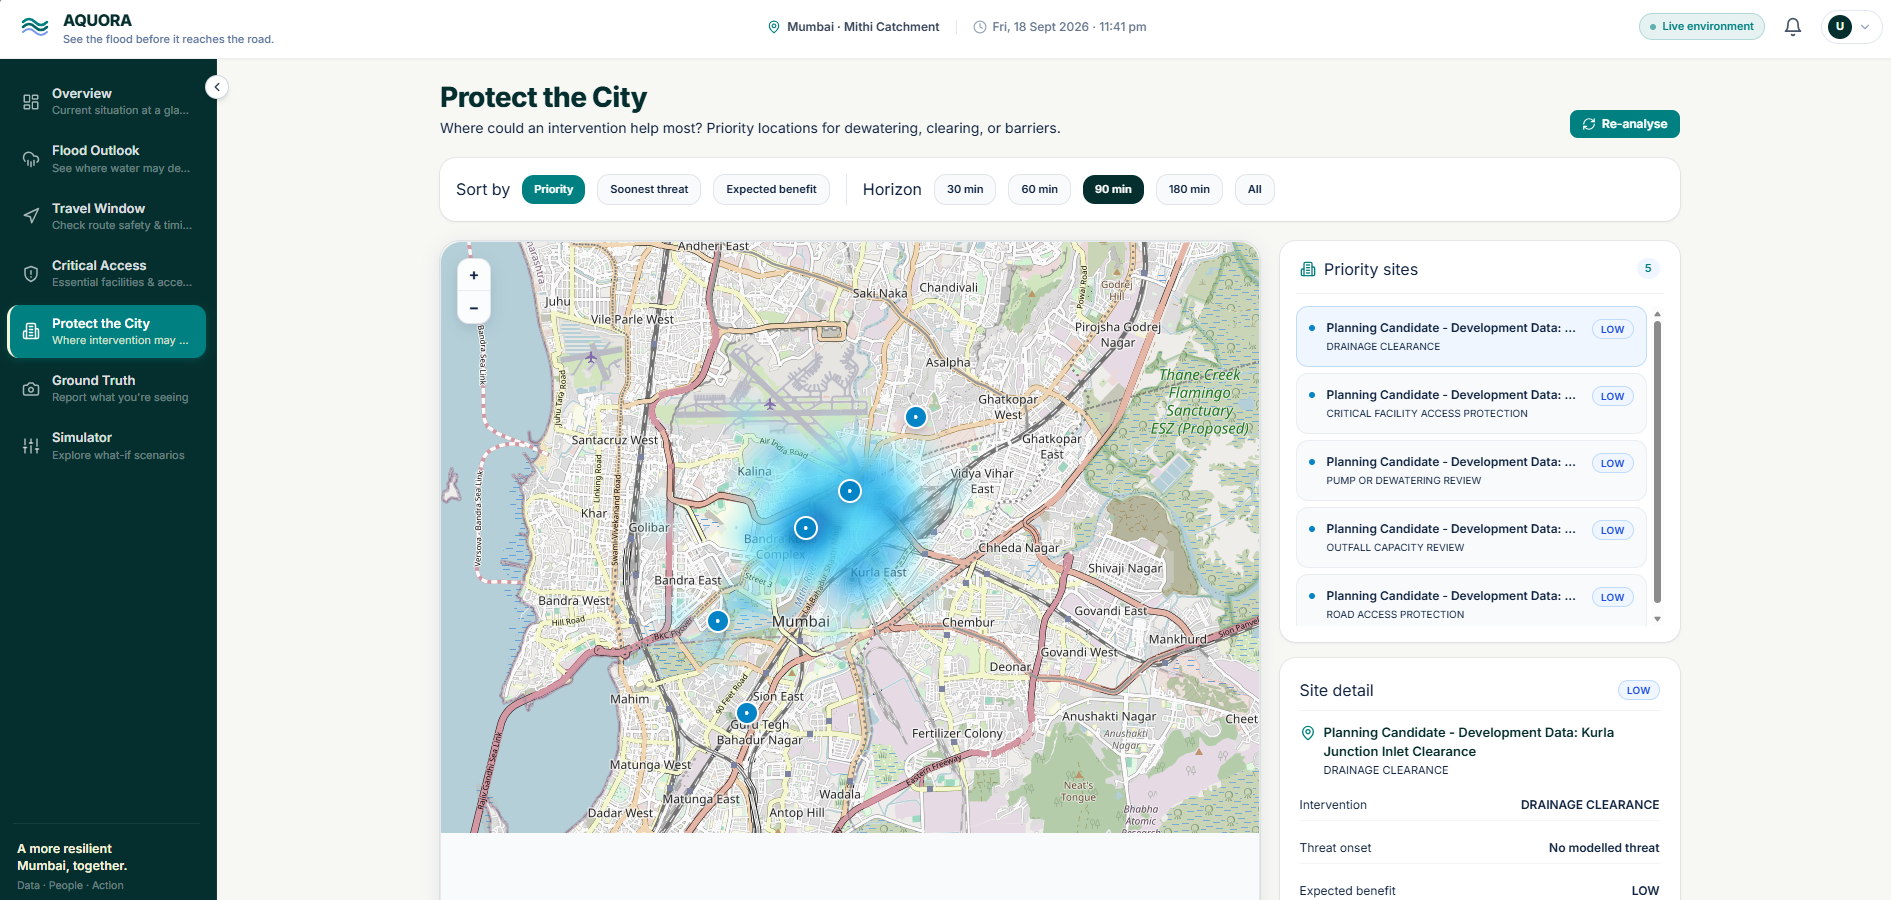
🏙️ Protect City: Turning Risk Into Intervention Planning
Another major component of AQUORA is Protect City, a decision-support layer for intervention prioritization.
It combines multiple factors, including:
- flood severity
- time-to-threat
- critical-facility access
- route exposure
- terrain and drainage context
- evidence completeness
The resulting intervention candidates include an explainable component breakdown rather than being presented as unexplained recommendations.
AQUORA also distinguishes between authoritative information, analytical outputs, and synthetic development data.
Importantly, intervention outputs are treated as planning candidates, not automatic municipal orders.
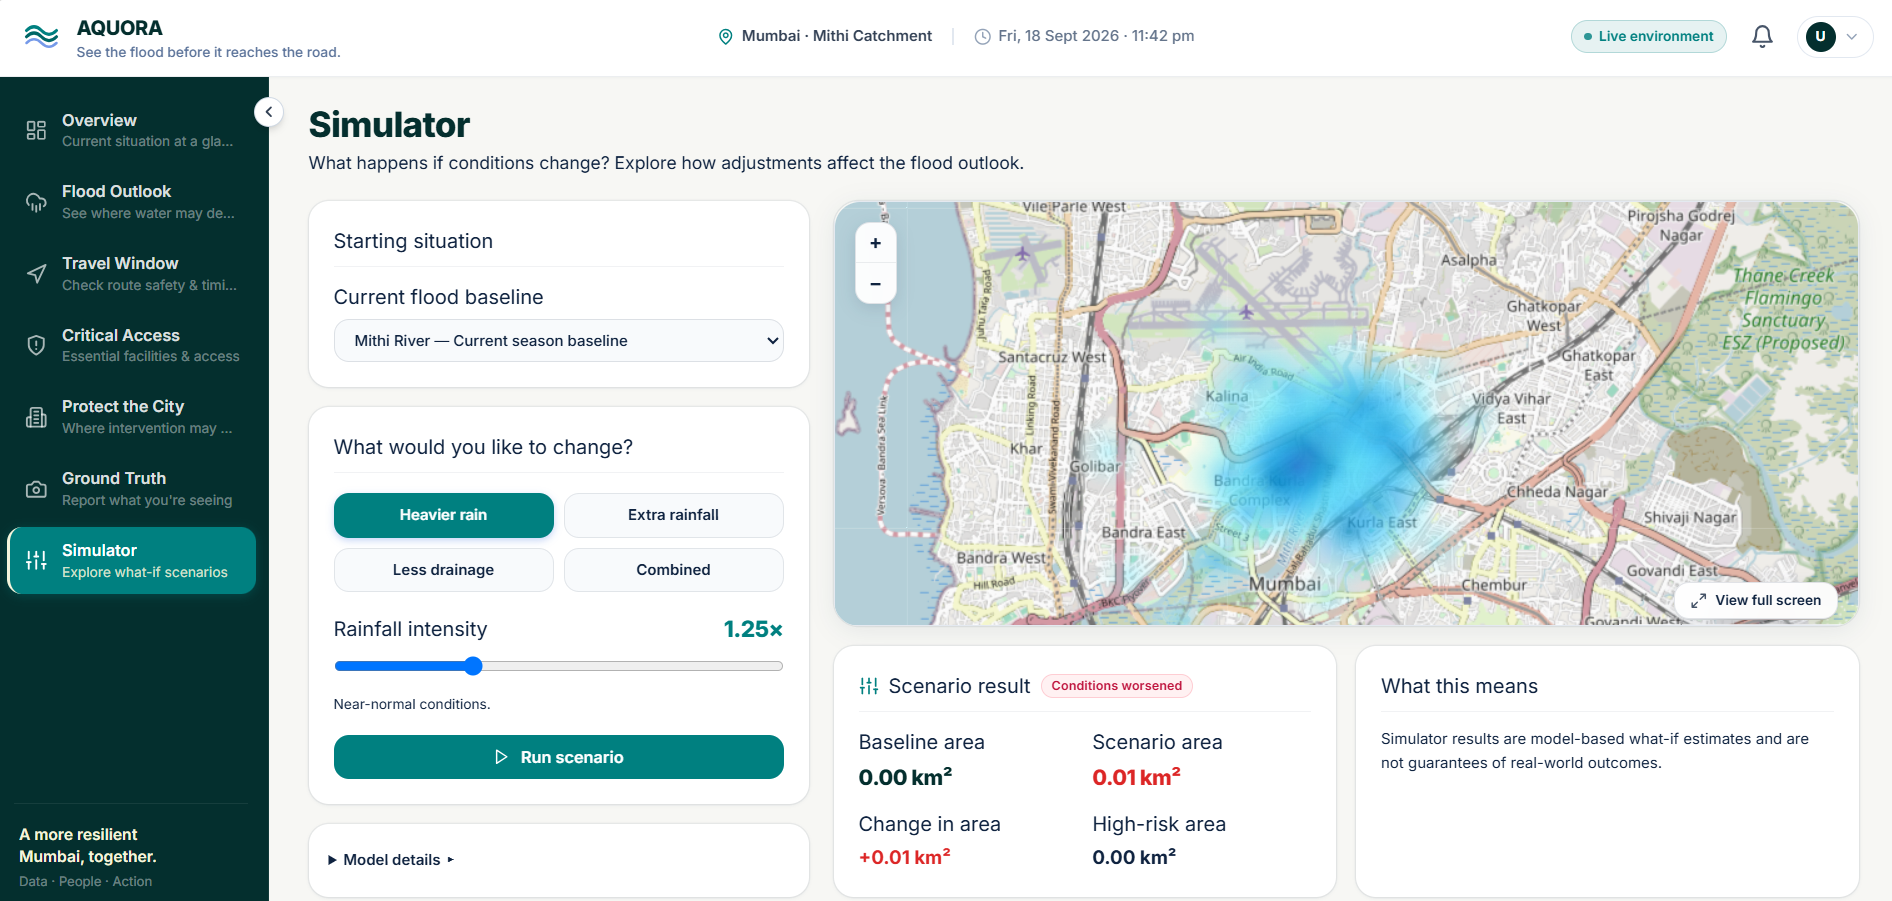
🔬 What-If Flood Simulator
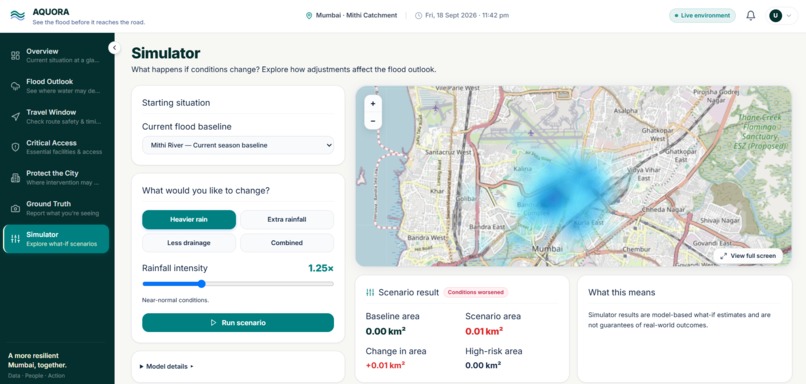
AQUORA allows an operator to explore what-if scenarios against an immutable baseline.
Supported scenario concepts include:
- rainfall multipliers
- additional rainfall
- drainage-capacity changes
- supported drainage interventions
- selected storage or barrier representations
The simulator does not create a second independent flood solver.
Instead, it reuses the authoritative physical simulation pathway and compares the scenario against the baseline.
Results can be compared using metrics such as:
- flooded area
- high/severe exposure
- peak depth
The system also avoids producing misleading results for interventions that the underlying physical model cannot faithfully represent.
Simulator results are model-based what-if estimates, not guarantees of real-world outcomes.
📡 Ground Truth: Predict → Observe → Compare → Learn
AQUORA closes the loop between modeled conditions and observations from the real world.
The Ground Truth layer allows observations and supporting media to be submitted and compared with model predictions.
We intentionally designed this conservatively.
A single report, photograph, or computer-vision score does not automatically become "truth."
Observations can remain unverified, be corroborated through additional evidence, or reach stronger confirmation when the required evidence exists.
The same principle applies to our flood-label pipeline.
When authoritative ground truth is unavailable, AQUORA preserves an:
UNKNOWN
state rather than manufacturing a flood/non-flood label.
For us, this became an important engineering principle:
Uncertainty is better than false certainty.
🚨 Explainable Alerts & Provenance
The Alert Center connects outputs from the different AQUORA modules without independently inventing new flood calculations.
Alerts can reference upstream:
- Digital Twin runs
- routing analyses
- critical-access analyses
- intervention analyses
- ground-truth observations
- simulator runs
Each alert follows a controlled lifecycle:
Generated → Acknowledged → Resolved
AQUORA also maintains cause-chain and audit information, allowing an operator to understand:
- why an alert exists
- which upstream analysis produced it
- what evidence supports it
- how its state changed over time
This makes the Alert Center more than a simple threshold-notification system.
🛠️ How We Built It
AQUORA is implemented as a modular application with an asynchronous worker architecture.
Frontend
- React
- TypeScript
- Vite
- MapLibre GL JS
Backend
- Python
- FastAPI
- Pydantic
- SQLAlchemy
- Alembic
Data & Infrastructure
- PostgreSQL
- PostGIS
- Redis
- GeoTIFF
- Parquet
- CSV scientific artifacts
Modeling & Geospatial Processing
- Deterministic D8-based physical flood modeling
- XGBoost / scikit-learn prototype ML calibration
- Raster and geospatial processing
- Route geometry and hazard intersection
- Time-indexed flood rasters
Data Sources & Providers
The platform uses a provider-oriented architecture incorporating sources such as:
- NASA GPM IMERG precipitation
- Open-Meteo / ECMWF forecast precipitation
- Copernicus DEM
- ESA WorldCover
- OpenStreetMap
- Sentinel-1 SAR evidence
- UHSLC tide observations
AQUORA explicitly separates real-data, modeled, observational, prototype, and synthetic/test data so development fixtures cannot silently masquerade as authoritative real-world information.
📊 Data Scale
Our Phase 7 production dataset contract contains:
- 1,306,144 master rows
- 7 historical rainfall events
- 186,592 spatial grid cells
- 30 m × 30 m computational grid
- 392 × 476 spatial grid
- 18 retained modeling features
The dataset pipeline also preserves event roles for training, validation, testing, and benchmarking.
An important part of our data engineering was maintaining provenance and refusing to fabricate labels where authoritative ground truth was unavailable.
🧪 Validation & Engineering Discipline
AQUORA was developed phase-by-phase with explicit boundaries between:
Physical Simulation → ML Calibration → Digital Twin → Routing → Critical Access → Intervention Analysis → Ground Truth → Simulation → Alerts
We built validation around:
- mass conservation
- runoff response
- D8 flow behavior
- deterministic repeatability
- data cardinality and uniqueness
- label semantics
- permanent-water handling
- API/database/UI consistency
- security boundaries
- synthetic-data isolation
- failure and degraded-state handling
The Phase 16 validation suite contains 7 test files and 20 targeted test functions, with all 20 passing in that validation run.
We also performed browser-level validation across the major application views and verified the operator journey across the platform.
🚧 Challenges We Faced
The hardest part was not building another map or another ML model.
It was making all the components work together without silently changing what an upstream model means.
1. Keeping Physics and ML Separate
It was tempting to let ML become the main prediction layer, but we wanted the physical simulation to remain authoritative and the ML component to remain explicitly advisory.
2. Working With Incomplete Ground Truth
Real flood labels are difficult to obtain consistently at high spatial resolution.
Instead of filling gaps with synthetic labels and presenting them as reality, we designed the pipeline to preserve UNKNOWN states.
3. Connecting Time, Space, and Operations
A flood raster alone does not tell an operator whether a route remains usable or whether a facility can still be reached.
We therefore built contracts that allow the same modeled state to feed routing, access analysis, interventions, and alerts.
4. Preventing Unsupported Physics From Becoming Fake Results
During simulator development, we encountered intervention types that the underlying physical engine could not faithfully represent.
Rather than producing misleading numbers, AQUORA explicitly marks unsupported scenarios as unsupported.
5. Maintaining Provenance Across the Entire Chain
Every downstream decision needs to be traceable to its source analysis.
This led us to build explicit run IDs, provenance metadata, audit records, and cause chains across the platform.
🎯 What We Learned
Our biggest lesson was that:
Flood intelligence is not just a prediction problem — it is a systems problem.
A useful flood platform has to connect:
Prediction + Time + Geography + Mobility + Critical Infrastructure + Intervention + Evidence + Communication
We also learned that scientific integrity is a product feature.
Knowing when to say:
"unknown" · "prototype" · "modeled" · "unsupported"
is just as important as producing a prediction.
That principle shaped AQUORA from the beginning.
🚀 What's Next
AQUORA's architecture is designed to extend beyond the initial Mithi River pilot.
Future development can include:
- stronger calibrated hydrodynamics
- richer verified ground-truth datasets
- broader municipal infrastructure layers
- additional cities and catchments
- improved intervention models
- deeper integration with emergency-management workflows
Our long-term vision is to make AQUORA a reusable urban flood intelligence layer that can transform heterogeneous environmental data into transparent, time-aware, evidence-backed decisions.
🌍 Our Vision
Most flood systems stop at:
"Here is the flood map."
AQUORA is built around what comes next:
"When will it happen?"
"What will it affect?"
"Can people still move?"
"Which critical facilities may lose access?"
"What intervention could be explored?"
"What are people actually observing?"
"Why did the system generate this alert?"
That is the problem AQUORA is built to solve.
From prediction to preparedness. From maps to decisions.
Built With
- copernicus-dem
- ecmwf
- esa-worldcover
- fastapi
- geopandas
- maplibre-gl-js
- nasa-gpm-imerg
- numpy
- open-meteo
- openstreetmap
- pandas
- postgis
- postgresql
- python
- rasterio
- react
- redis
- scikit-learn
- sentinel-1
- typescript
- vite
- xgboost

Log in or sign up for Devpost to join the conversation.