-
-
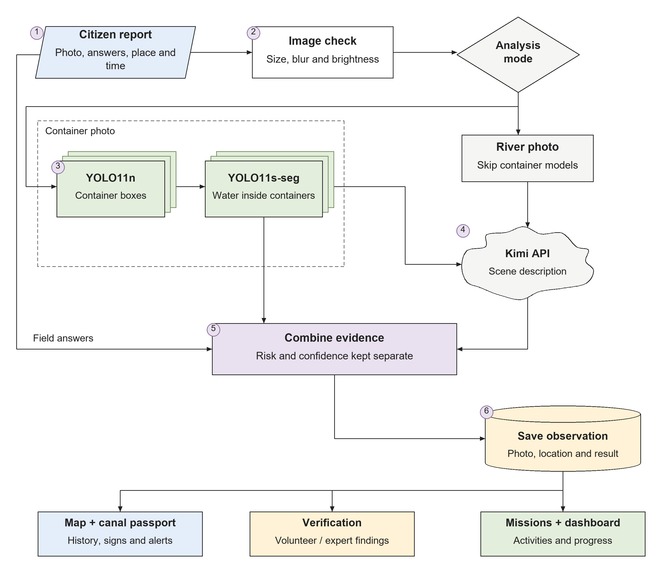
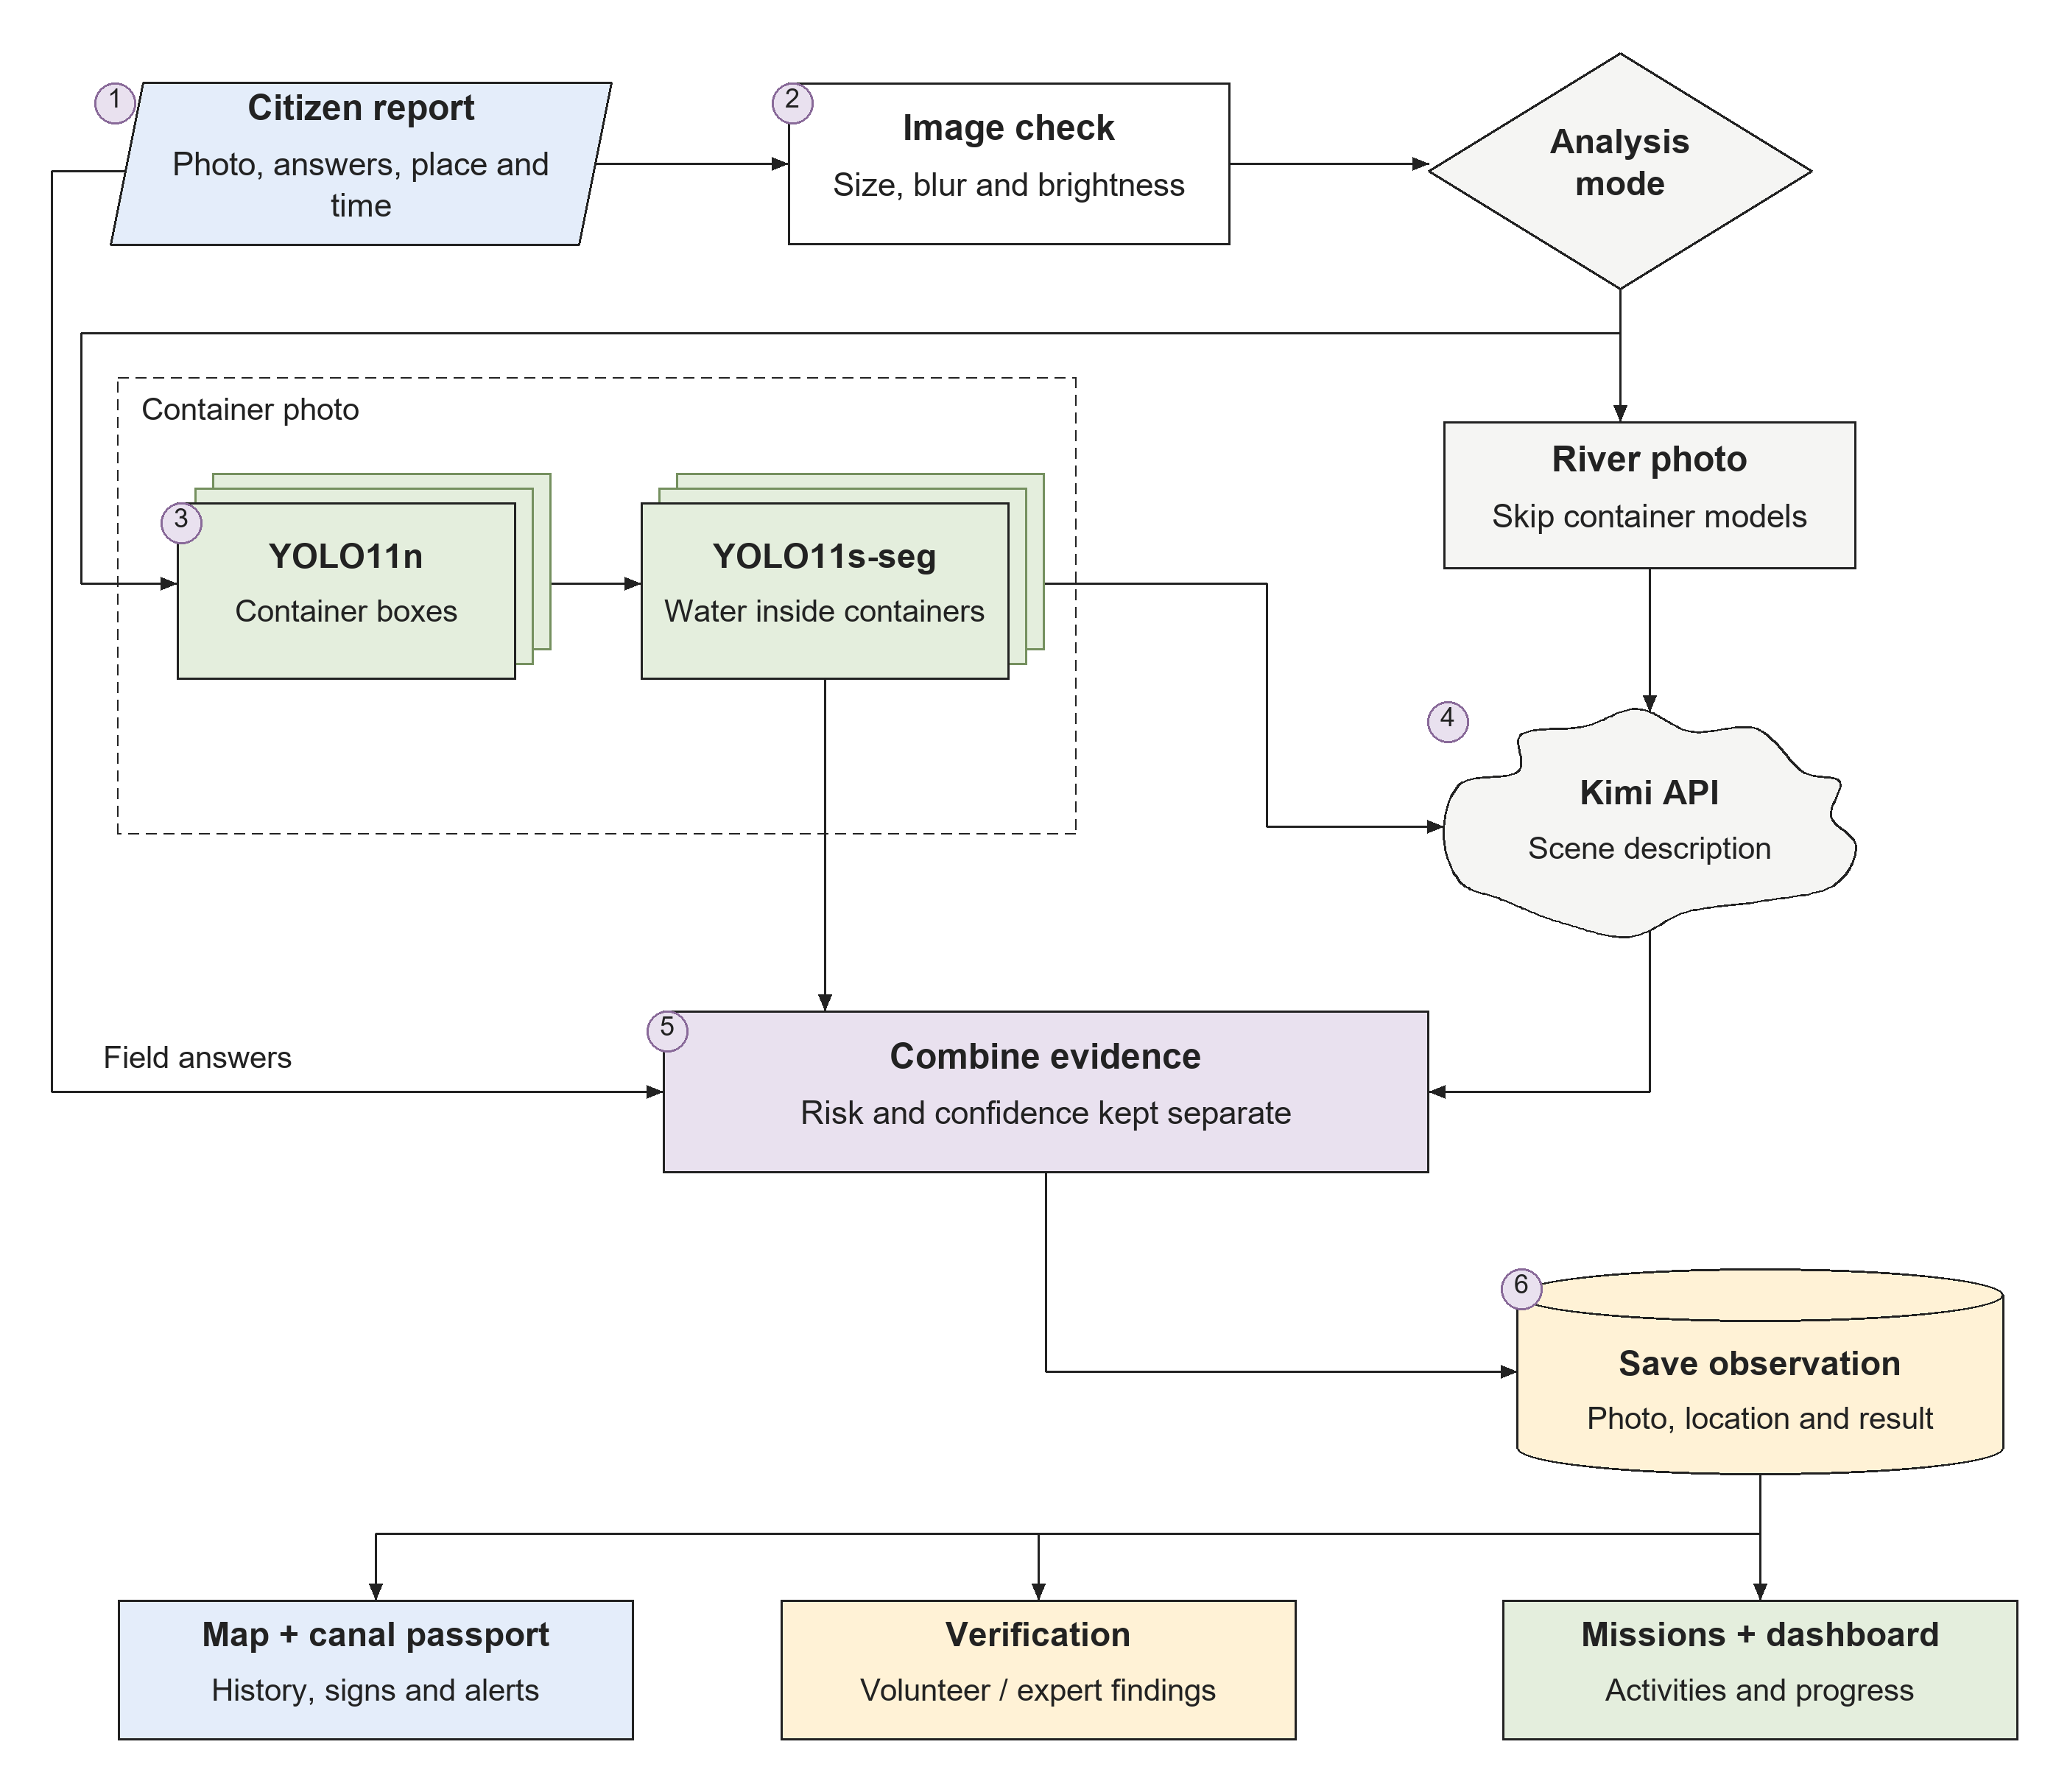
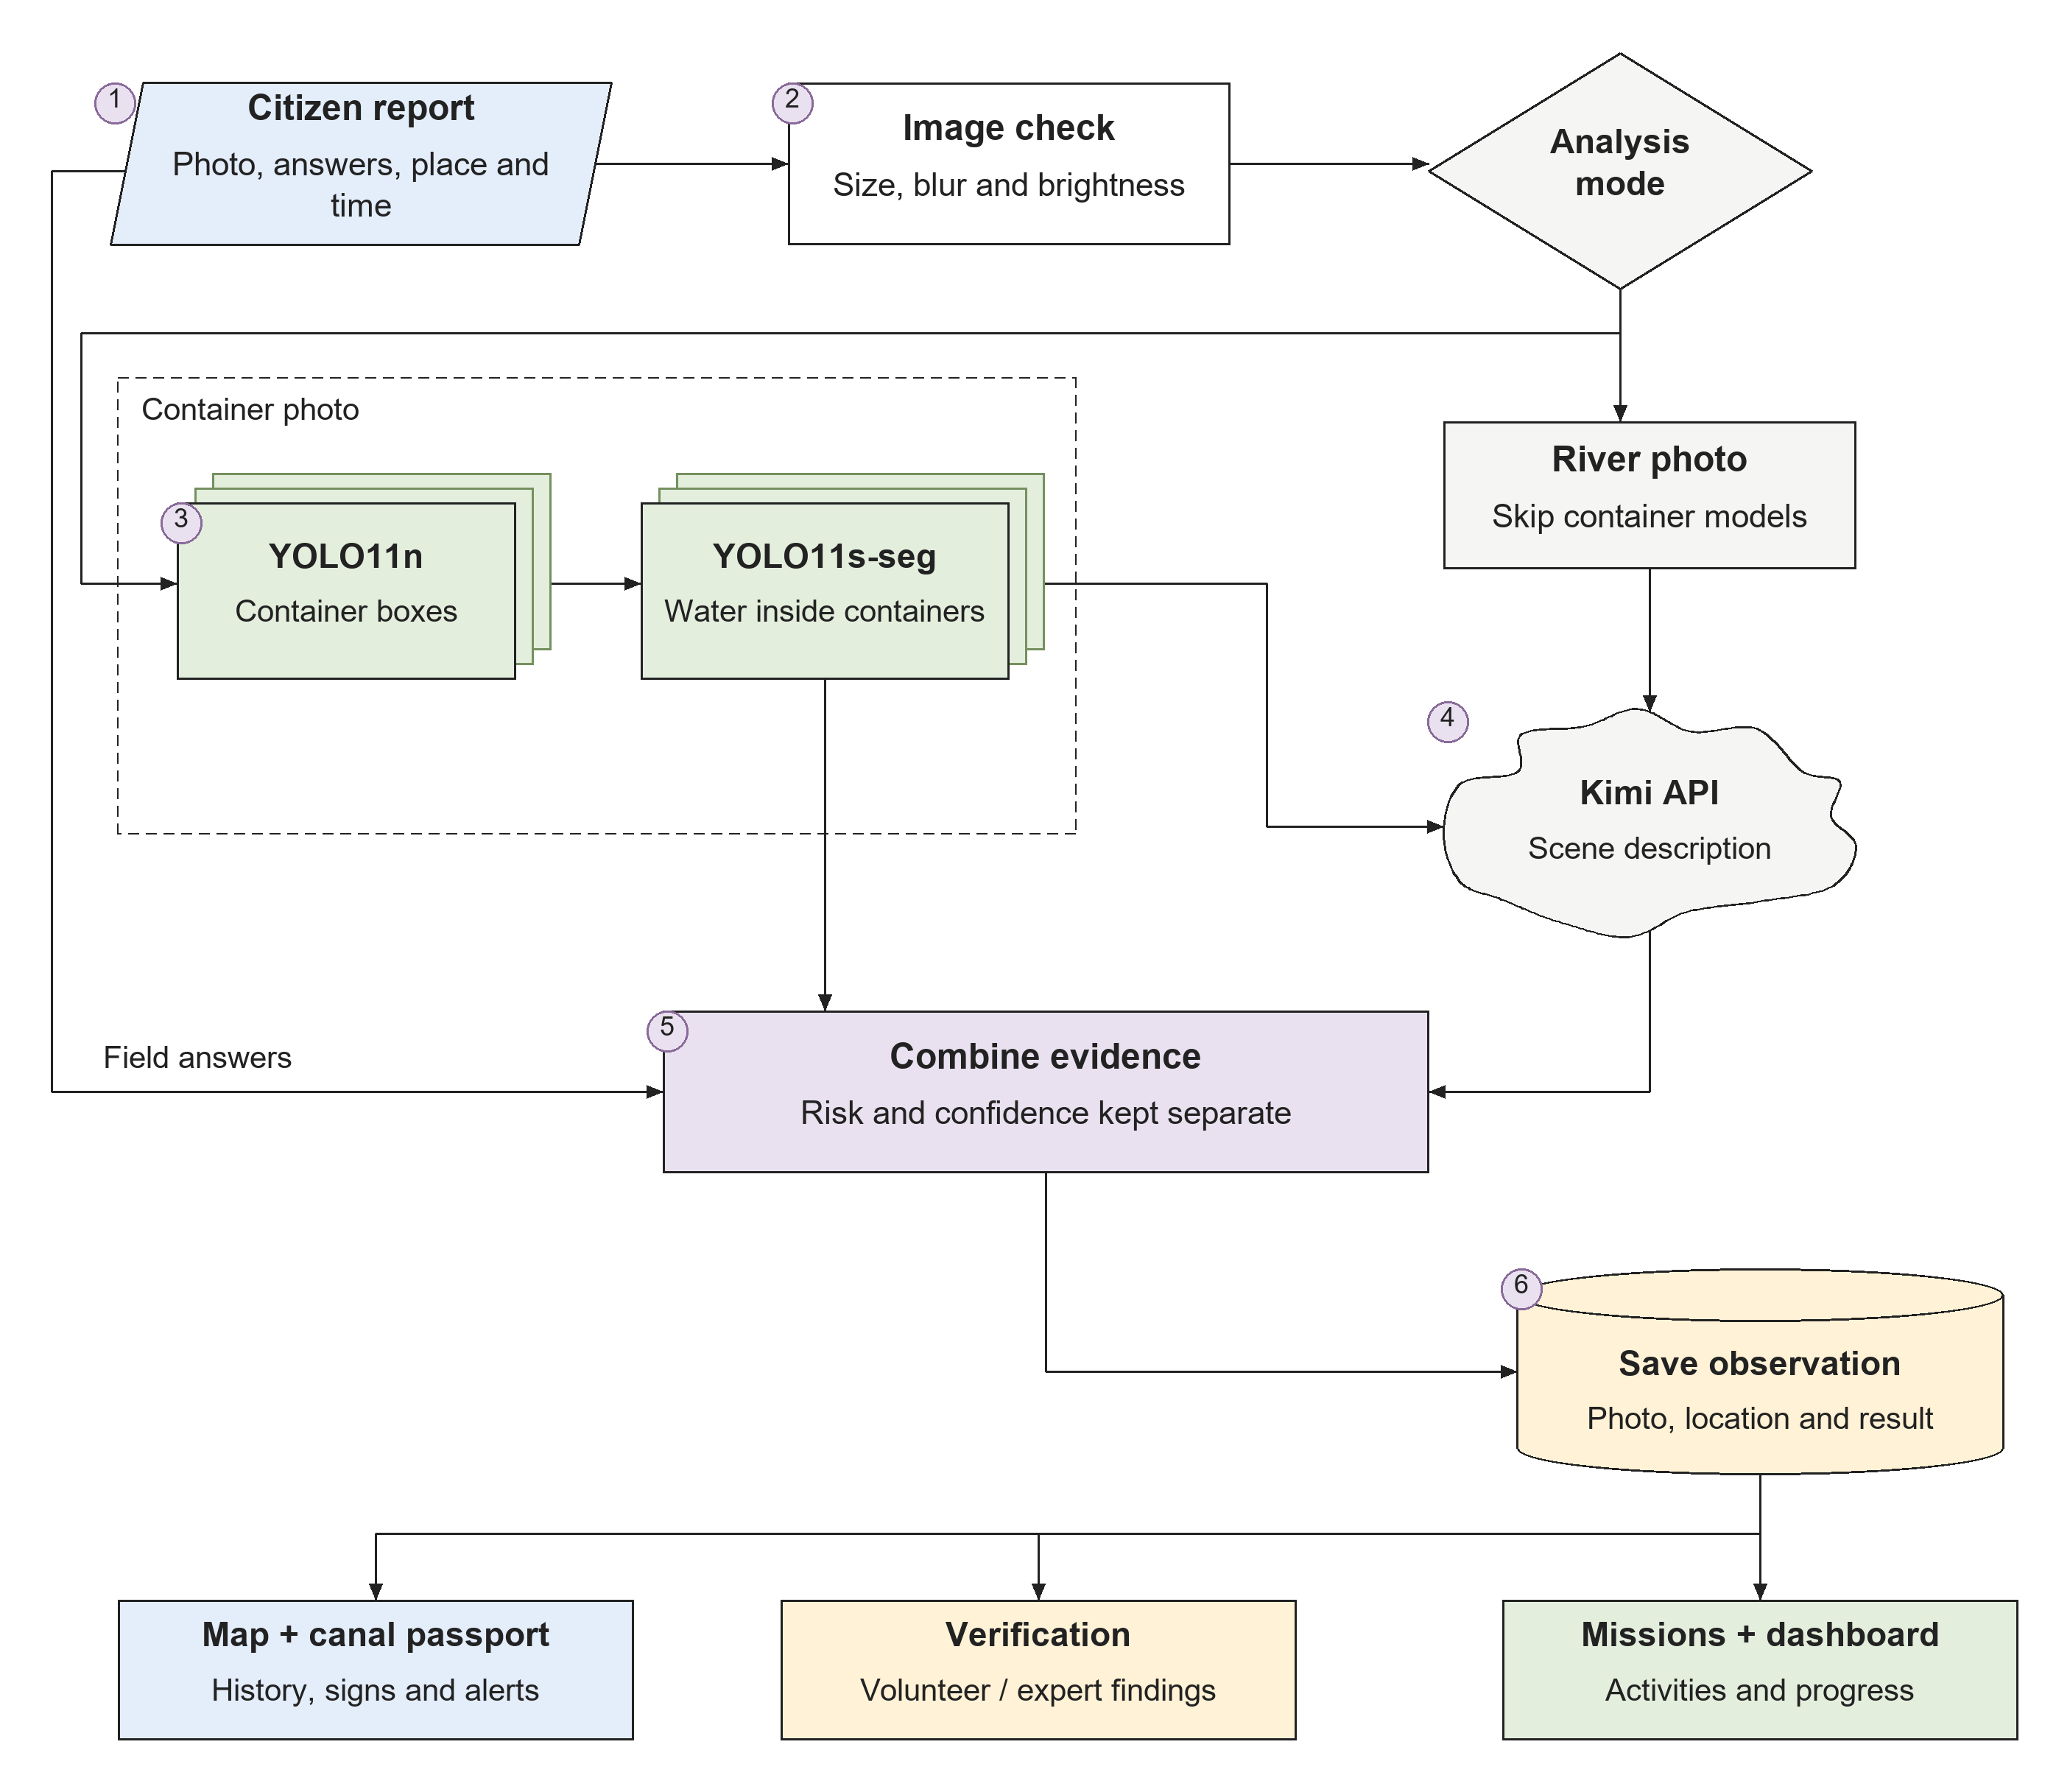
Observation workflow: From a citizen’s photo and answers to analysis, a saved report, and follow-up actions.
-
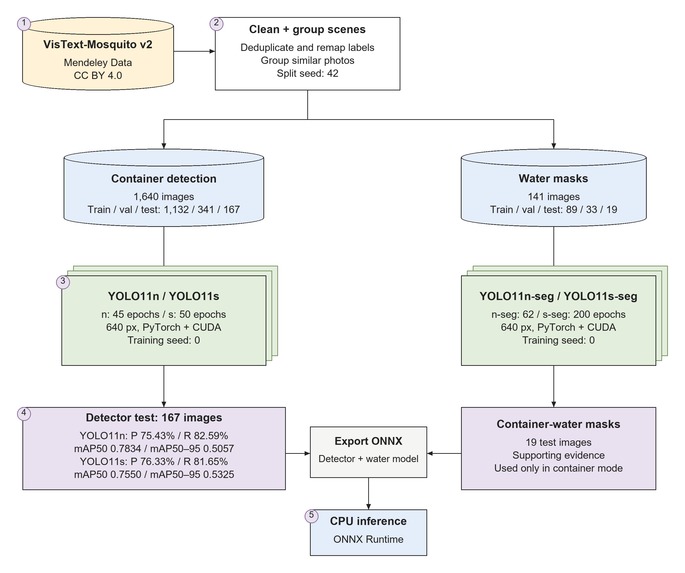
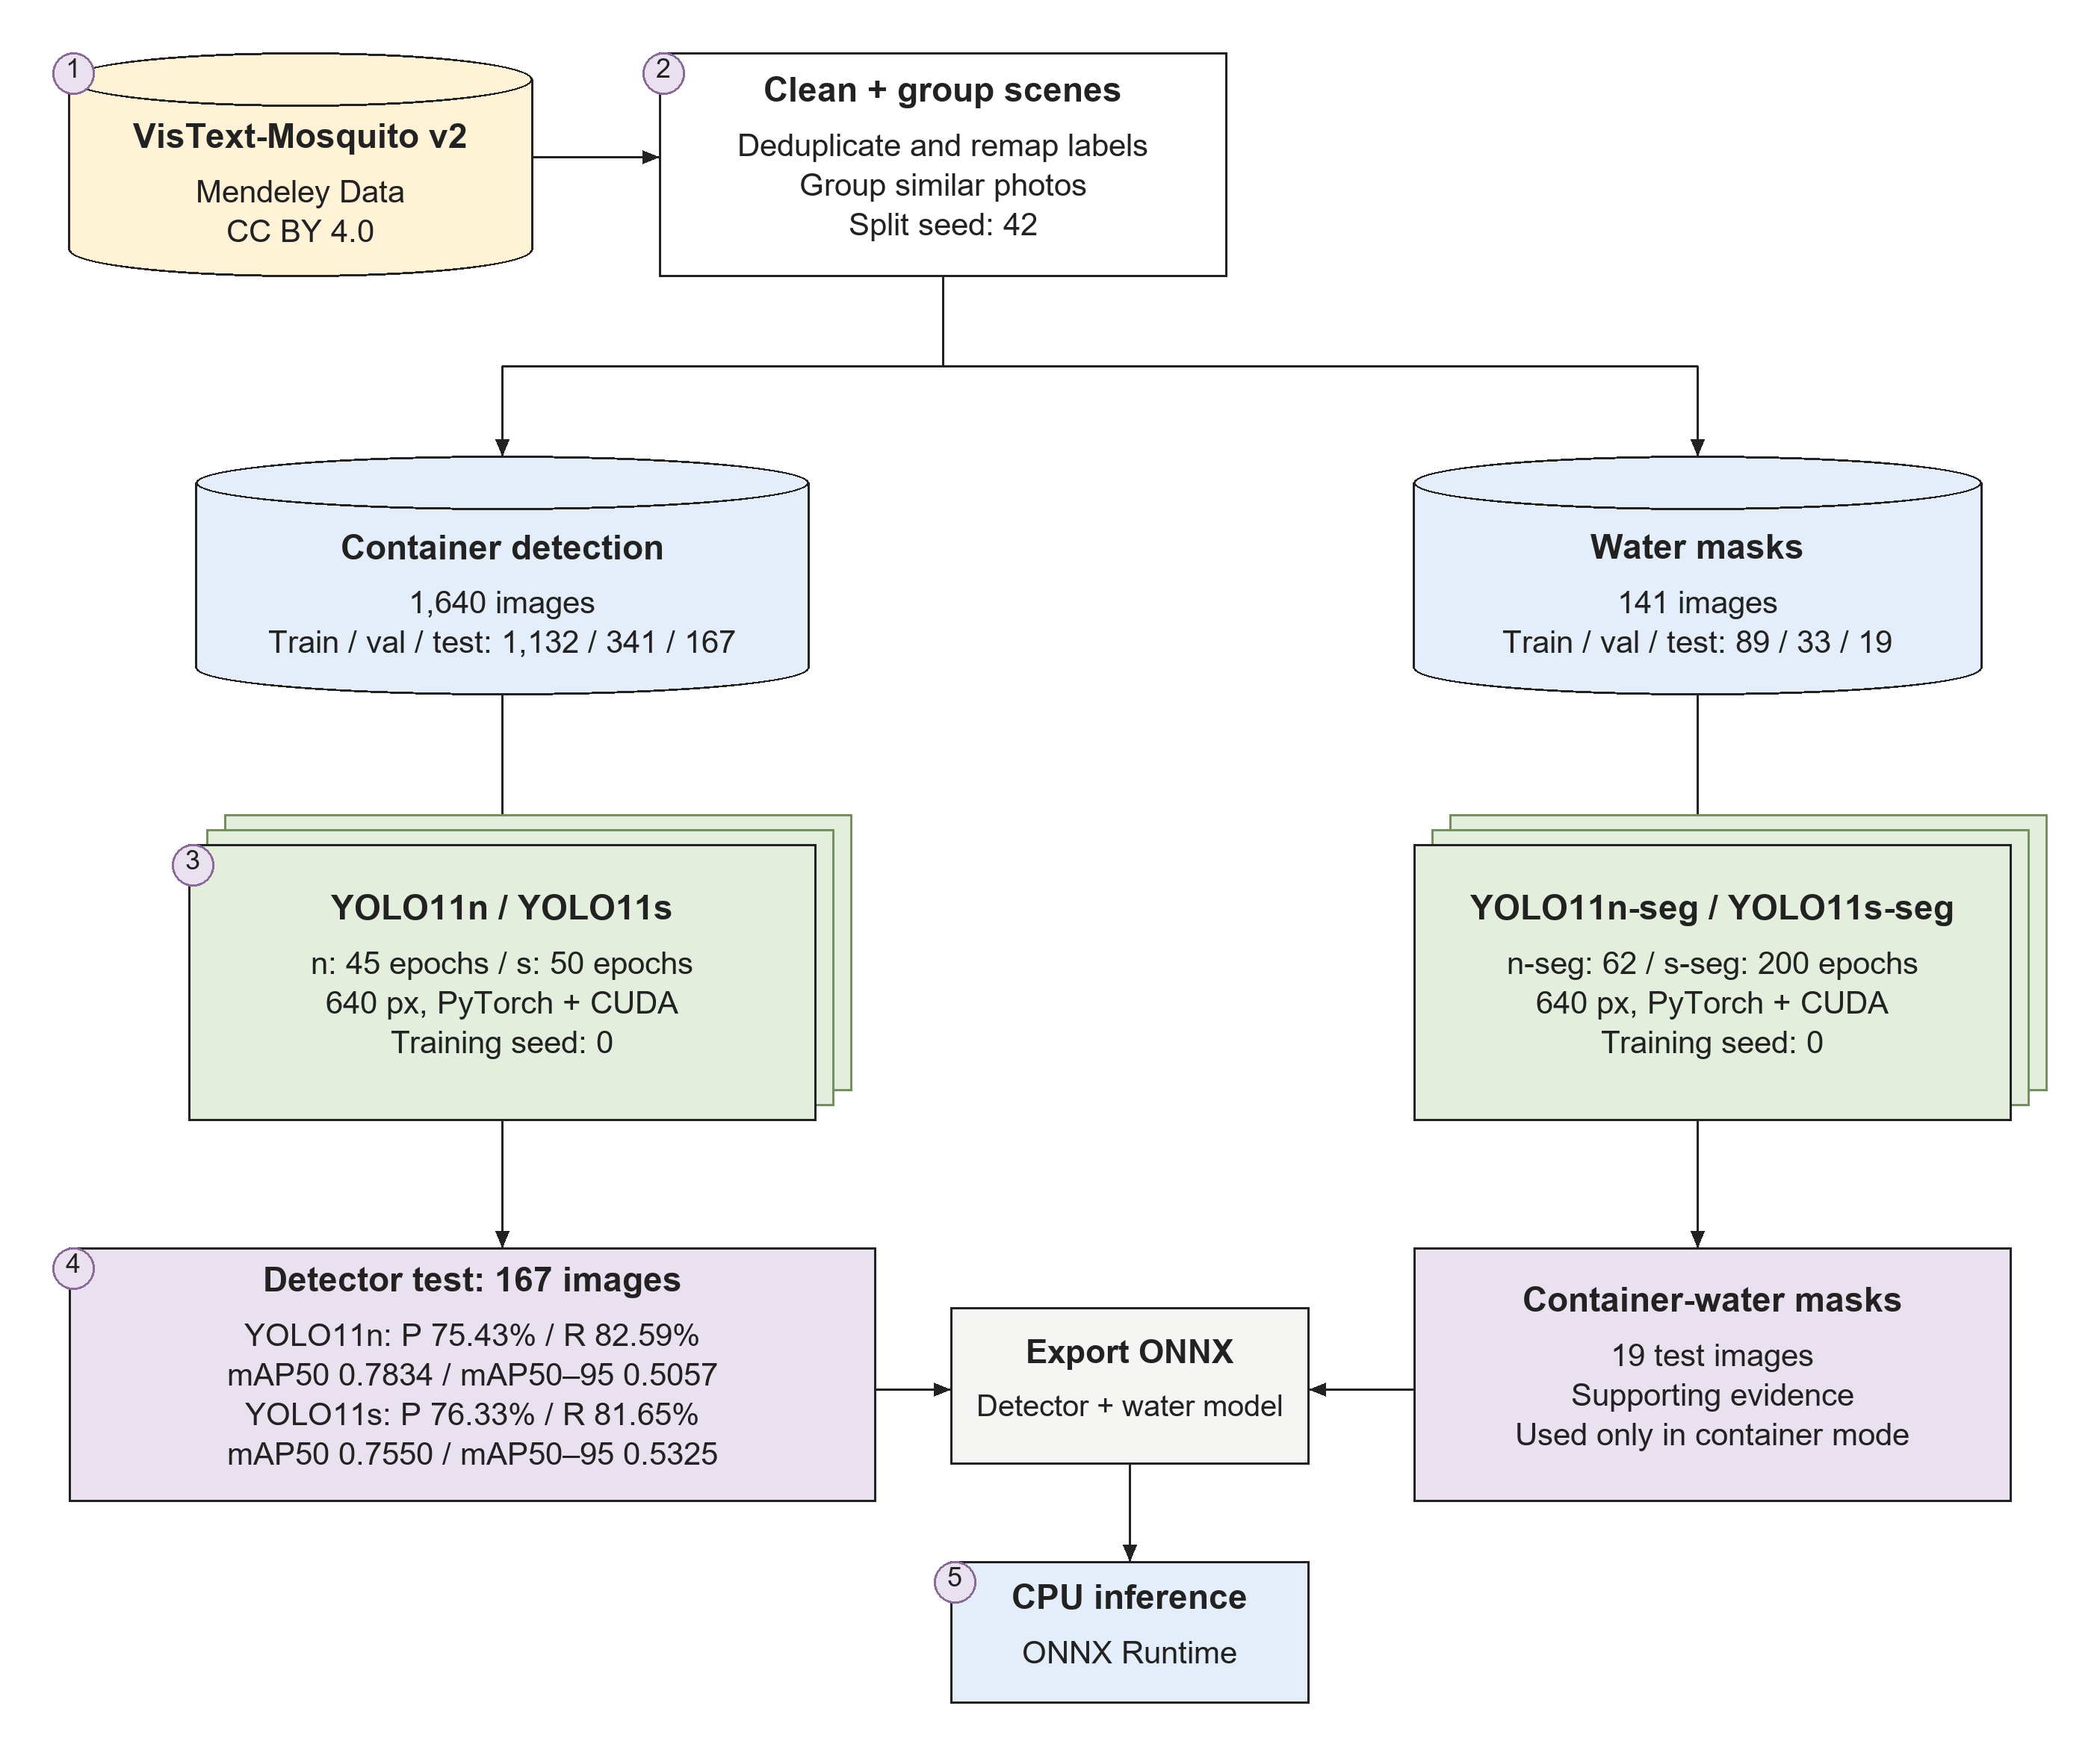
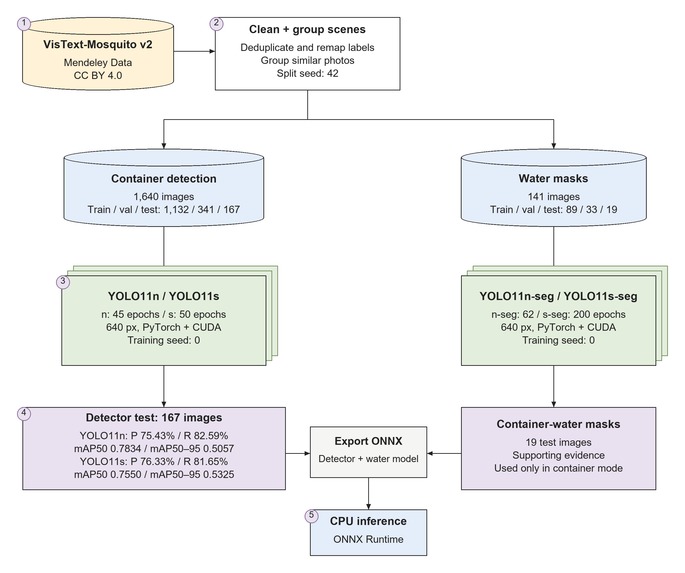
Training and evaluation: Preparing data, training models, testing results, and exporting ONNX files.
-
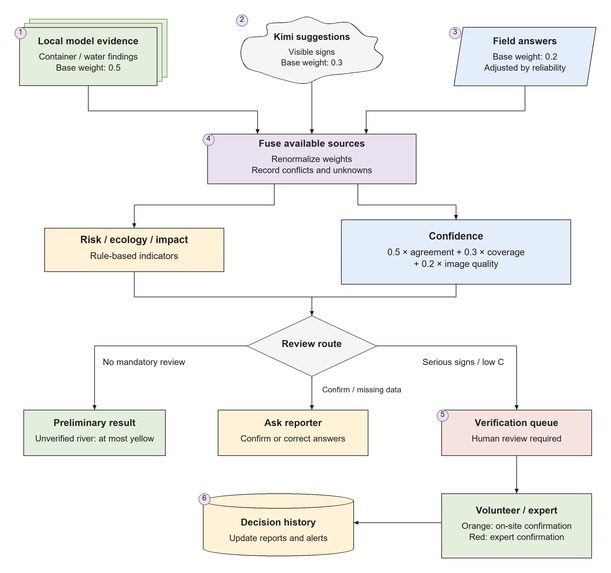
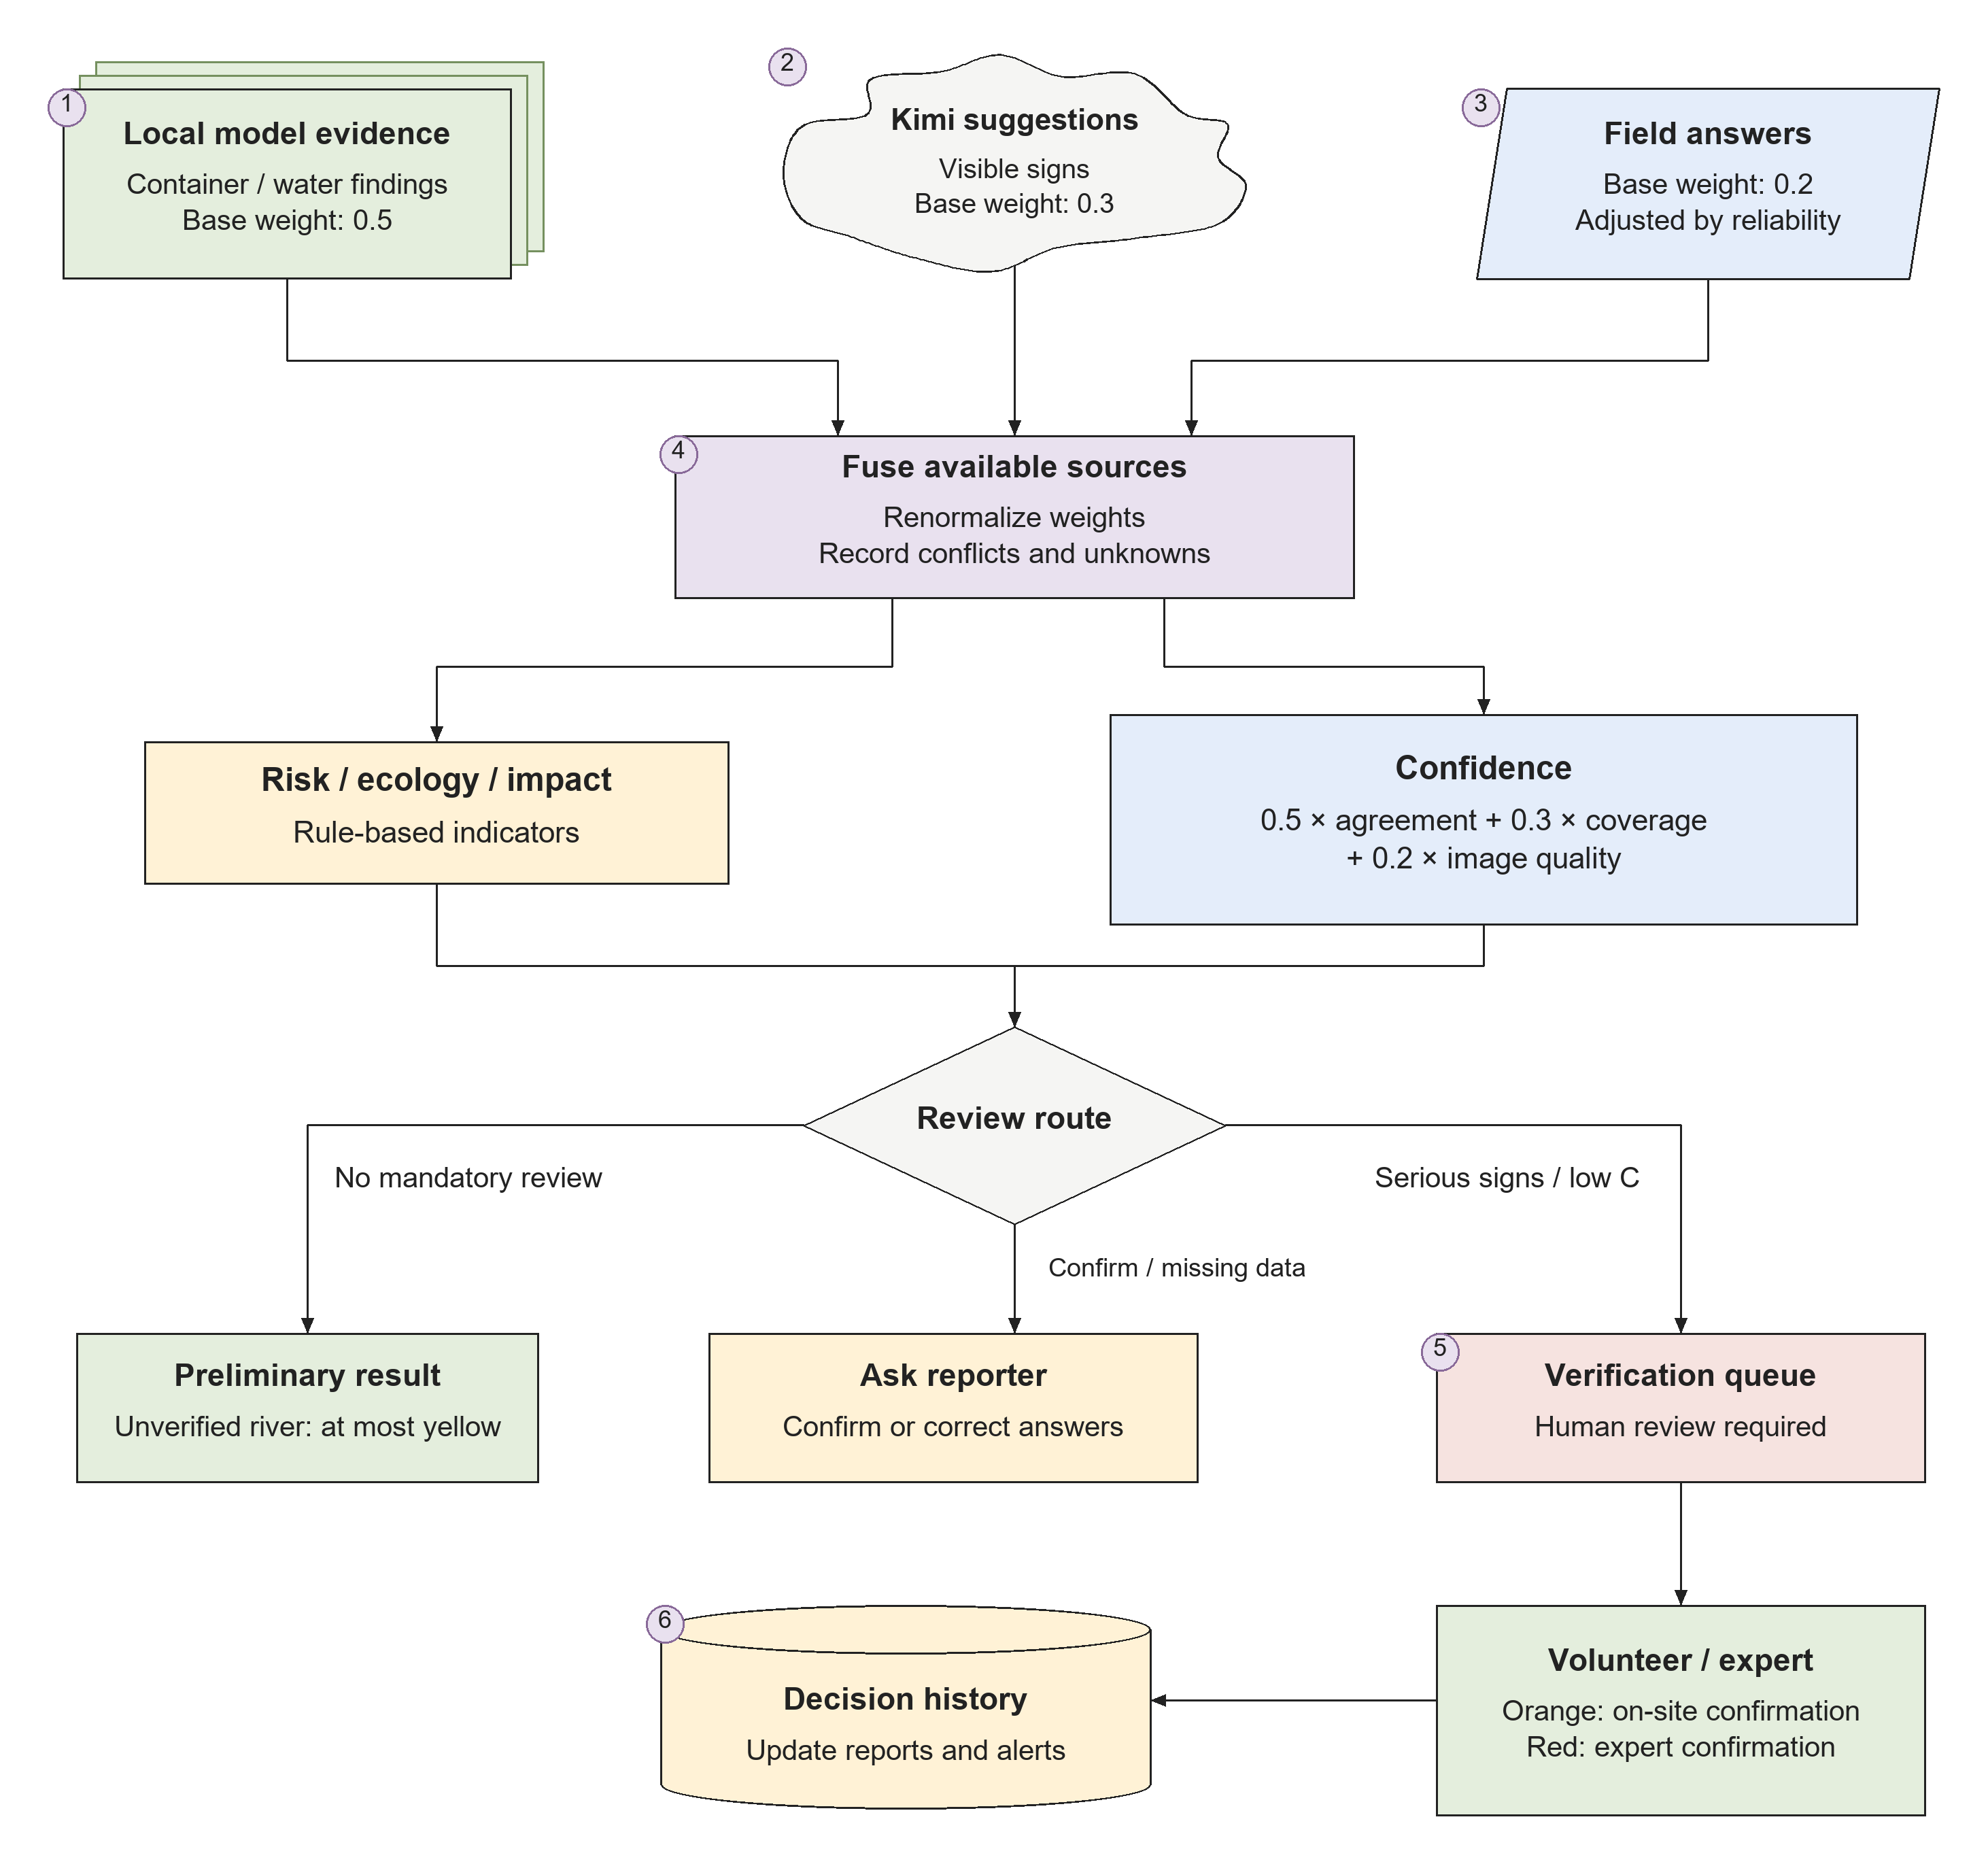
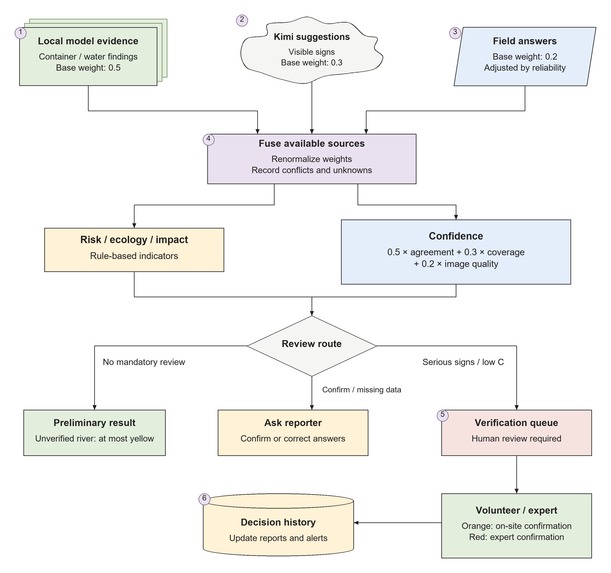
Evidence and review: Combining model findings and reporter answers to decide when human verification is needed.
-
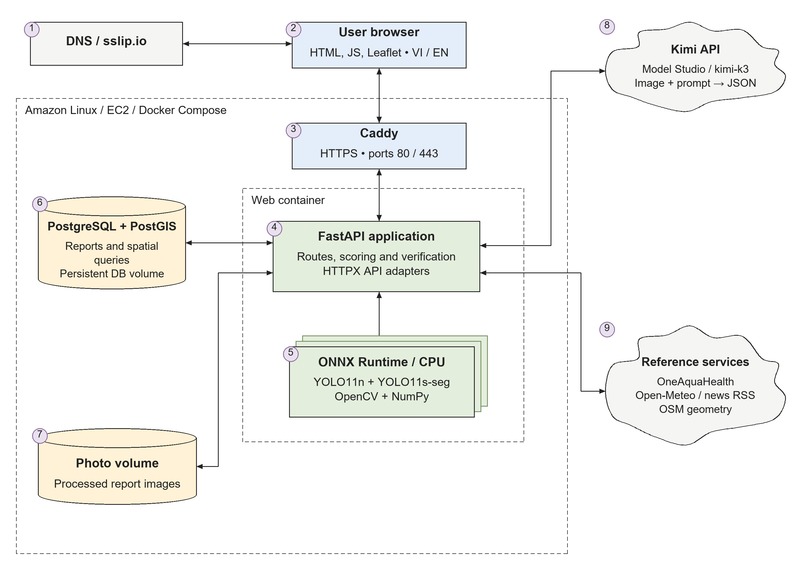
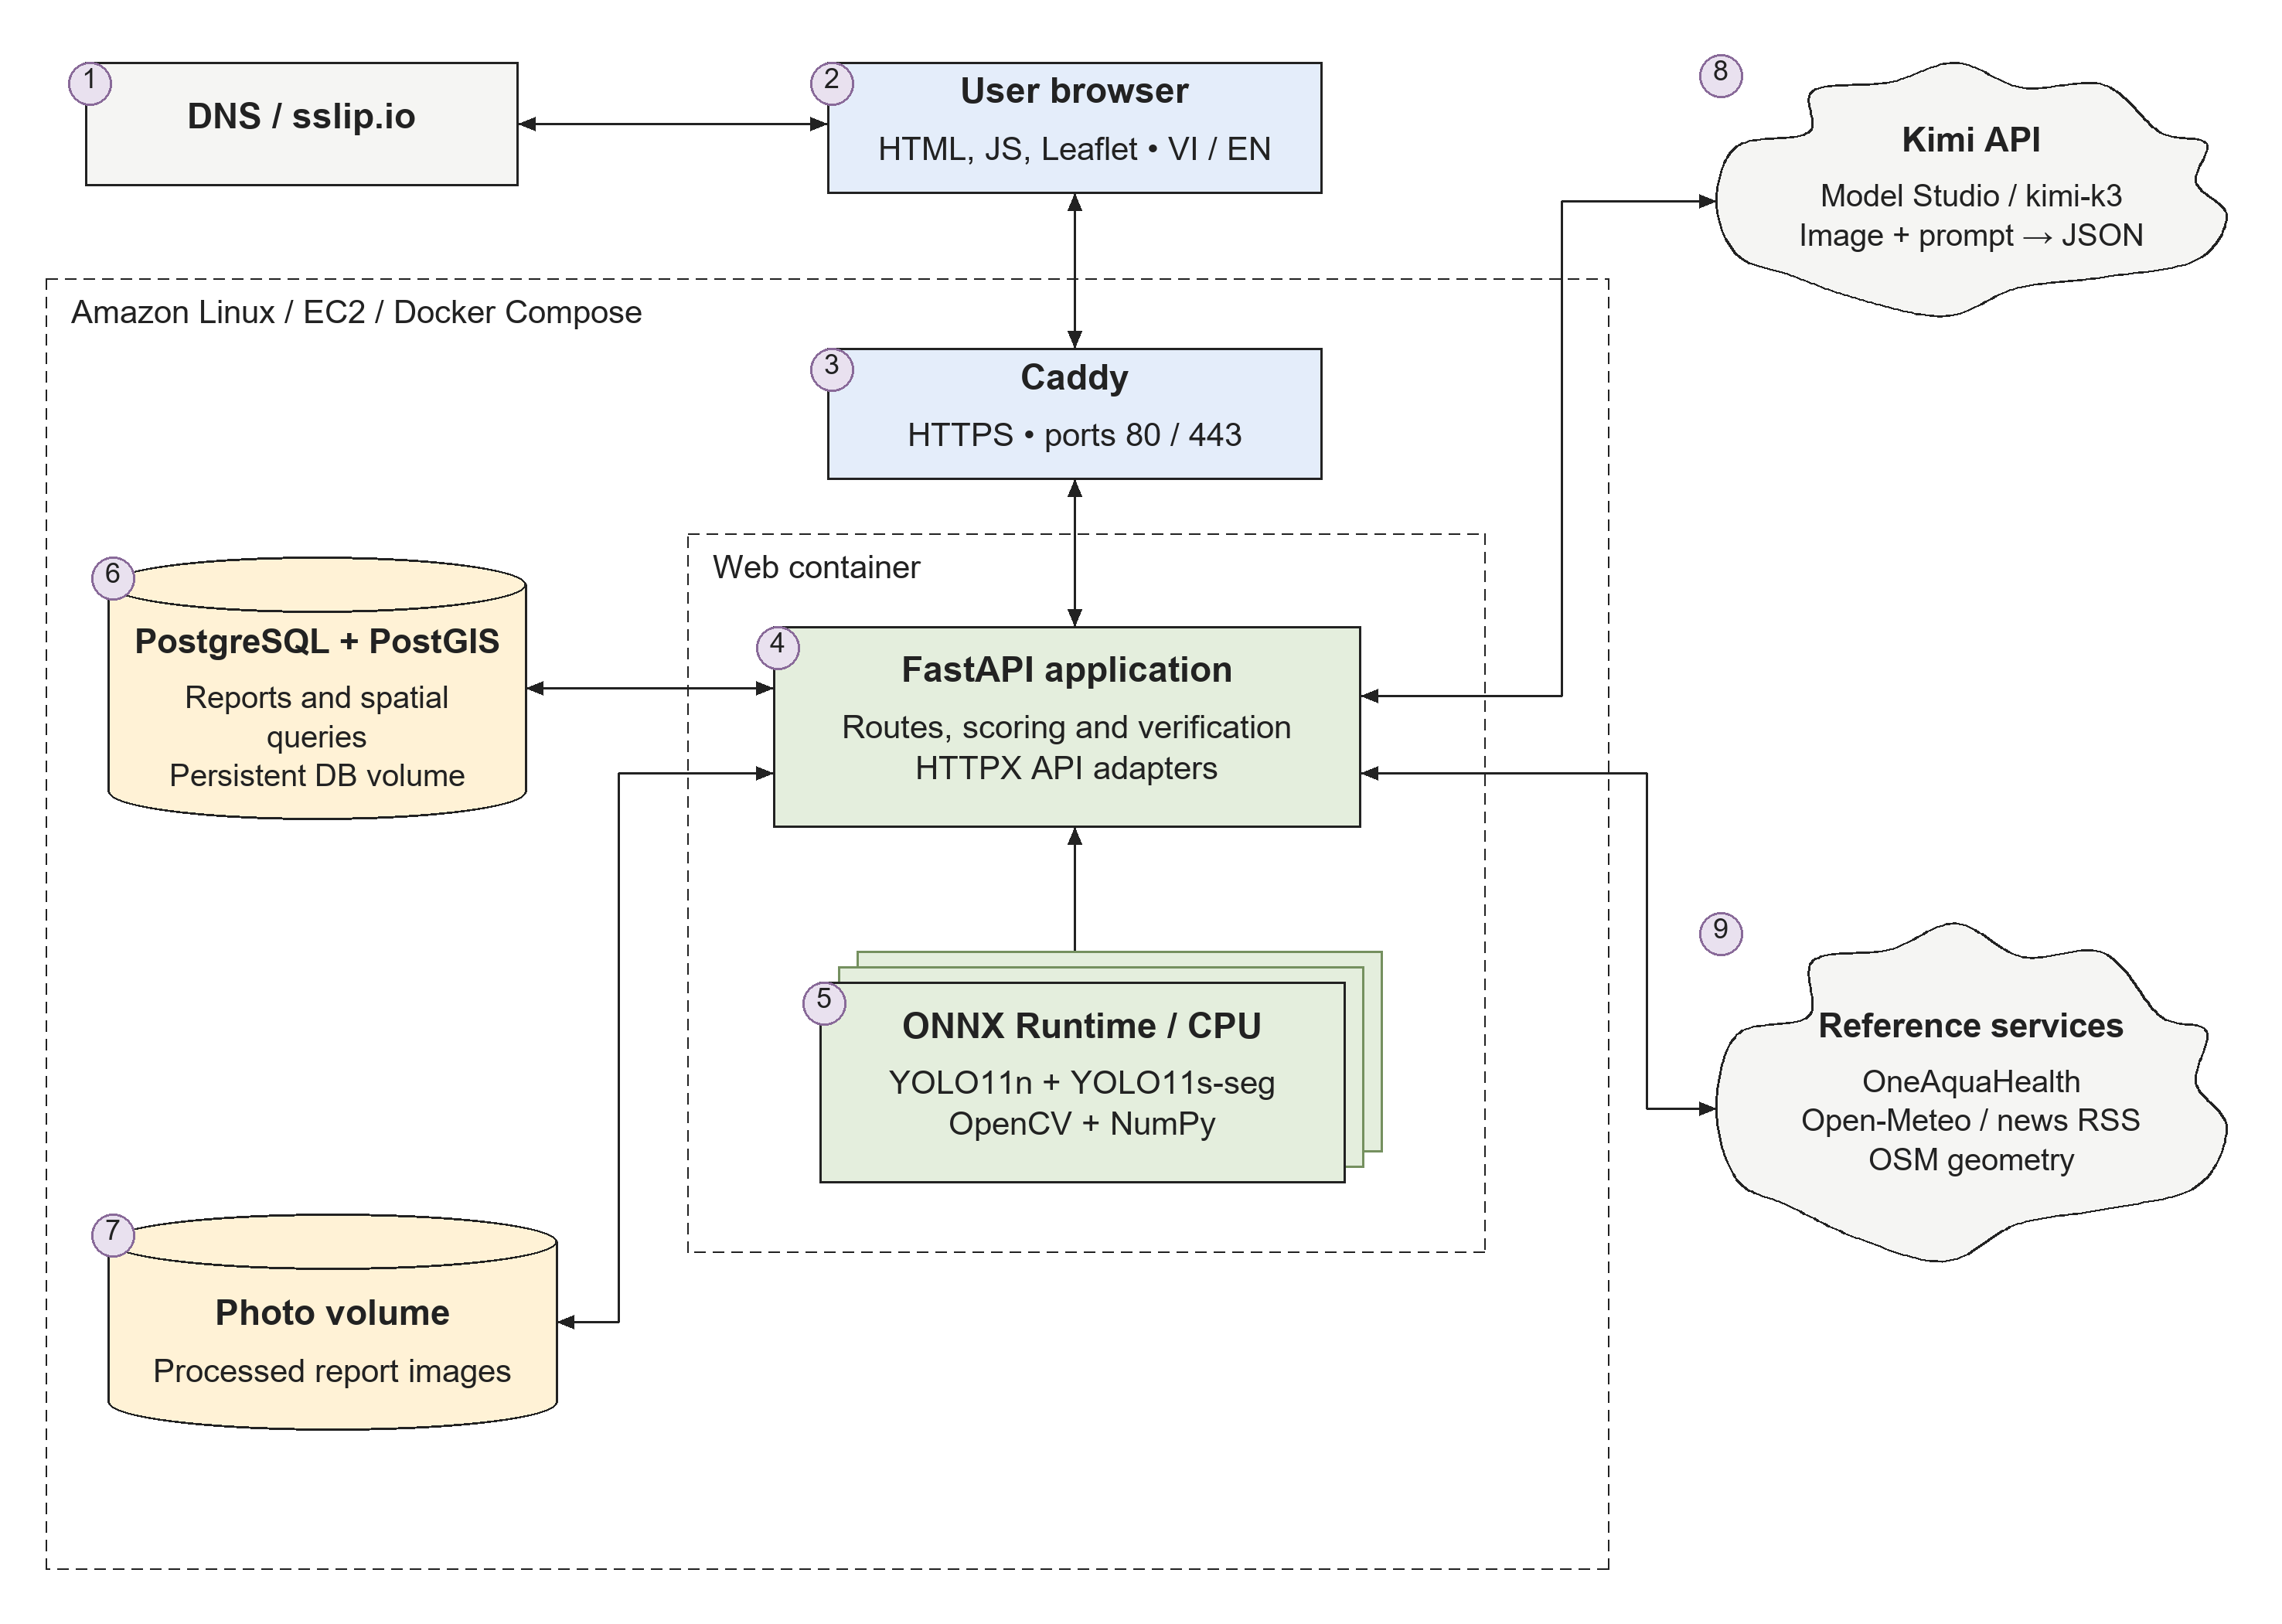
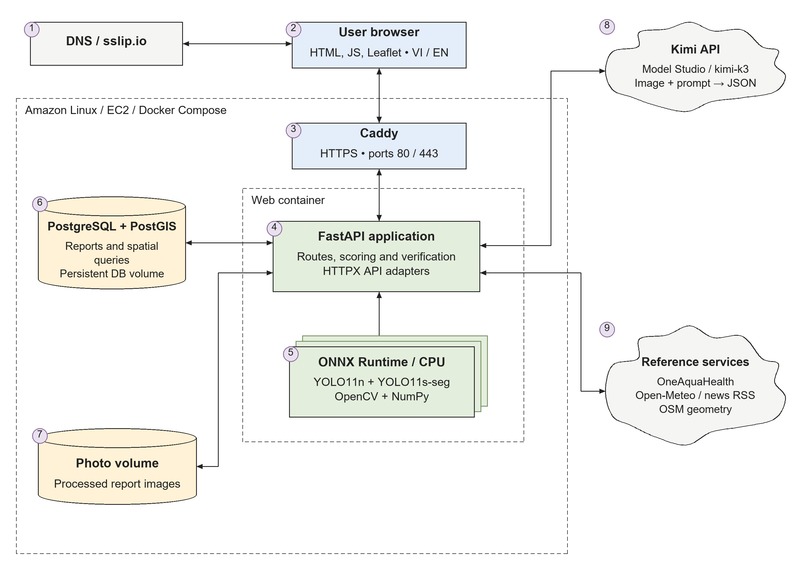
System architecture: AquaPulse on EC2 with FastAPI, PostgreSQL/PostGIS, local models, and the Kimi API.
-
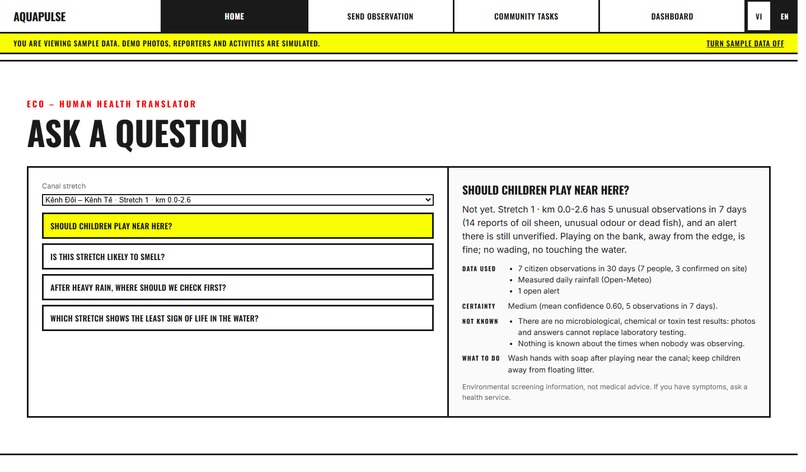
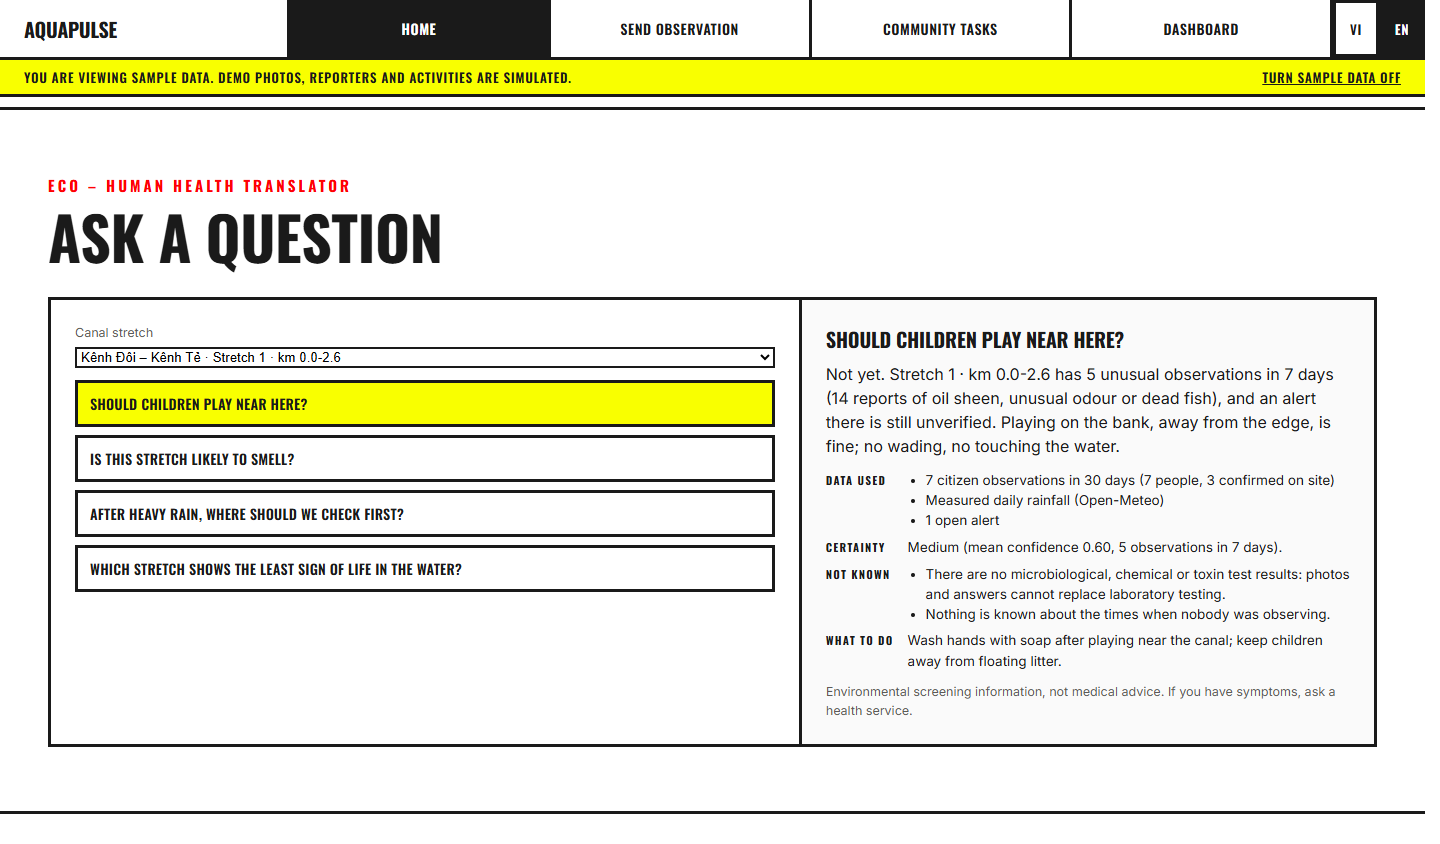
Questions and answers: Ask about a canal stretch and see the evidence, uncertainty, and practical steps behind each answer.
-
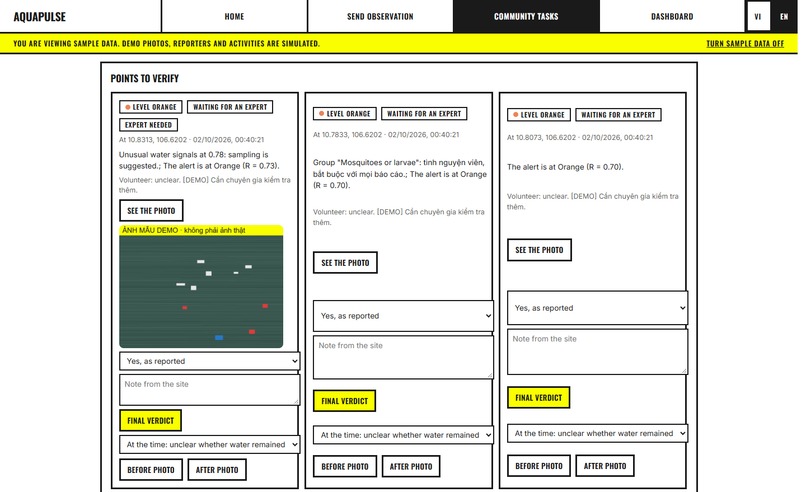
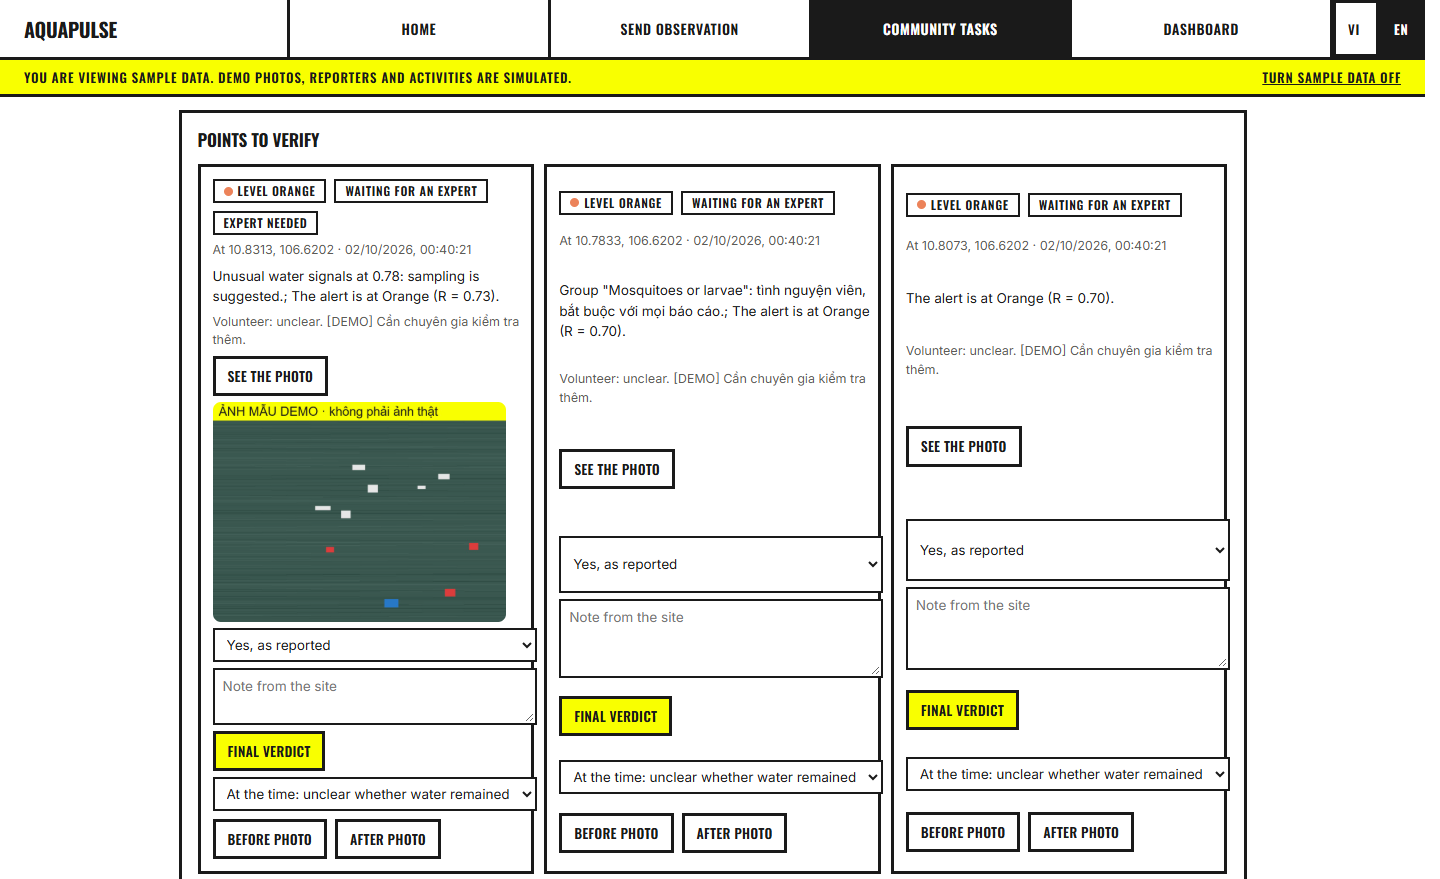
Verification: Review reports and alerts, add verification notes, and decide which cases need further attention.
-
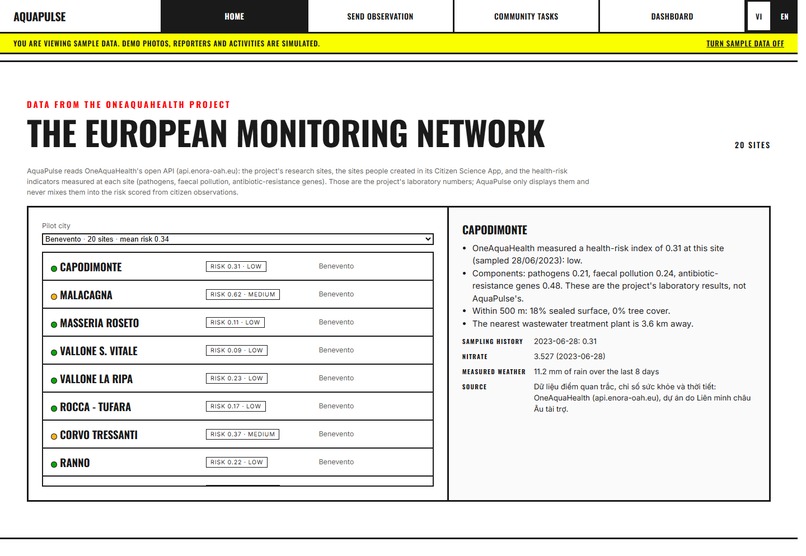
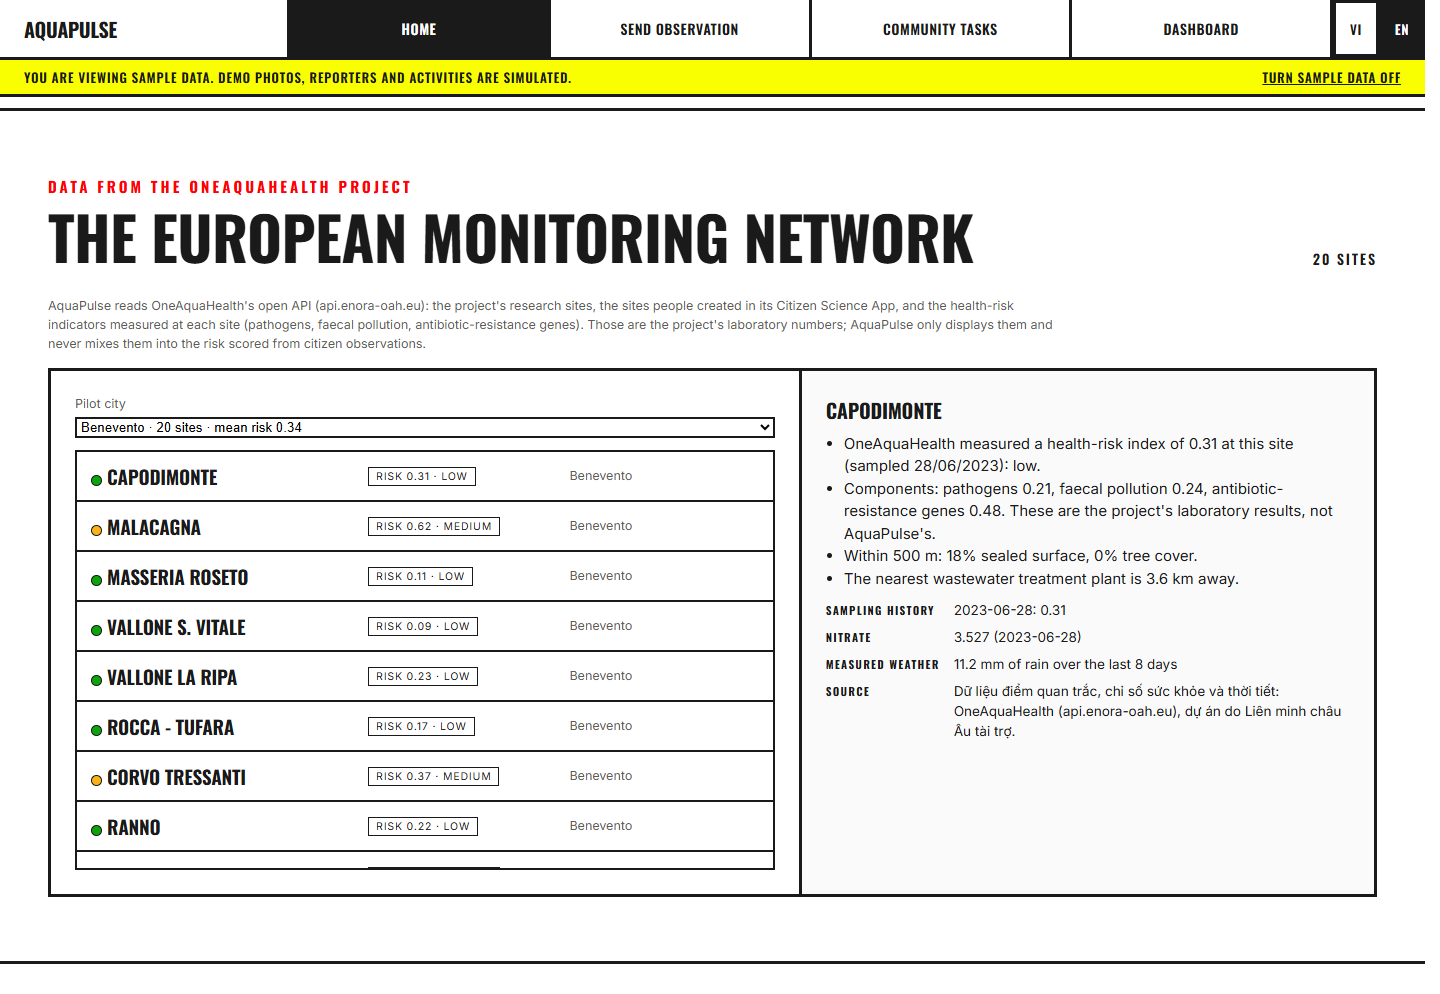
OneAquaHealth: Explore monitoring sites and their reference measurements, sampling history, and weather context.
-
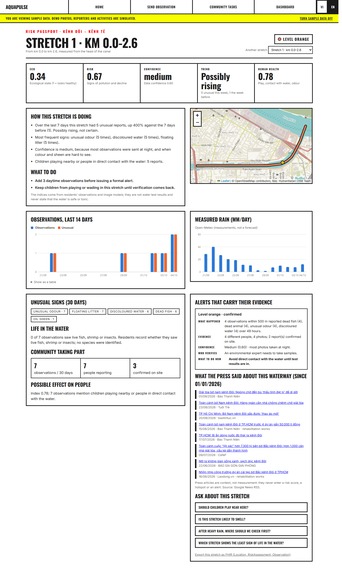
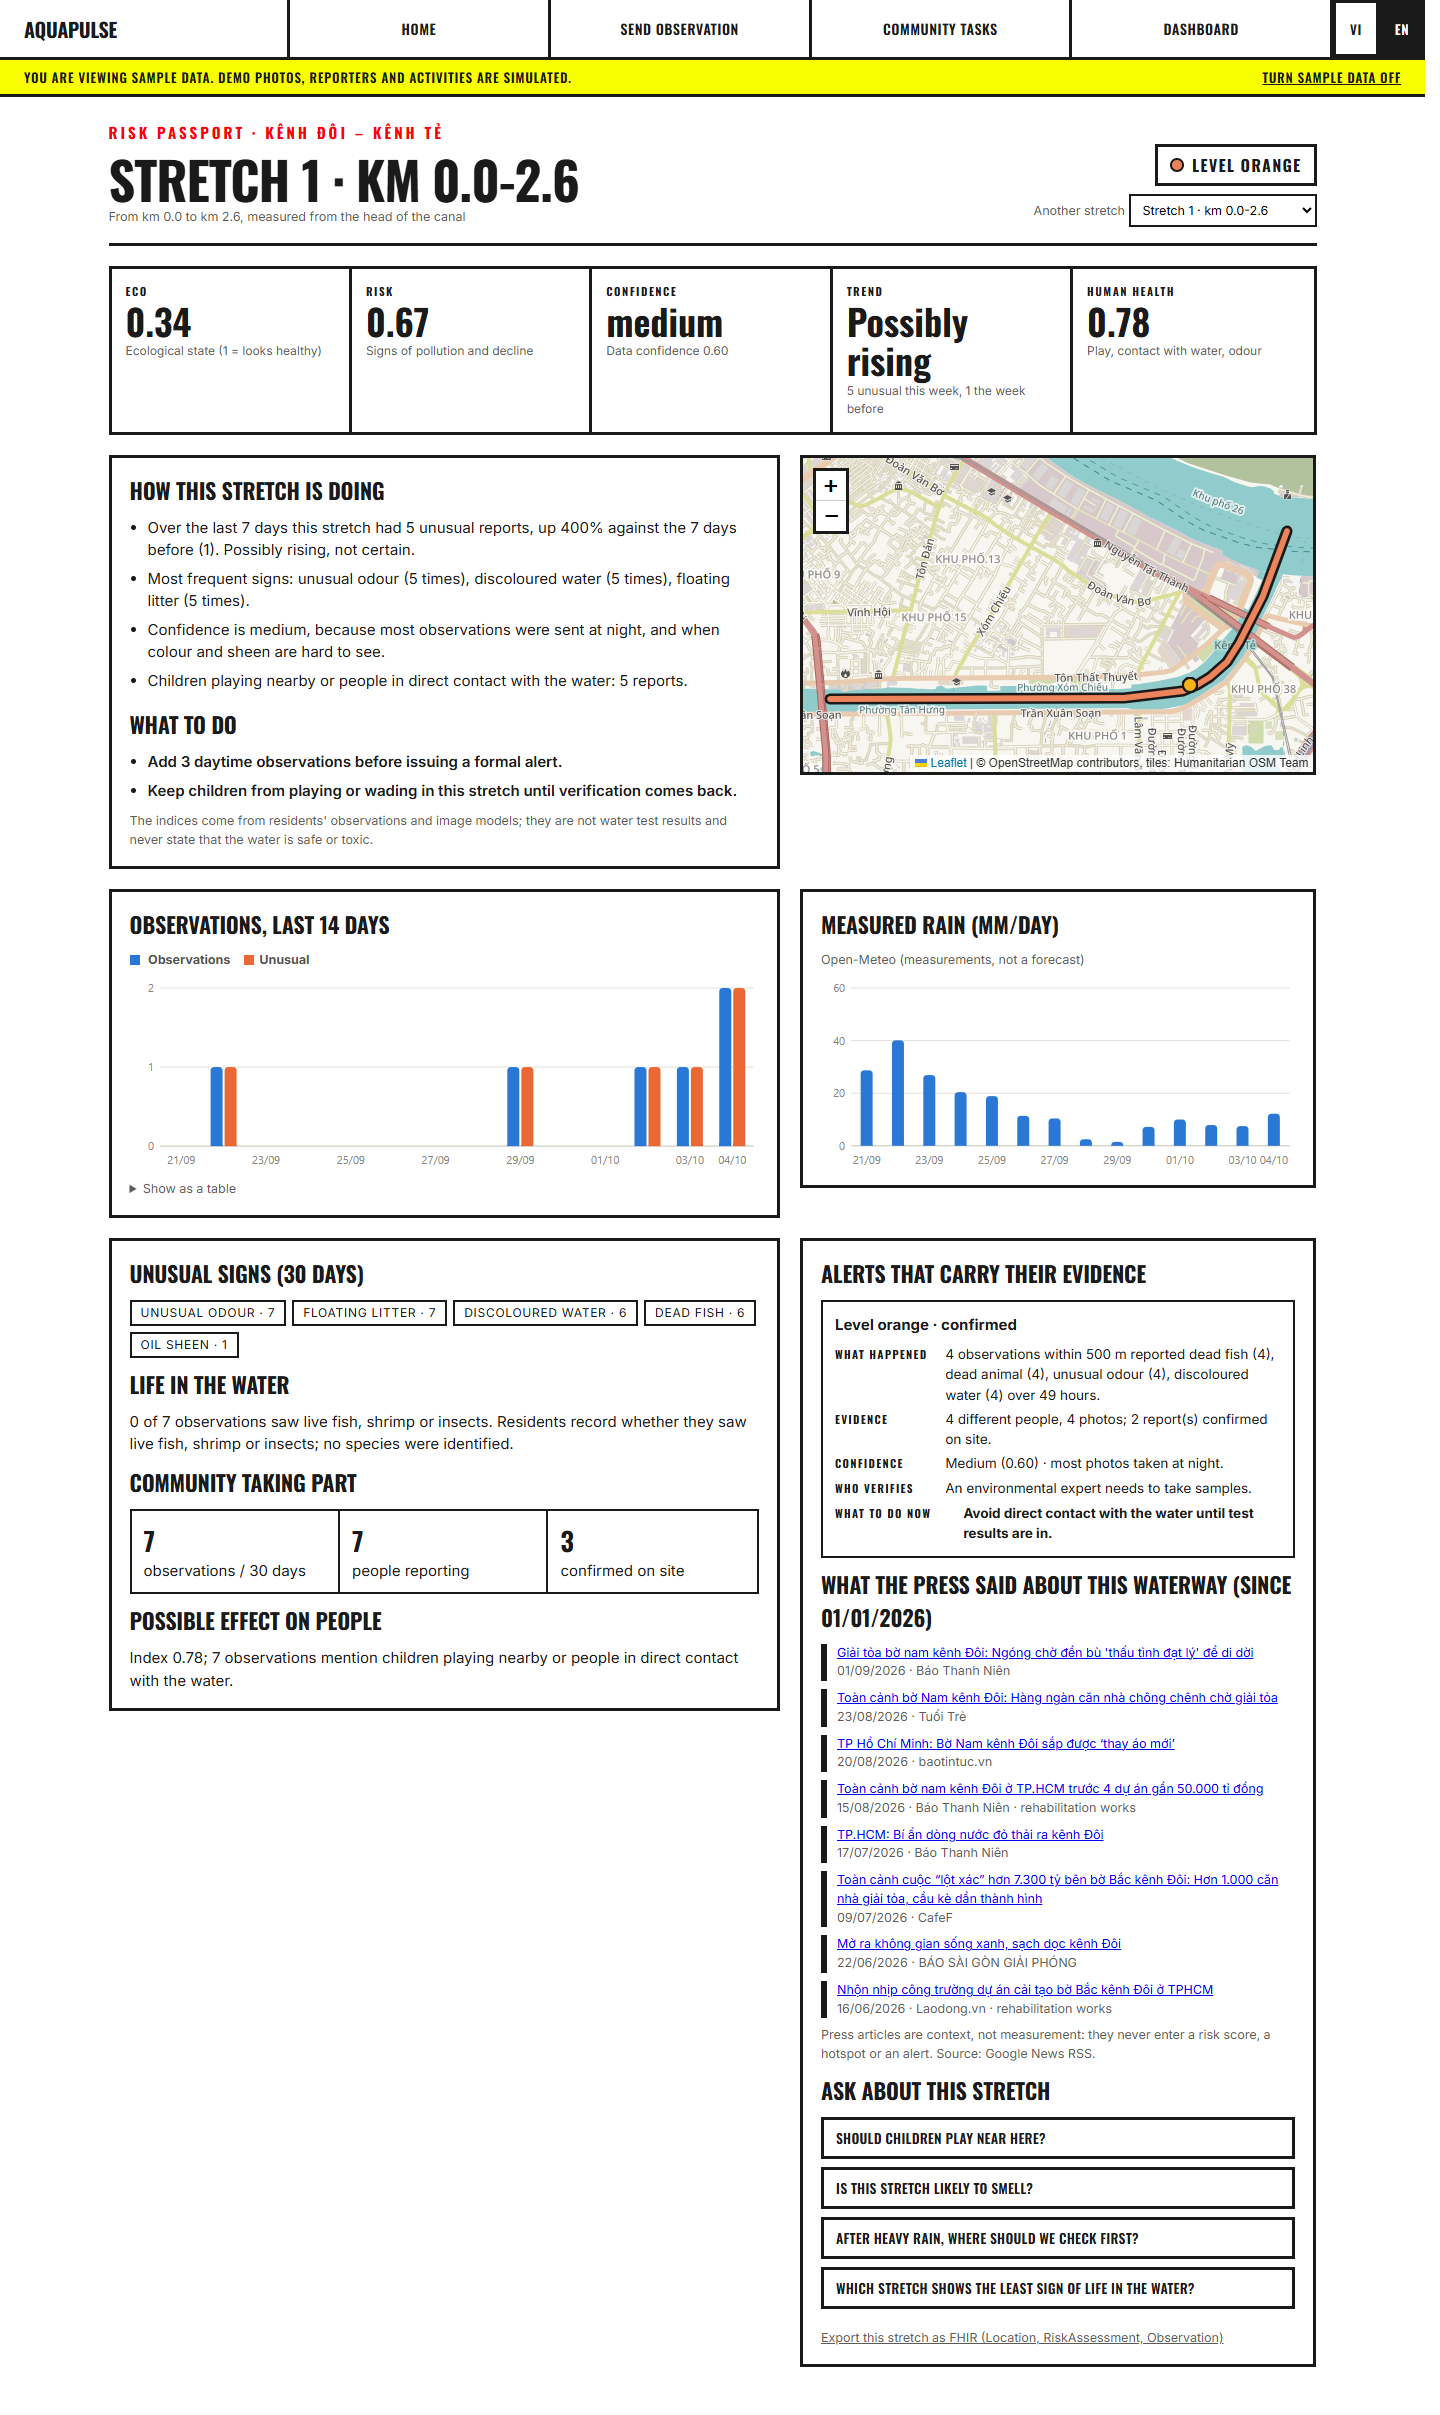
Canal passport: Check a canal stretch's risk indicators, observation history, rainfall, and supporting evidence.
-
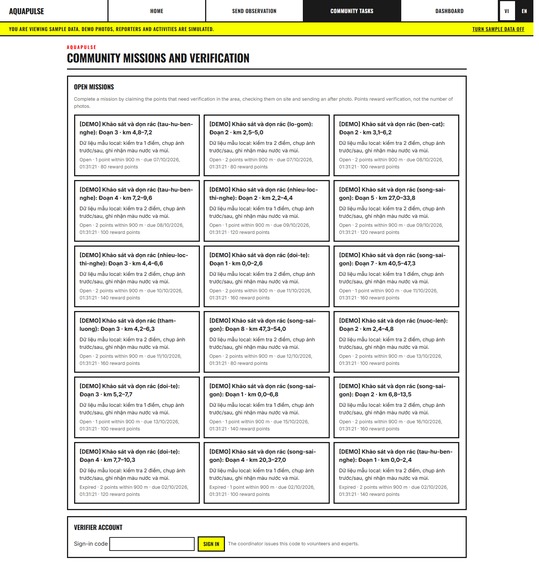
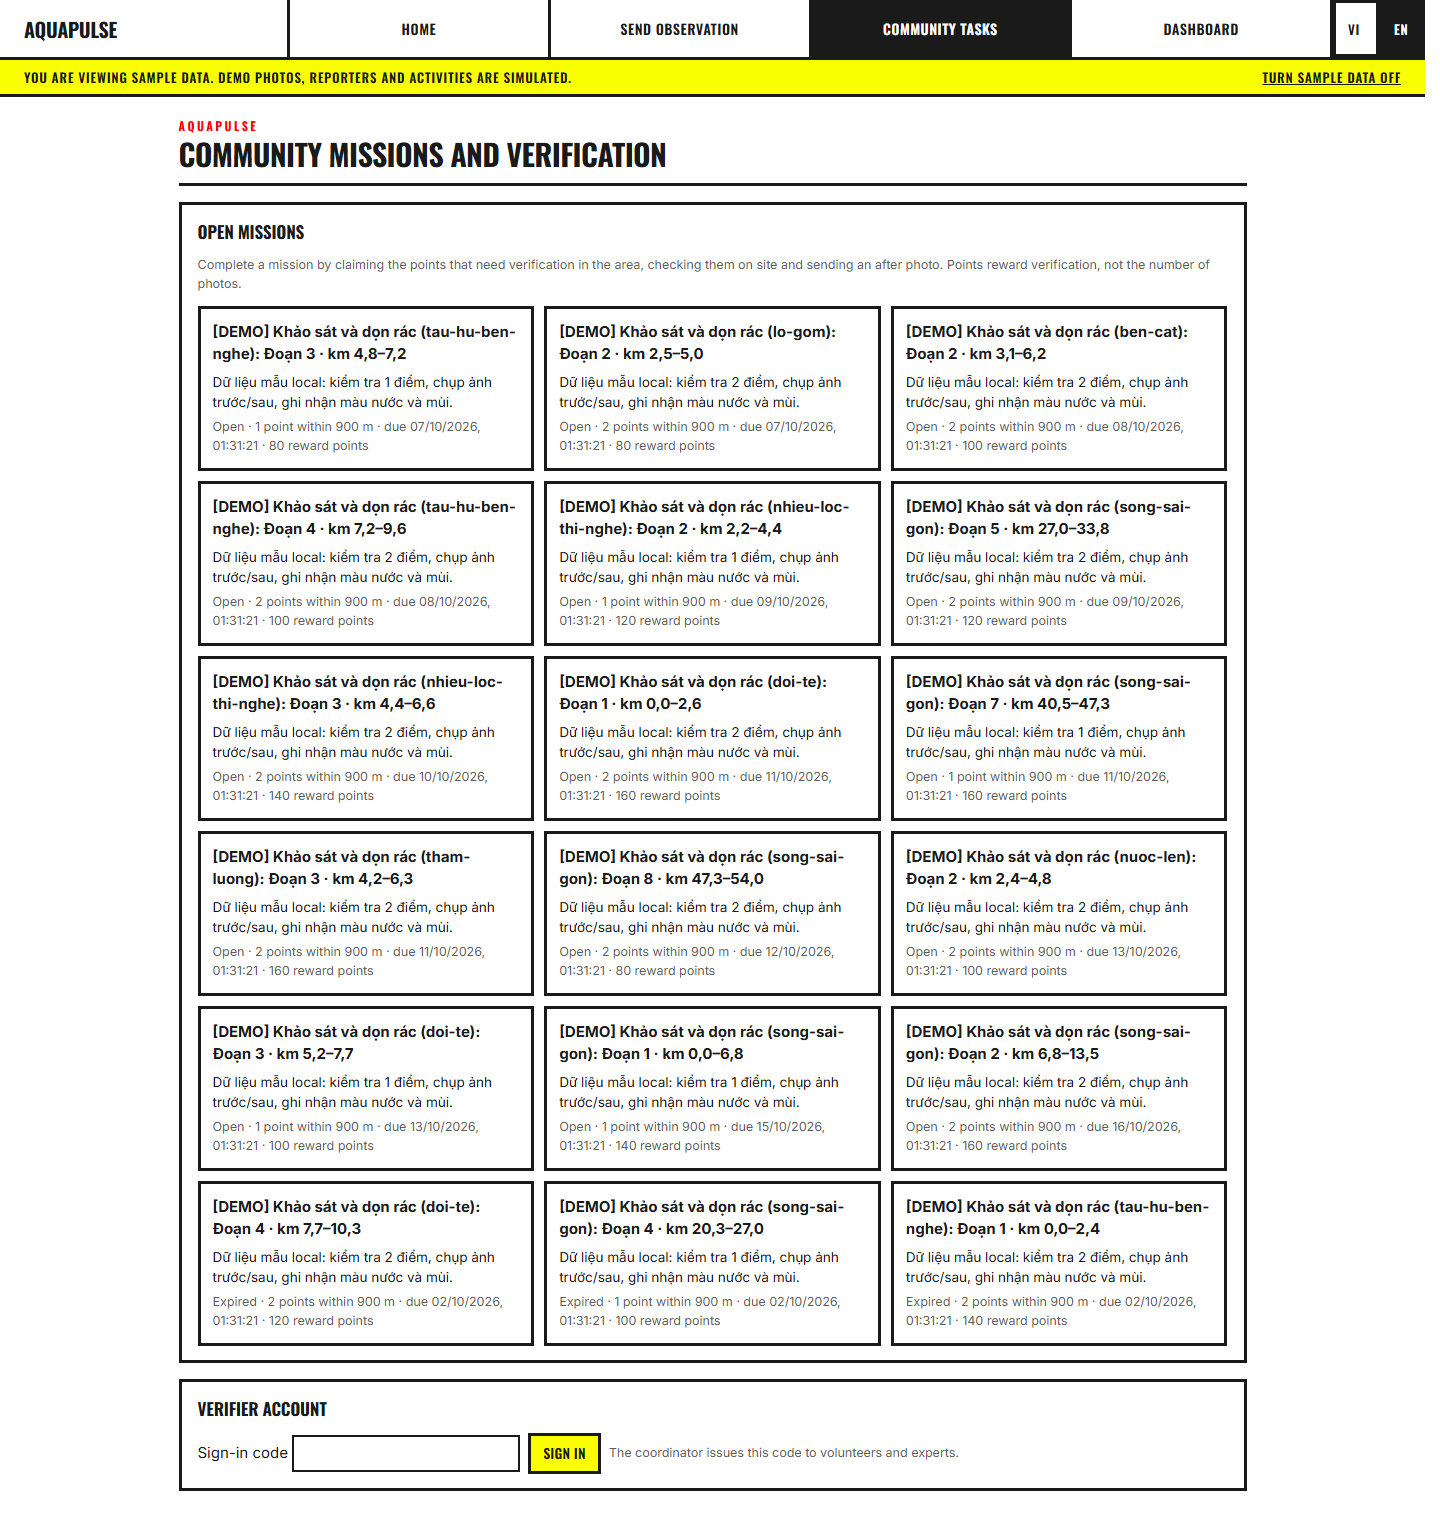
Community missions: Browse cleanup and checking missions, see deadlines and reward points, and sign in as a verifier.
-
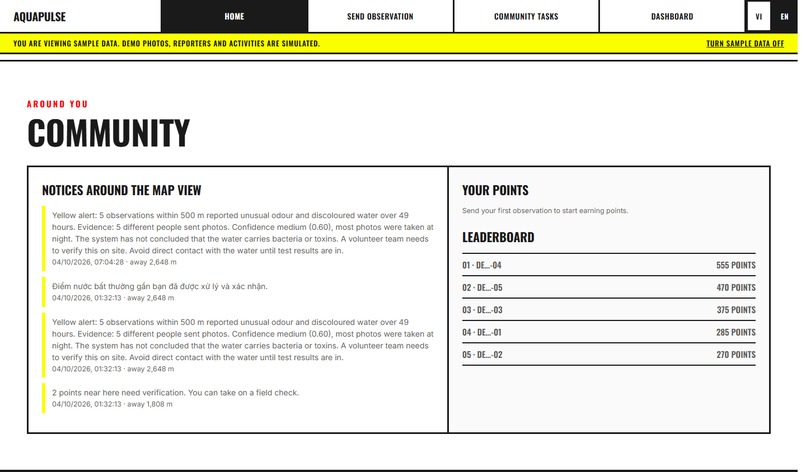
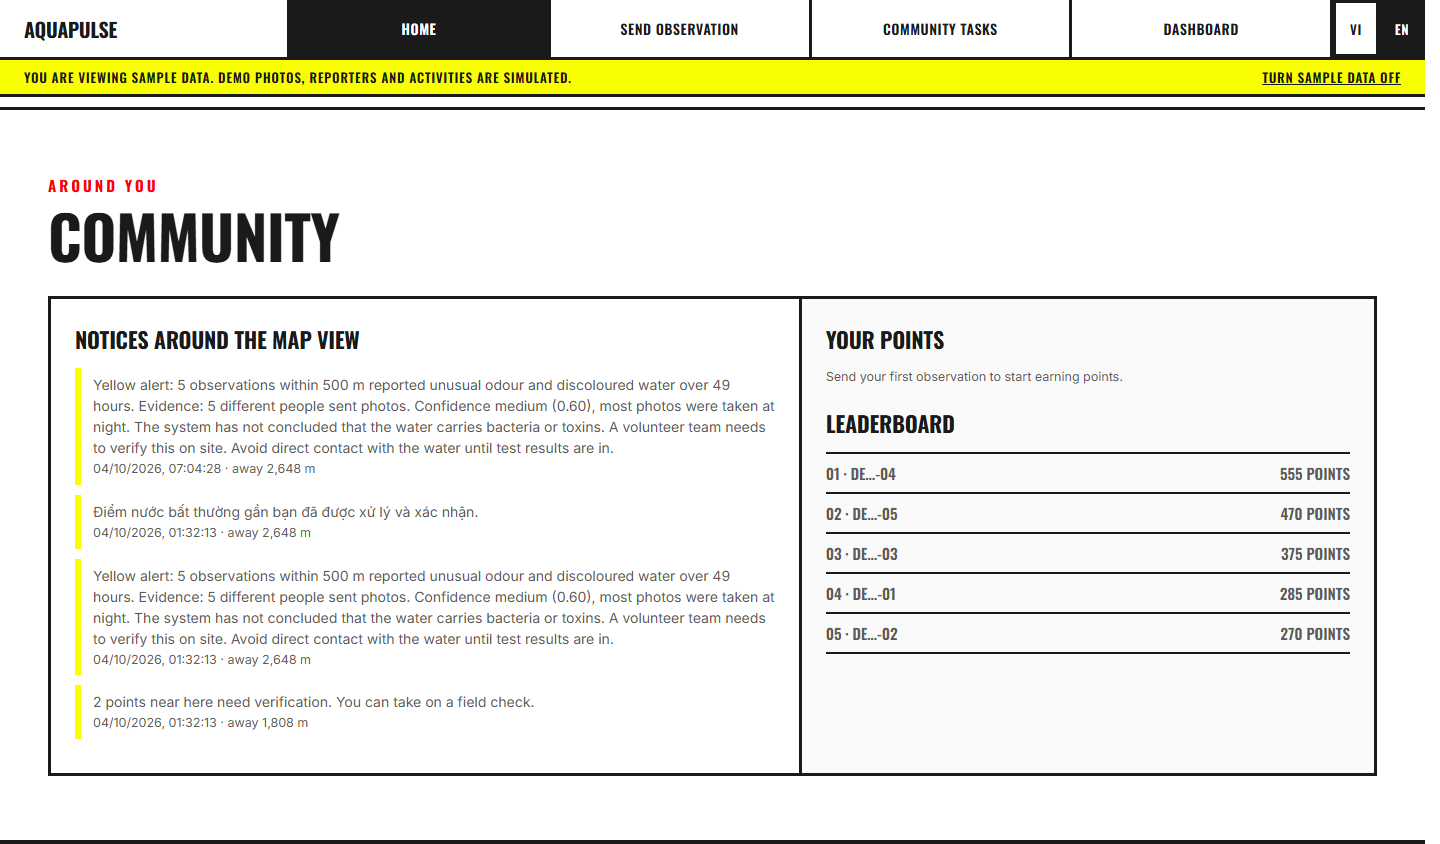
Community: See neighborhood notices and the leaderboard, with points awarded for verified contributions.
-
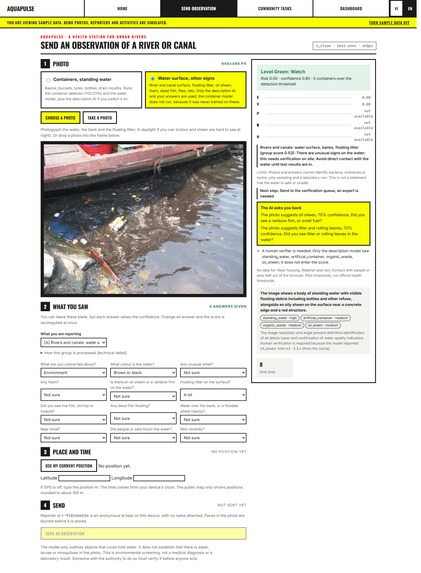
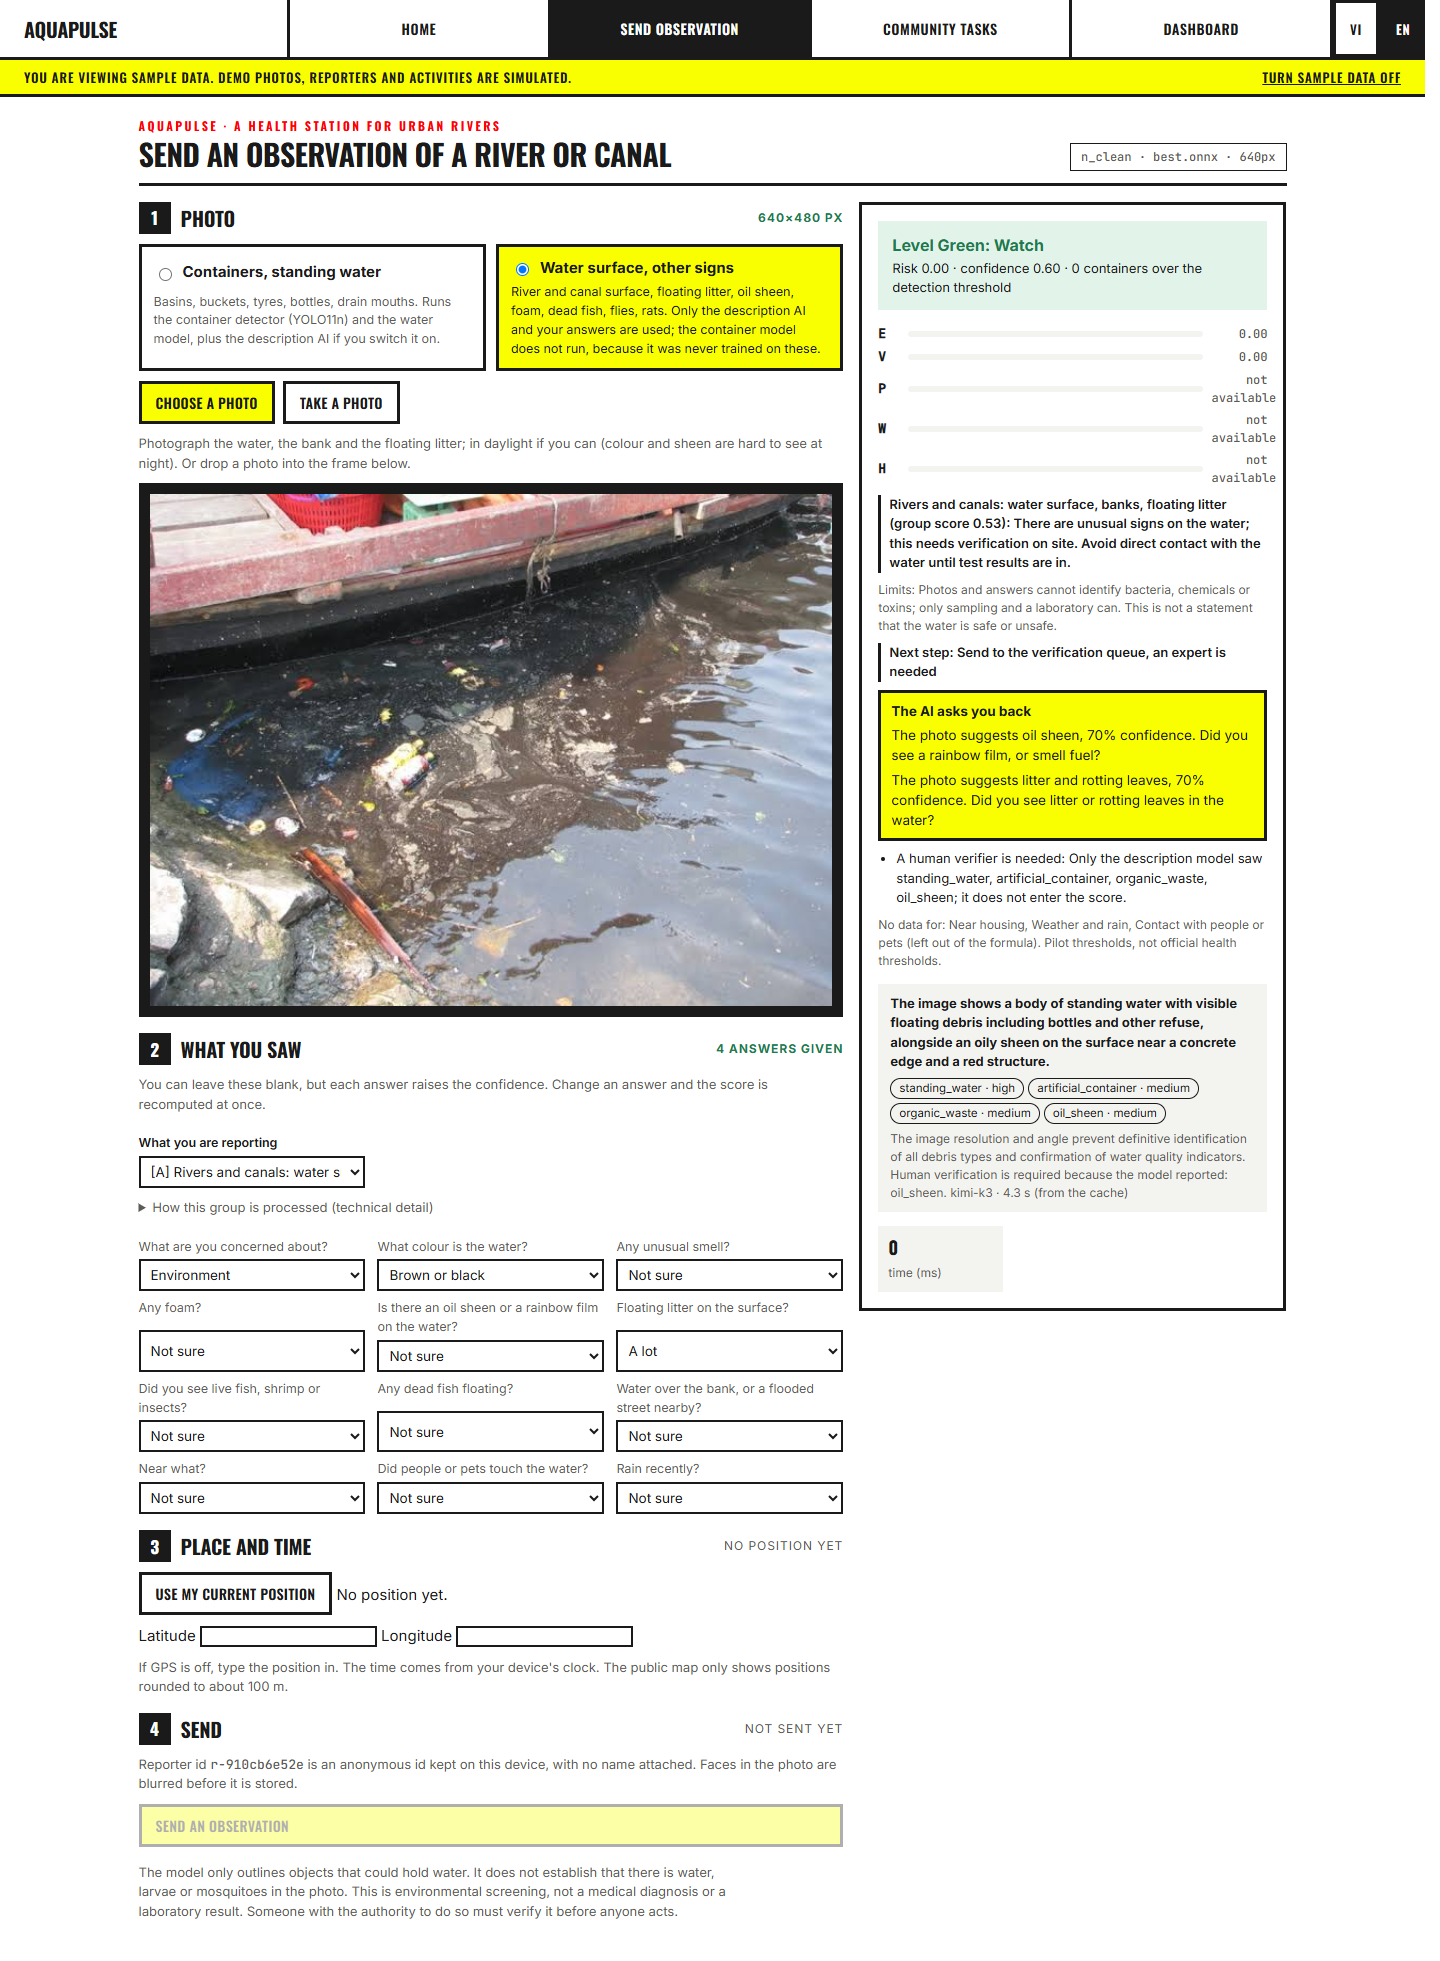
Photo report: Upload a photo, answer what you saw, review the analysis, and save an observation for follow-up.
-
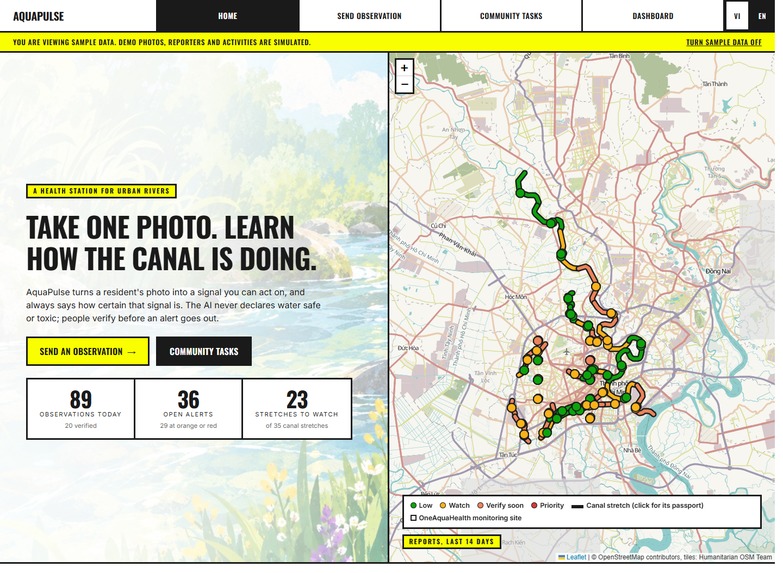
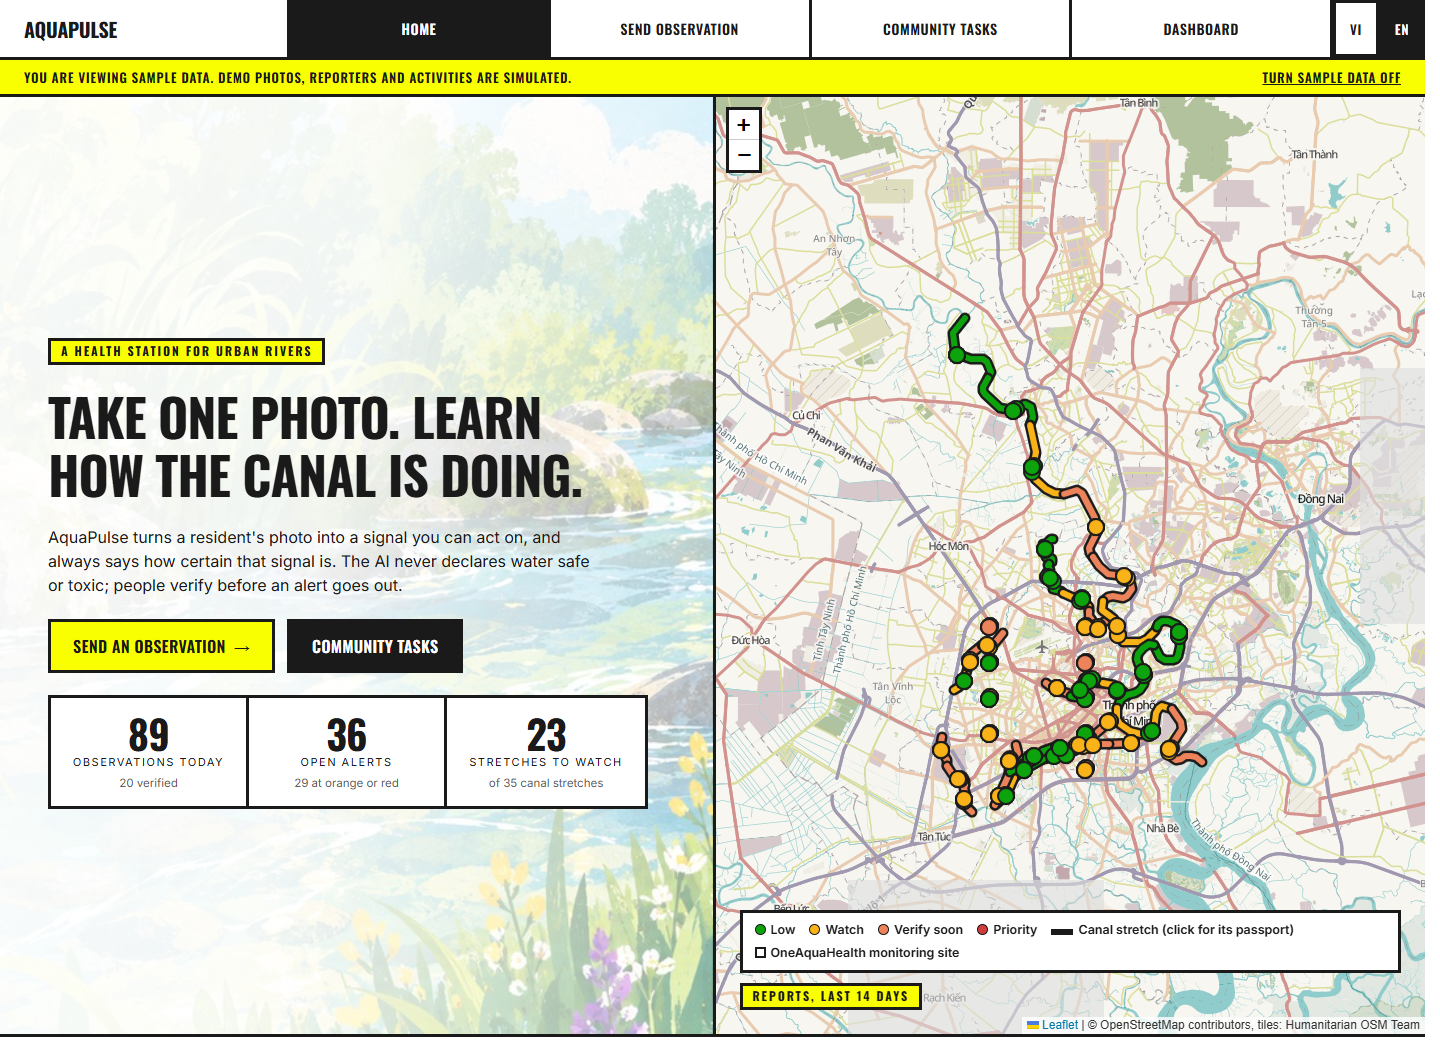
Home: Explore the canal map, recent observations, active alerts, and the stretches that need attention.
-
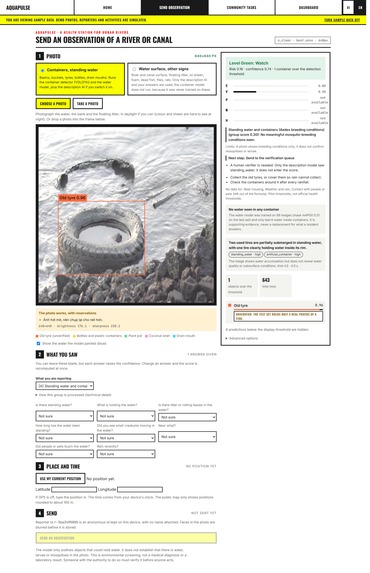
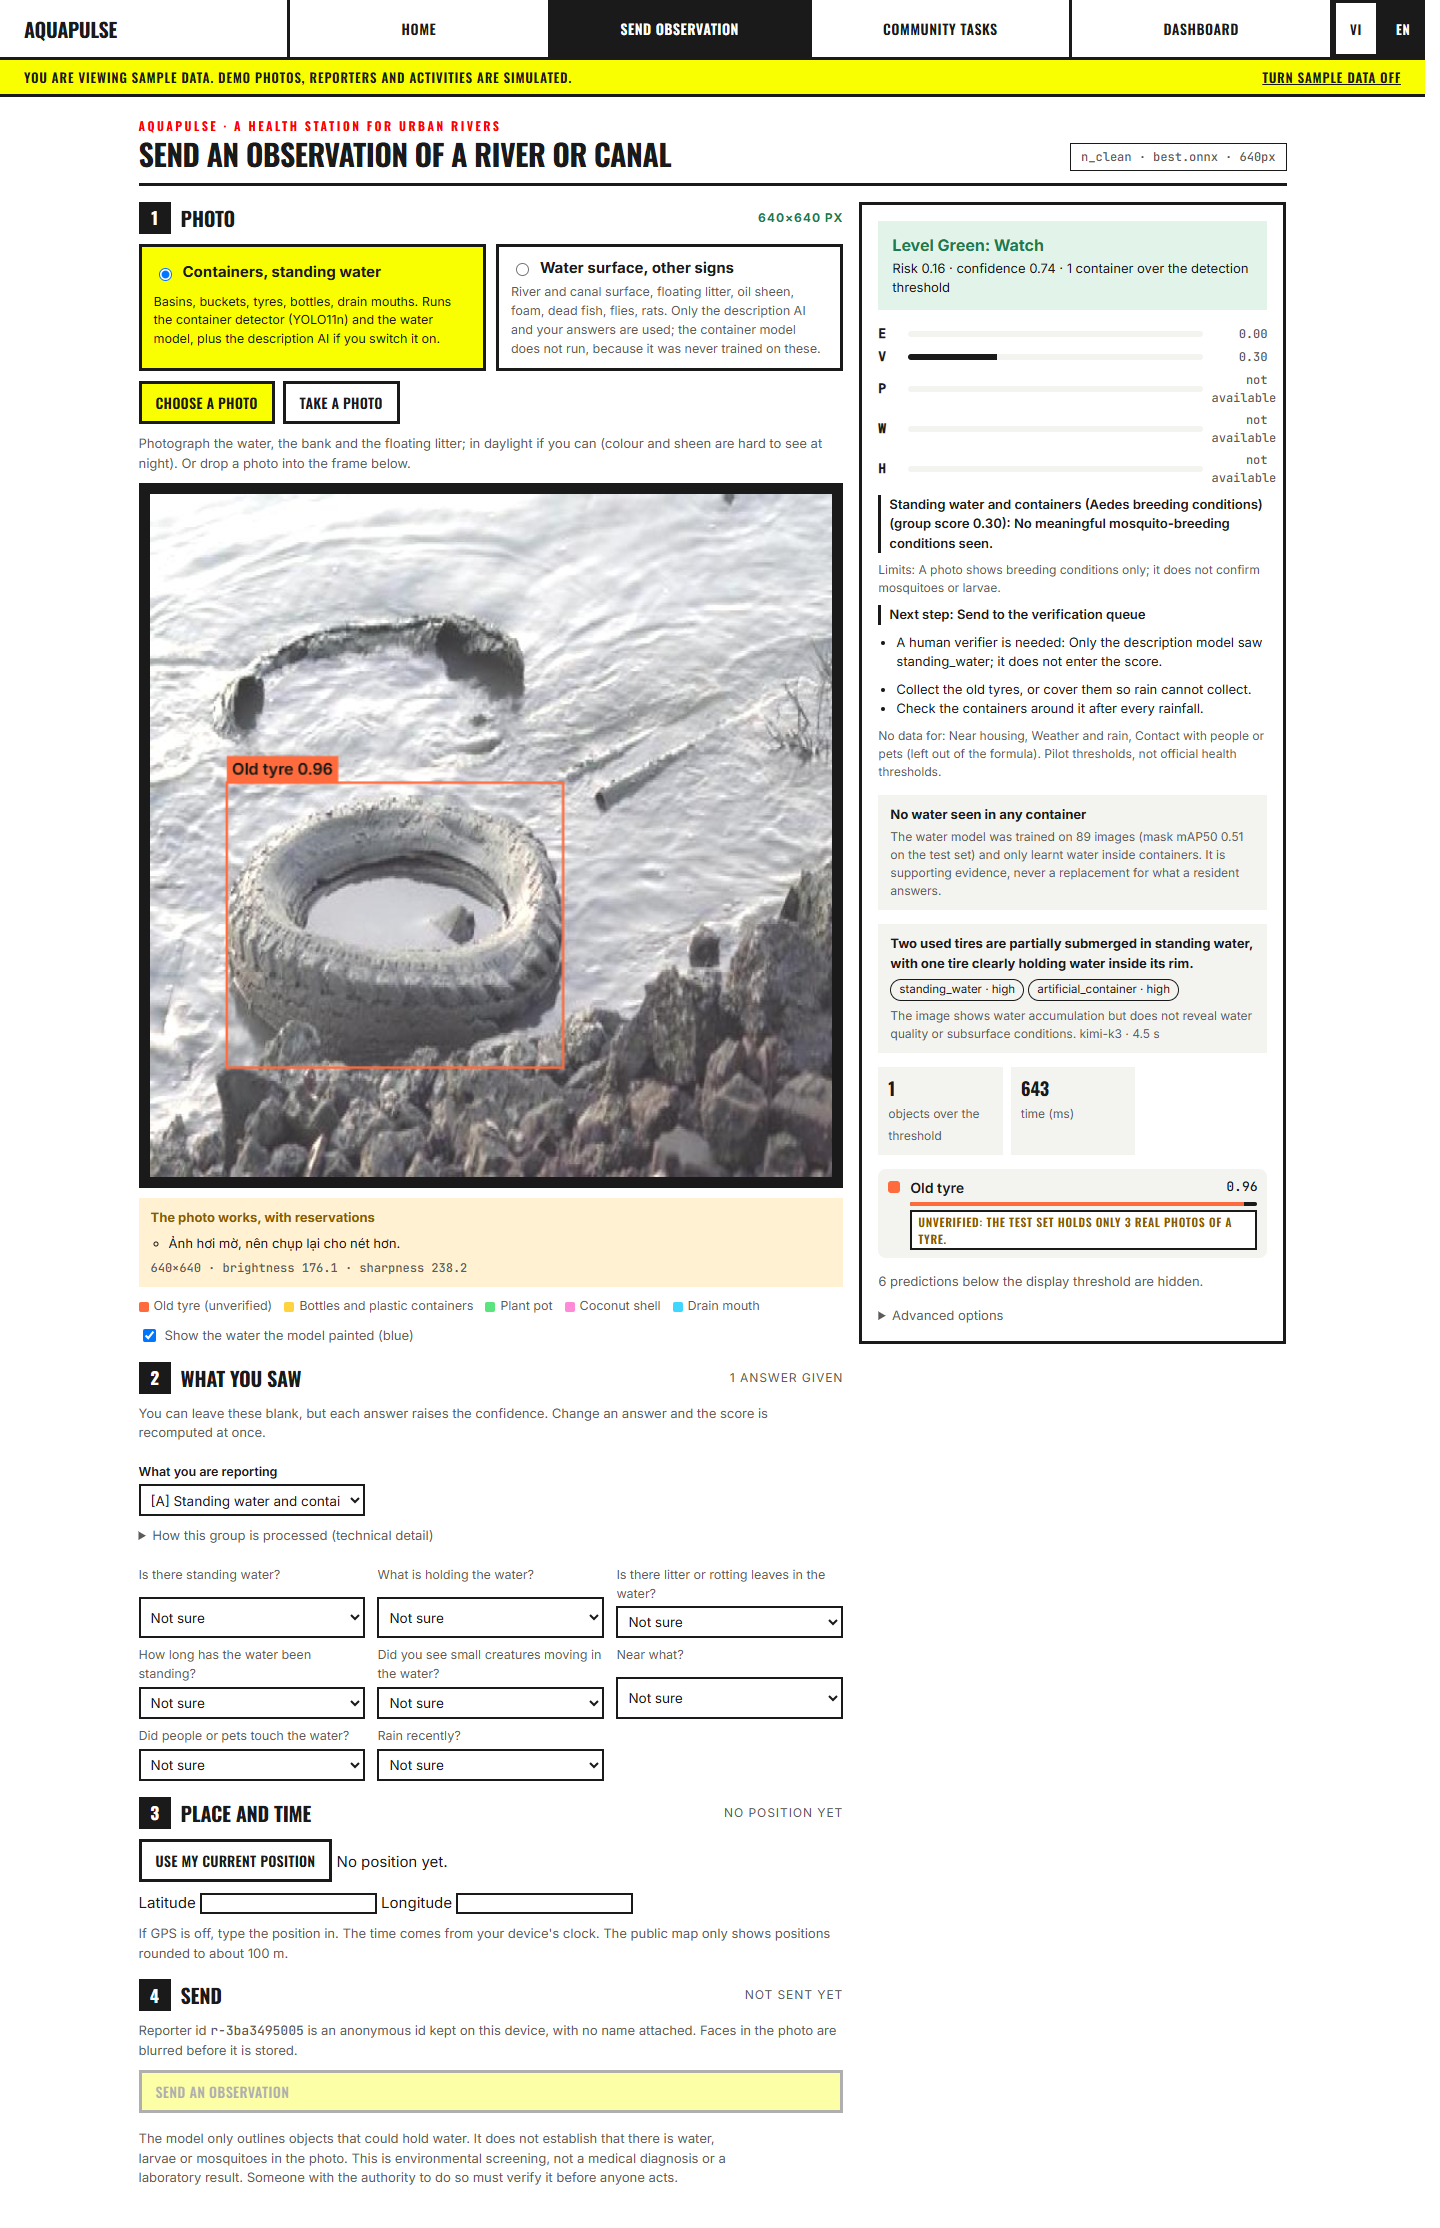
YOLO detection: Run YOLO11n on discarded tyres beside the water and review the detection with the photo analysis.
-
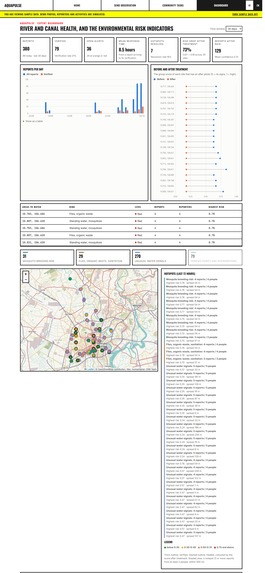
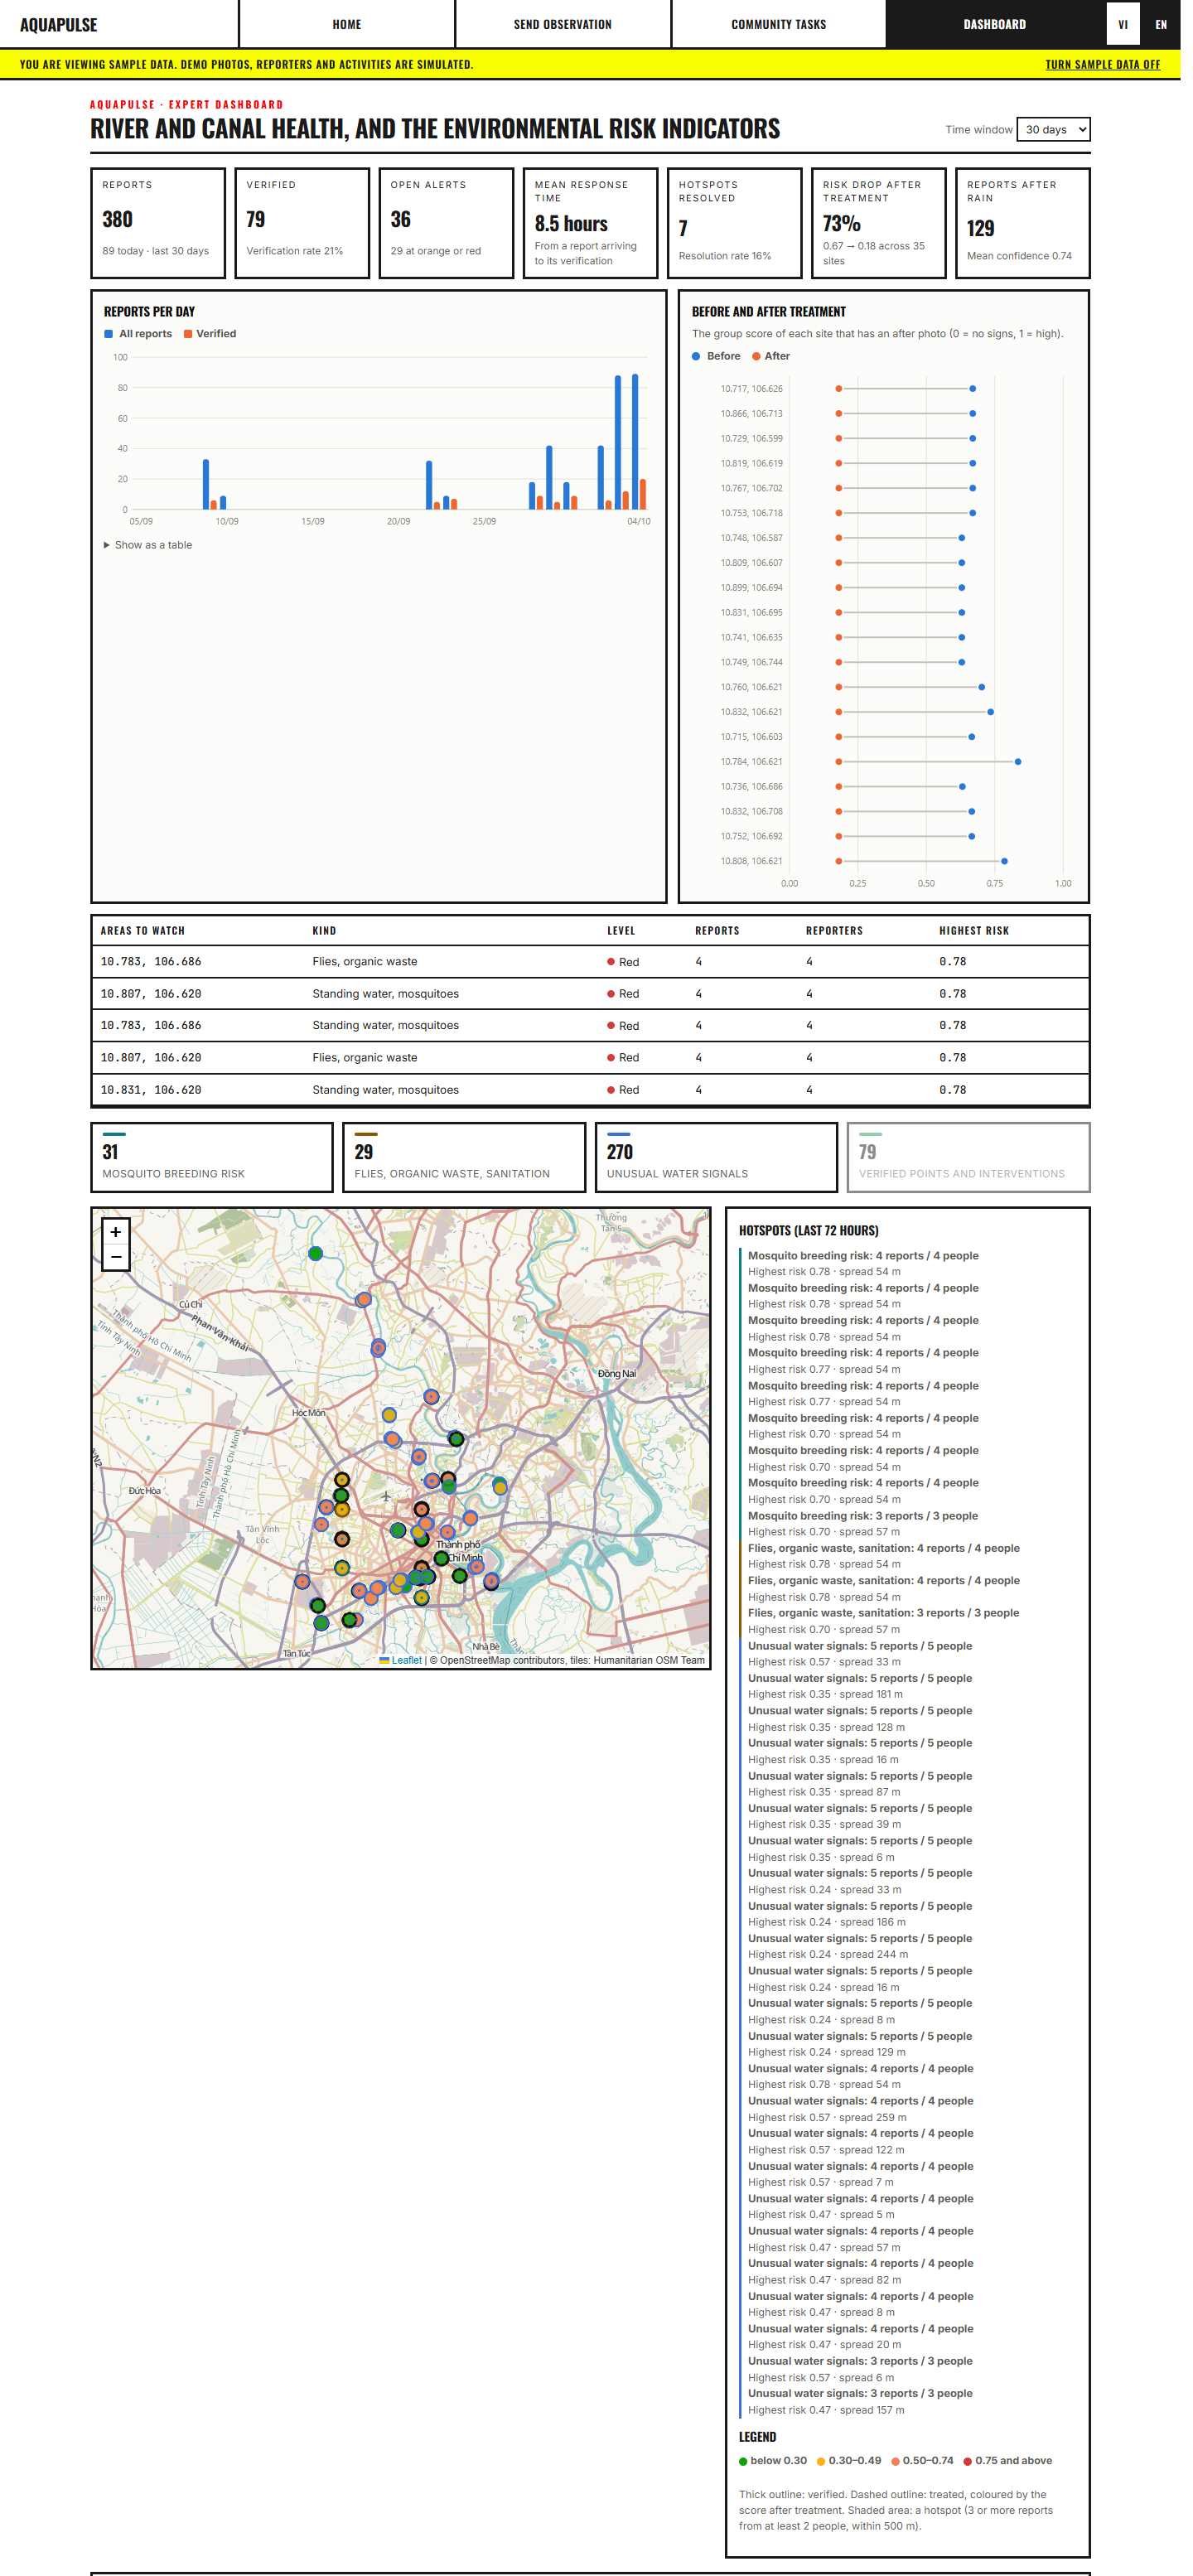
Dashboard: Compare report trends, verification progress, treatment results, and areas that need attention.
Inspiration
I started AquaPulse with a simple question: if someone sees trash, dark water, or dead fish in a canal, what can they do with that information?
A photo can show a problem, but it does not tell us whether anyone checked the location or what happened afterward. I wanted to connect those steps instead of leaving each observation as a separate post.
I am from Vietnam, and I built AquaPulse around urban rivers and canals, including waterways in Ho Chi Minh City. My goal is to help residents share useful observations and help volunteers and experts decide what to check next.
What it does
AquaPulse connects citizen observations with preliminary analysis, maps, human verification, and community activities.
- Report an observation: upload a photo, answer questions about visible signs and things noticed at the scene, and add a location and time. The river form covers water color, odor, foam, oil sheen, floating waste, living organisms, and dead fish. Odor and other things a photo cannot show come from the reporter's answers.
- Analyze the image: container photos can use the trained object detector and water segmentation model. River-surface photos use the scene-description API and the reporter's answers. The result shows what ran, what was found, confidence, and missing information.
- Explore the map: find reports, hotspots, and alerts by location. Duplicate submissions are linked to an existing observation rather than earning new reporting points.
- Open a canal passport: review ecological condition, reported environmental risk, confidence, trend, and human-impact indicators for one canal section, alongside history, rainfall context, alerts, and participation.
- Ask practical questions: the Eco-Human Health Translator answers questions about children near a canal, odor, conditions after rain, and biodiversity using the available observations and rules. Its answers explain the evidence and what is still unknown.
- Check reports: authorized volunteers and experts can claim a verification task, inspect the photo, add notes and findings, escalate uncertain cases, and attach before-and-after photos.
- Organize activities: experts can create community missions, including missions linked to an alert. Missions have a location, radius, deadline, target, and contribution points.
- Follow progress: the dashboard shows report volume, verification, open alerts, response times, hotspot resolution, and recorded changes after follow-up. Its map separates mosquito-related conditions, sanitation signs, water anomalies, and verified or treated reports.
- Add context: published OneAquaHealth monitoring data and news about waterways appear with their sources. They remain separate from citizen-report scores.
The interface supports Vietnamese and English. Switching languages keeps the selected photo, answers, and analysis in place. Structured observation and canal data can also be exported in FHIR R4 format.
How I built it
Preparing the training data
I used VisText-Mosquito version 2, published on Mendeley Data under CC BY 4.0, as the source for the container detection and water segmentation tasks. The dataset includes annotated container images and water-surface masks. Dataset source.
I wrote a preparation script to make the data usable for AquaPulse. It removes identified stock-photo previews, collapses brightness-augmented copies, removes duplicate images, converts annotations, and maps the source labels to the application's classes. I also kept source, attribution, exclusion, and split manifests.
For detection, the five classes are used tire, plastic container, plant pot, coconut shell, and drain inlet. For segmentation, I merged the source water labels into one water class.
I grouped near-duplicate images and photos taken in short bursts before assigning the splits. This reduces the chance of training on one photo and testing on a very similar photo from the same scene. The current manifests contain no scene group shared across splits. The split assignment uses seed 42 and targets approximately 70% training, 20% validation, and 10% testing.
| Prepared task | Training images | Validation images | Test images | Total |
|---|---|---|---|---|
| Container detection | 1,132 | 341 | 167 | 1,640 |
| Water segmentation | 89 | 33 | 19 | 141 |
Training the local models
I fine-tuned pretrained Ultralytics YOLO11 checkpoints for the two tasks. I used PyTorch and CUDA inside a Linux Docker container for training, then exported checkpoints to ONNX for inference in the web application. YOLO11 documentation.
I compared nano and small detector models on the cleaned data. I also ran a separate small-detector experiment with stock previews retained to examine how that data variant affected the results.
| Training run | Starting checkpoint | Epoch limit / completed | Batch size |
|---|---|---|---|
| Clean nano detector | YOLO11n | 50 / 45 | 16 |
| Clean small detector | YOLO11s | 50 / 50 | 12 |
| Small detector with stock previews | YOLO11s | 50 / 50 | 12 |
| Nano water segmenter | YOLO11n-seg | 100 / 62 | 16 |
| Small water segmenter | YOLO11s-seg | 200 / 200 | 12 |
All runs use a 640-pixel input setting and training seed 0. The configurations include training-time augmentation and early-stopping patience. The completed epoch counts come from the saved training logs, rather than assuming every run reached its configured limit.
Evaluating the detector
I selected the detection threshold on the validation split, choosing the highest threshold in a 0.05-step grid that still reached 80% overall bounding-box recall. I then evaluated the test split at that threshold, matching the predicted class and using an intersection-over-union threshold of 0.5.
The clean detector results are:
| Model | Selected threshold | Test precision | Test box recall | Test F1 | Test mAP50 | Test mAP50-95 |
|---|---|---|---|---|---|---|
| YOLO11n | 0.35 | 75.43% | 82.59% | 78.85% | 0.7834 | 0.5057 |
| YOLO11s | 0.25 | 76.33% | 81.65% | 78.90% | 0.7550 | 0.5325 |
Both clean runs use the same 167-image test split, containing 316 annotated objects. I saved per-class results, image-level recall, confusion matrices, and confidence-calibration outputs as well.
There are limits to these results. The clean test split has no background-only images, so it cannot establish the image-level false-alarm rate. The tire class has only three test objects, which is too little evidence to claim reliable performance for that class.
The stock-inclusive detector reached mAP50 0.8270 on its own 191-image test set. That is a different data variant, so I do not treat it as a direct improvement over the clean model on the same benchmark. Its test box recall was 77.02%, even though the validation threshold met the 80% recall target.
Running the models in the app
The application's default detector is the clean YOLO11n ONNX model. The default water model is the YOLO11s-seg ONNX checkpoint. These paths can be changed through configuration.
The backend runs them with ONNX Runtime on the CPU. OpenCV and NumPy handle image preprocessing, bounding-box filtering, non-maximum suppression, and mask processing.
The water model was trained on water inside containers. I therefore use it only in the container reporting mode, and count a predicted water region only when it is associated with a detected container. It supports the assessment; the reporter's answer about standing water remains important. I do not use it as a general river-water or pollution segmentation model.
Connecting the Kimi API
For scene descriptions, I integrated kimi-k3 through Alibaba Cloud Model Studio's OpenAI-compatible chat-completions endpoint, using HTTPX in the backend. The API key stays in server-side environment configuration.
The request includes a resized, re-encoded image and a prompt in the reader's language. It asks for JSON containing the visible signs, certainty levels, an explanation, limitations, and whether human review is needed. The backend parses the response and filters claims outside the application's scope.
I added retries for temporary failures and a cache keyed by the processed image and language. A repeated request can reuse the cached response. If the API fails, the result records the failure rather than inventing an image description.
Kimi is an external model used through an API. The models I fine-tuned are the YOLO detector and water segmenters. The code also includes adapters for local Qwen through Ollama and Gemini; the current local demo uses Kimi.
Combining the evidence
I built a rule-based scoring and review layer around the model outputs and reporter answers.
The fusion layer starts with source weights of 0.5 for the detector, 0.3 for the scene-description model, and 0.2 for the reporter, with the reporter weight adjusted by recorded reliability. It renormalizes the weights over the sources that actually provide evidence for each sign. A detector that was skipped does not count as evidence that a sign is absent.
Risk and confidence are shown separately. Confidence combines source agreement, coverage, and image quality. These are application rules, not a calibrated probability that water is safe or that disease will occur.
A sign suggested only by the scene-description model can trigger a question or review without becoming a confirmed finding. Serious signs and model disagreements go to verification. Unverified river reports remain at yellow; raising them to orange requires an on-site volunteer confirmation, and red requires an expert.
For report trends, I use a minimum-data rule and a one-sided binomial test. This helps avoid calling a change from one report to two reports a confirmed worsening trend.
Building the backend, maps, and integrations
The backend uses Python and FastAPI. PostgreSQL stores observations, assessments, alerts, review events, missions, and contribution records. PostGIS handles distances, nearby reports, hotspots, and links to canal sections.
The frontend uses HTML, CSS, JavaScript, and Leaflet. Canal geometry comes from OpenStreetMap. Open-Meteo supplies rainfall context when available. The OneAquaHealth API supplies published monitoring records, and Google News RSS supplies article titles, sources, dates, and links.
I keep those sources distinct. A news headline is context, and a laboratory measurement is a reference record. Neither is silently turned into a citizen observation or mixed into its score.
The API covers image analysis, report submission and confirmation, maps, passports, verification, alerts, missions, notifications, community profiles, dashboard metrics, and FHIR exports. The practical-question translator uses rules and stored data rather than a language model.
Quality checks, privacy, testing, and deployment
Before analysis, the image quality gate checks size, brightness, and sharpness. Duplicate handling uses image hashes and stored report context. Submitted photos are re-encoded to remove EXIF metadata, and the face-blurring path uses a YuNet detector. Reviewers have protected access to stored report photos, while public locations are rounded and reporter identifiers are omitted from public map results.
There are still privacy limits: automatic face blurring depends on the detector being available, license-plate blurring is not implemented, and API-based scene analysis sends the processed image to the external provider.
I added automated tests for scoring, source conflicts, image quality, reports, verification, community actions, bilingual output, and external-data handling. I also used Playwright to exercise the browser workflow and check the demonstration.
For deployment, I used Docker Compose on an Amazon Linux AWS EC2 instance, with separate application, PostGIS, and Caddy services. Caddy provides HTTPS, which also allows browser geolocation when the user grants permission. Database records and photos use persistent volumes. The local demo has a separate database and clearly labeled sample reports and activities.
Challenges I ran into
The first challenge was the training data. Duplicate scenes and augmented copies could make evaluation look better than it really was. Cleaning the data and splitting by scene groups took work, and some classes still had very few examples.
The second was keeping each model within its training task. A container detector cannot assess an entire river surface, and a small water dataset does not make a model reliable for every kind of water image. I had to make the reporting mode control which models run.
The scene-description model could also suggest signs that were not supported by the reporter or another source. I added confirmation questions, uncertainty handling, and human review instead of accepting every suggestion as a fact.
Connecting the rest of the workflow was another challenge. A review decision needs to update the relevant report, alert, and contribution records consistently. Duplicate submissions also need to avoid awarding points twice.
I ran into practical issues too: Windows restrictions affected the training setup, browser location access required HTTPS, and changing the interface language initially lost analysis results. I moved training into a Linux container, configured HTTPS, and fixed the language-switch behavior.
Accomplishments that I'm proud of
I am proud that I completed both the model work and the application around it: data preparation, fine-tuning, evaluation, ONNX inference, API integration, and the reporting-to-follow-up workflow.
The project has working maps, canal passports, evidence-based review, community missions, contribution points, dashboards, and Vietnamese and English interfaces.
I also made the source and status of information visible. Users can distinguish a citizen observation, a model suggestion, a verified finding, a published monitoring record, and a news article.
The demo demonstrates the complete workflow with labeled sample data. Its simulated review and cleanup activities illustrate the application; they do not prove a real improvement in water quality or public health.
What I learned
I learned that data preparation and evaluation choices can matter as much as the model size. A larger model did not automatically give better results on every metric, and a good overall score could hide a weak class.
I learned how to connect local computer vision models with an external scene-description API while keeping their responsibilities separate. I also gained experience with spatial databases, asynchronous web services, bilingual interfaces, and deployment.
The biggest lesson was to make uncertainty part of the product. A useful result should explain what was observed, where the evidence came from, and what someone still needs to check.
What's next for AquaPulse
I want to test AquaPulse with a small group of residents, volunteers, and environmental organizations, and use their feedback to simplify reporting and verification.
For the models, I want to collect more representative local images, especially for rare classes, background scenes, different lighting conditions, and signs that the current detector does not cover. I also want an independent local evaluation set and stronger water segmentation evaluation before expanding its use.
For the application, I want to improve mobile reporting, notifications, reviewer account management, and photo storage and backup. I also want to add license-plate protection and make missing privacy components more visible.
My next goal is a small field pilot that follows real observations through verification and documented action. Confirming water contamination or water safety would still require appropriate sampling and laboratory assessment.
Built With
- alibaba-cloud-model-studio
- aws-ec2
- caddy
- css
- docker
- fastapi
- html
- javascript
- kimi-api
- leaflet.js
- numpy
- ollama
- onnx-runtime
- open-meteo
- opencv
- openstreetmap
- postgis
- postgresql
- python
- pytorch
- ultralytics
- yolo11

Log in or sign up for Devpost to join the conversation.