Inspiration
Tiruppur is one of India's largest textile manufacturing hubs, home to hundreds of dyeing and processing units. For years, untreated and poorly treated effluent from these units has degraded local water bodies like the Noyyal river, turning stretches of it into a toxic, discolored sewer that has damaged farmland and harmed the community that depends on it. While the city has made real progress with wastewater recycling systems, violations still happen — often at night or during heavy rain, when they're hardest to catch and report.
I wanted to build something simple: a way for any resident to become a monitor. If pollution can be reported the moment it's seen, with AI helping verify and classify it instantly, communities and authorities gain a real-time, crowdsourced early-warning system instead of relying on occasional official inspections.
What it does
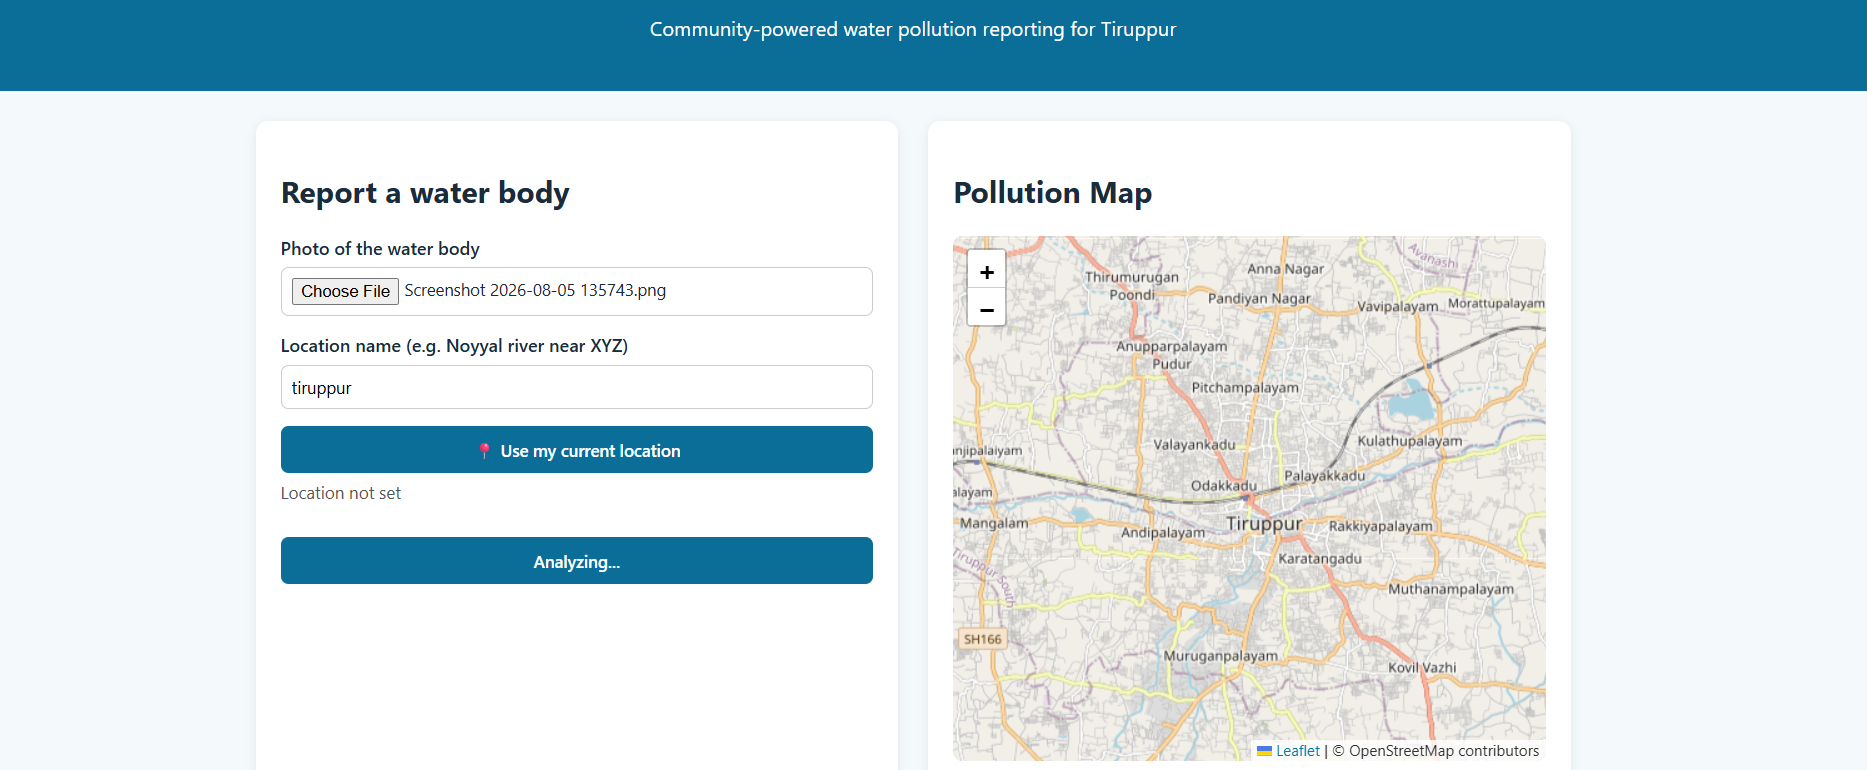
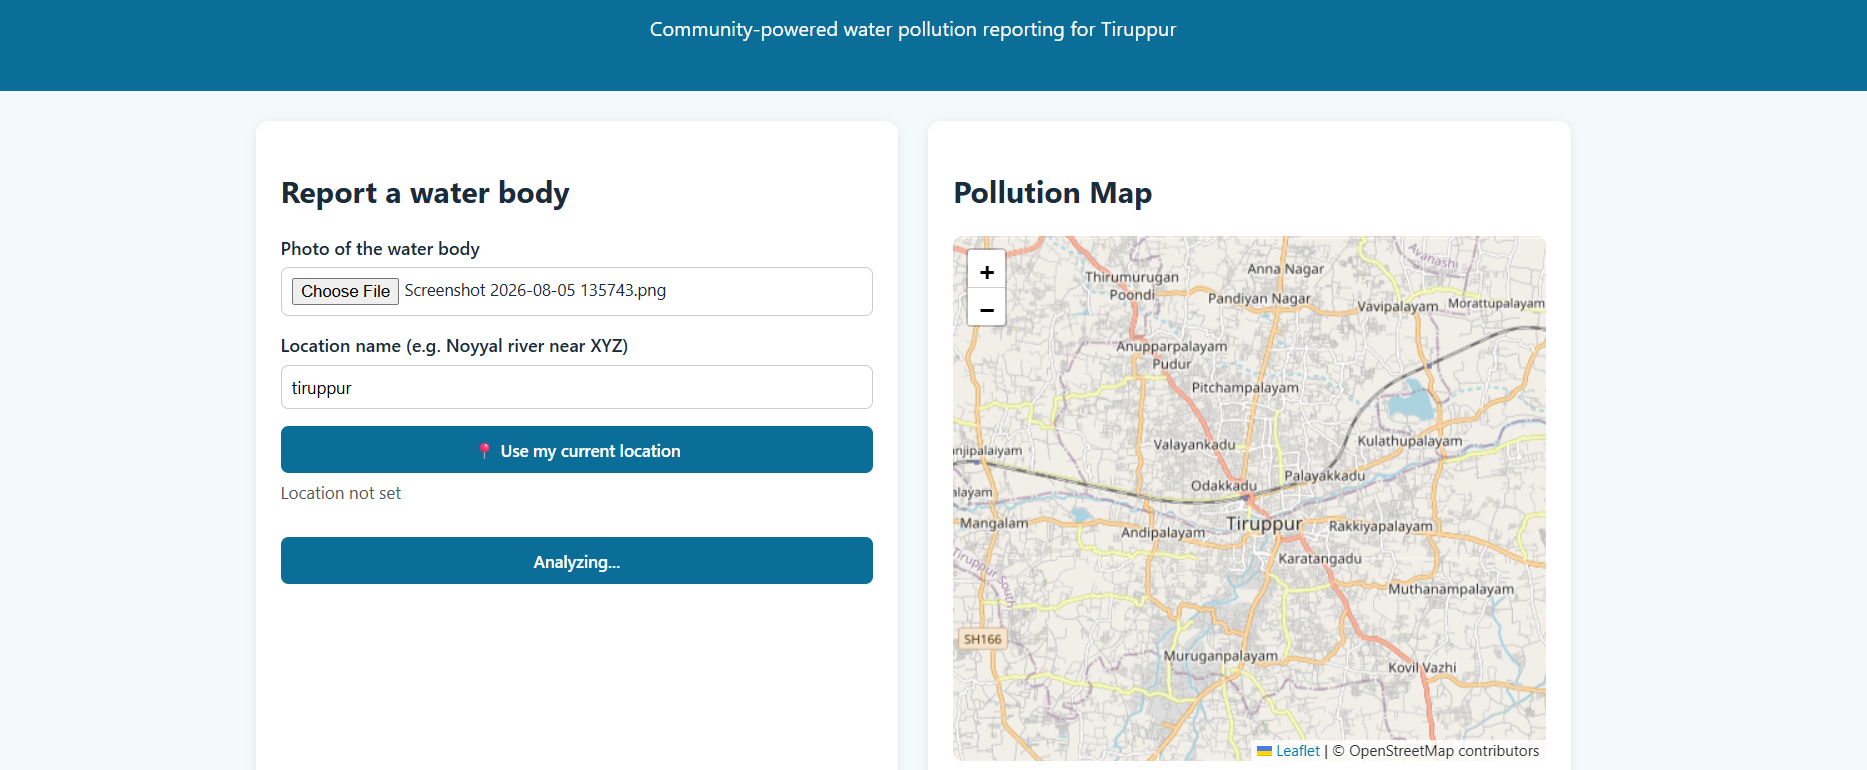
AquaGuard lets anyone photograph a water body — a river, canal, or pond — and instantly get an AI-powered pollution assessment. The app:
- Accepts a photo and location from the user
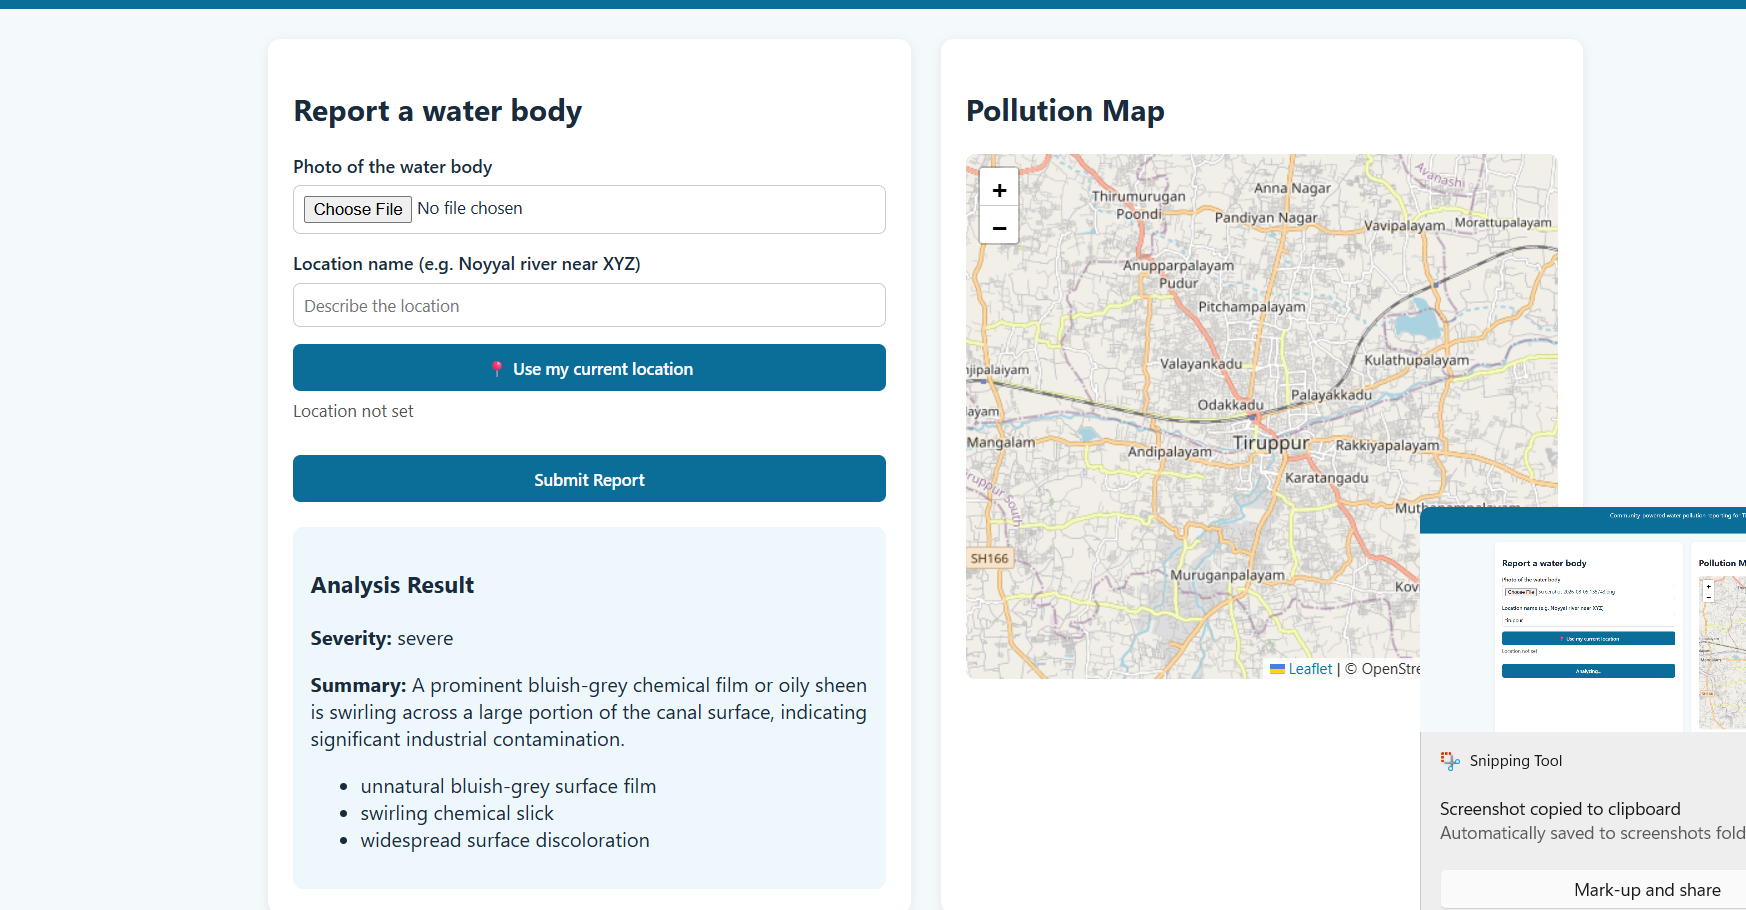
- Uses Google's Gemini AI to analyze the image for visible signs of dye/industrial pollution (unnatural water color, foam, oily sheen, sludge, distressed vegetation)
- Returns a severity rating (none / low / moderate / severe) with a plain-language explanation
- Plots every report on a live map centered on Tiruppur, so pollution hotspots and patterns become visible over time
- Stores all reports so trends can be tracked as more people contribute
How I built it
- Backend: Python (Flask) handling image uploads, database storage, and coordinating the AI pipeline
- AI: Google Gemini API (multimodal image analysis) — we send the uploaded photo along with a structured prompt asking the model to assess pollution indicators and return a strict JSON response we can parse and display
- Frontend: HTML, CSS, and JavaScript, with Leaflet.js for the interactive pollution map
- Database: SQLite for lightweight, fast local storage of reports (location, severity, AI summary, timestamp)
- Geolocation: Browser Geolocation API so reports can be pinned to real coordinates
Challenges I ran into
- Getting Gemini's response into consistent, parseable JSON took careful prompt engineering — we had to explicitly constrain the output format and handle edge cases where the model added extra text
- Managing API keys and environment variables correctly across a fresh local setup was trickier than expected, and taught us a lot about how
.envfiles and Python's environment loading actually work under the hood - Balancing severity classification to be genuinely reliable (not flagging clean water as polluted, or missing clear pollution) required testing with both clean and visibly polluted sample images
Accomplishments that I am proud of
I built a fully working, end-to-end pipeline — from photo upload to real AI analysis to a live map — as first-time builders of an AI-powered application. Every core feature works: image analysis, severity classification, geolocation, and persistent storage.
What I learned
I learned how to integrate a real generative AI API into a working web application, how to structure a Flask backend
What's next for AquaGuard
- Add a public dashboard showing pollution trends over time per location
- Notify local environmental authorities automatically when severe pollution is reported
- Expand detection to include water sample color analysis for more precise severity scoring
- Build a lightweight mobile-first version for easier reporting on the go

Log in or sign up for Devpost to join the conversation.