-
-
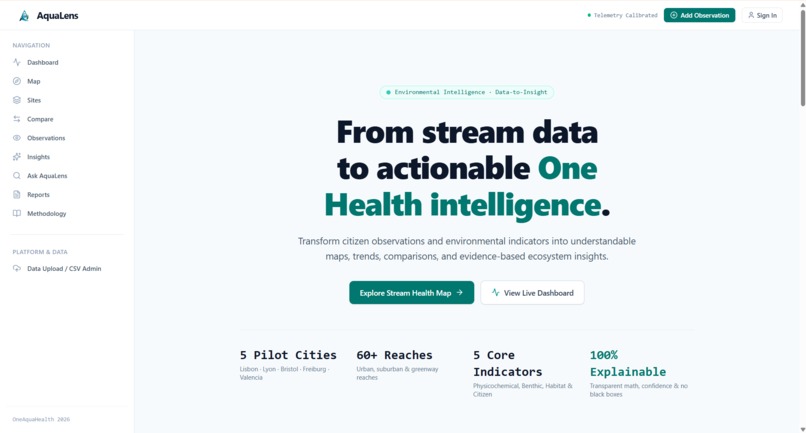
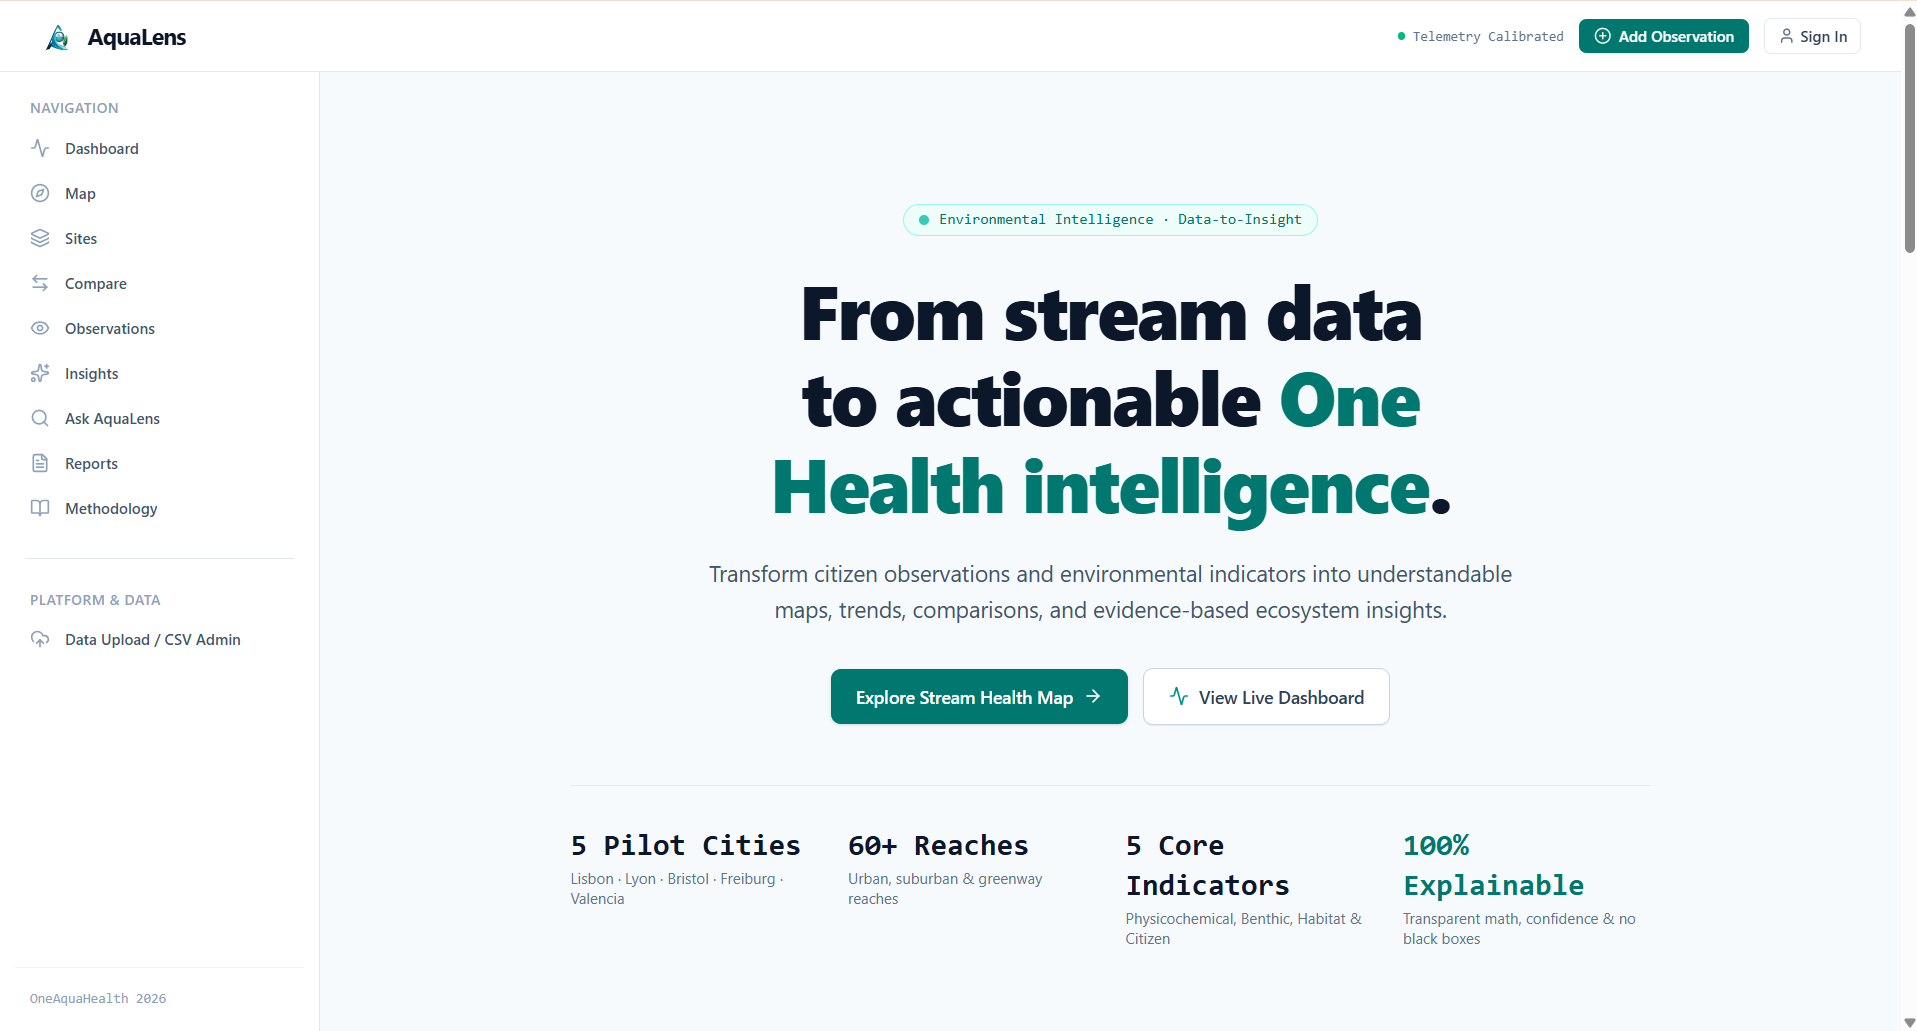
Dashboard
-
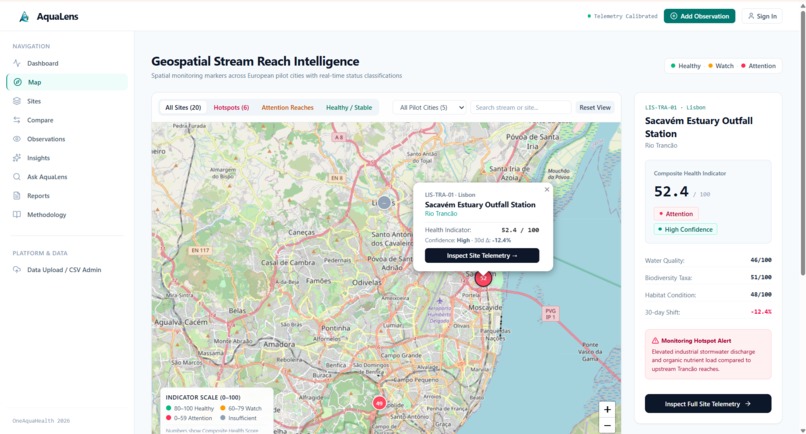
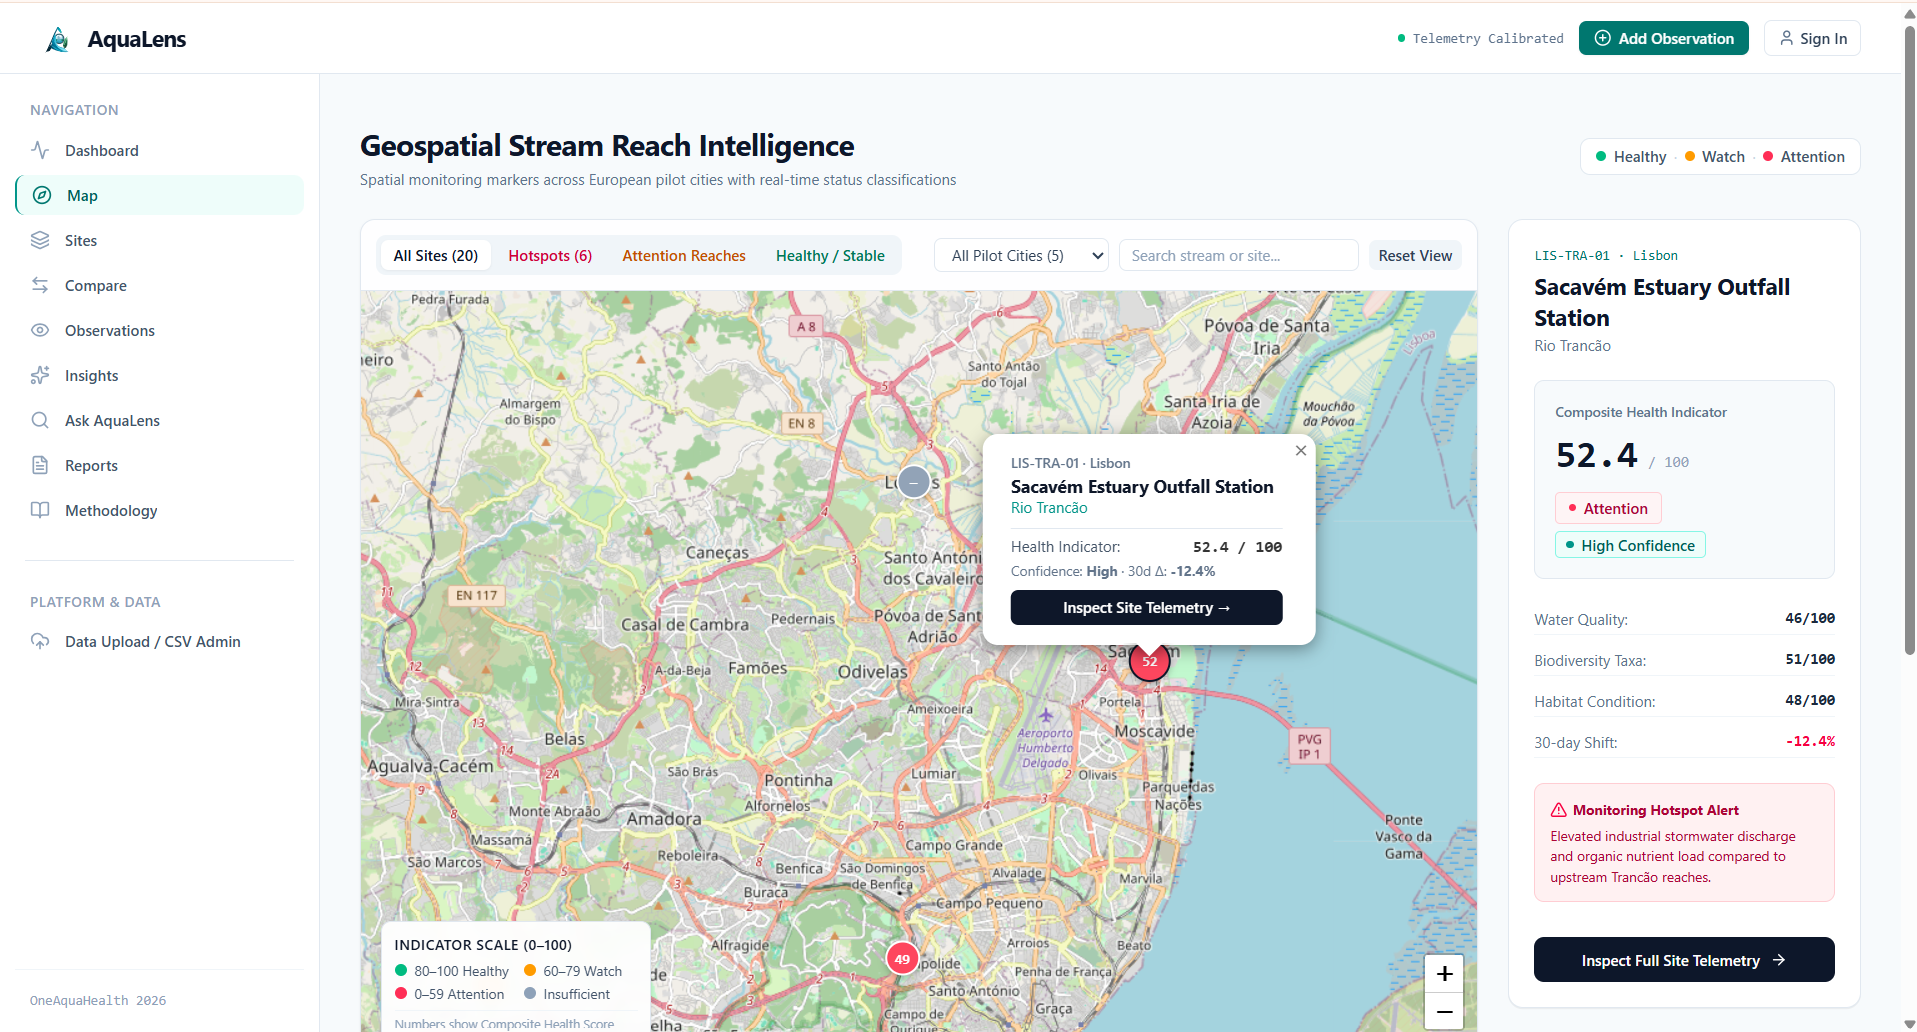
Map page
-
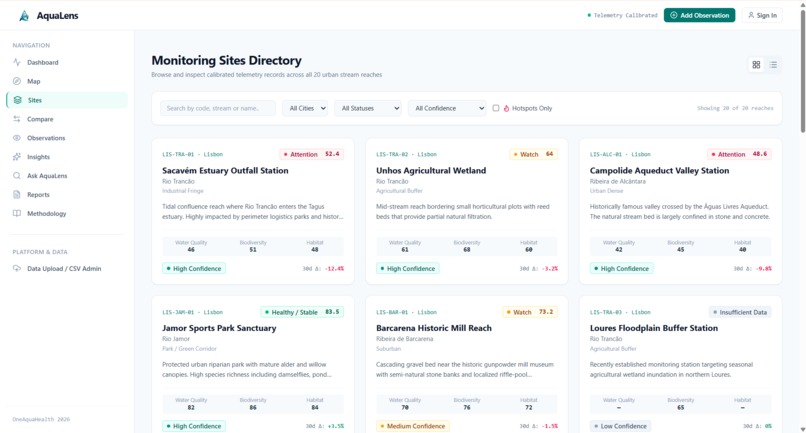
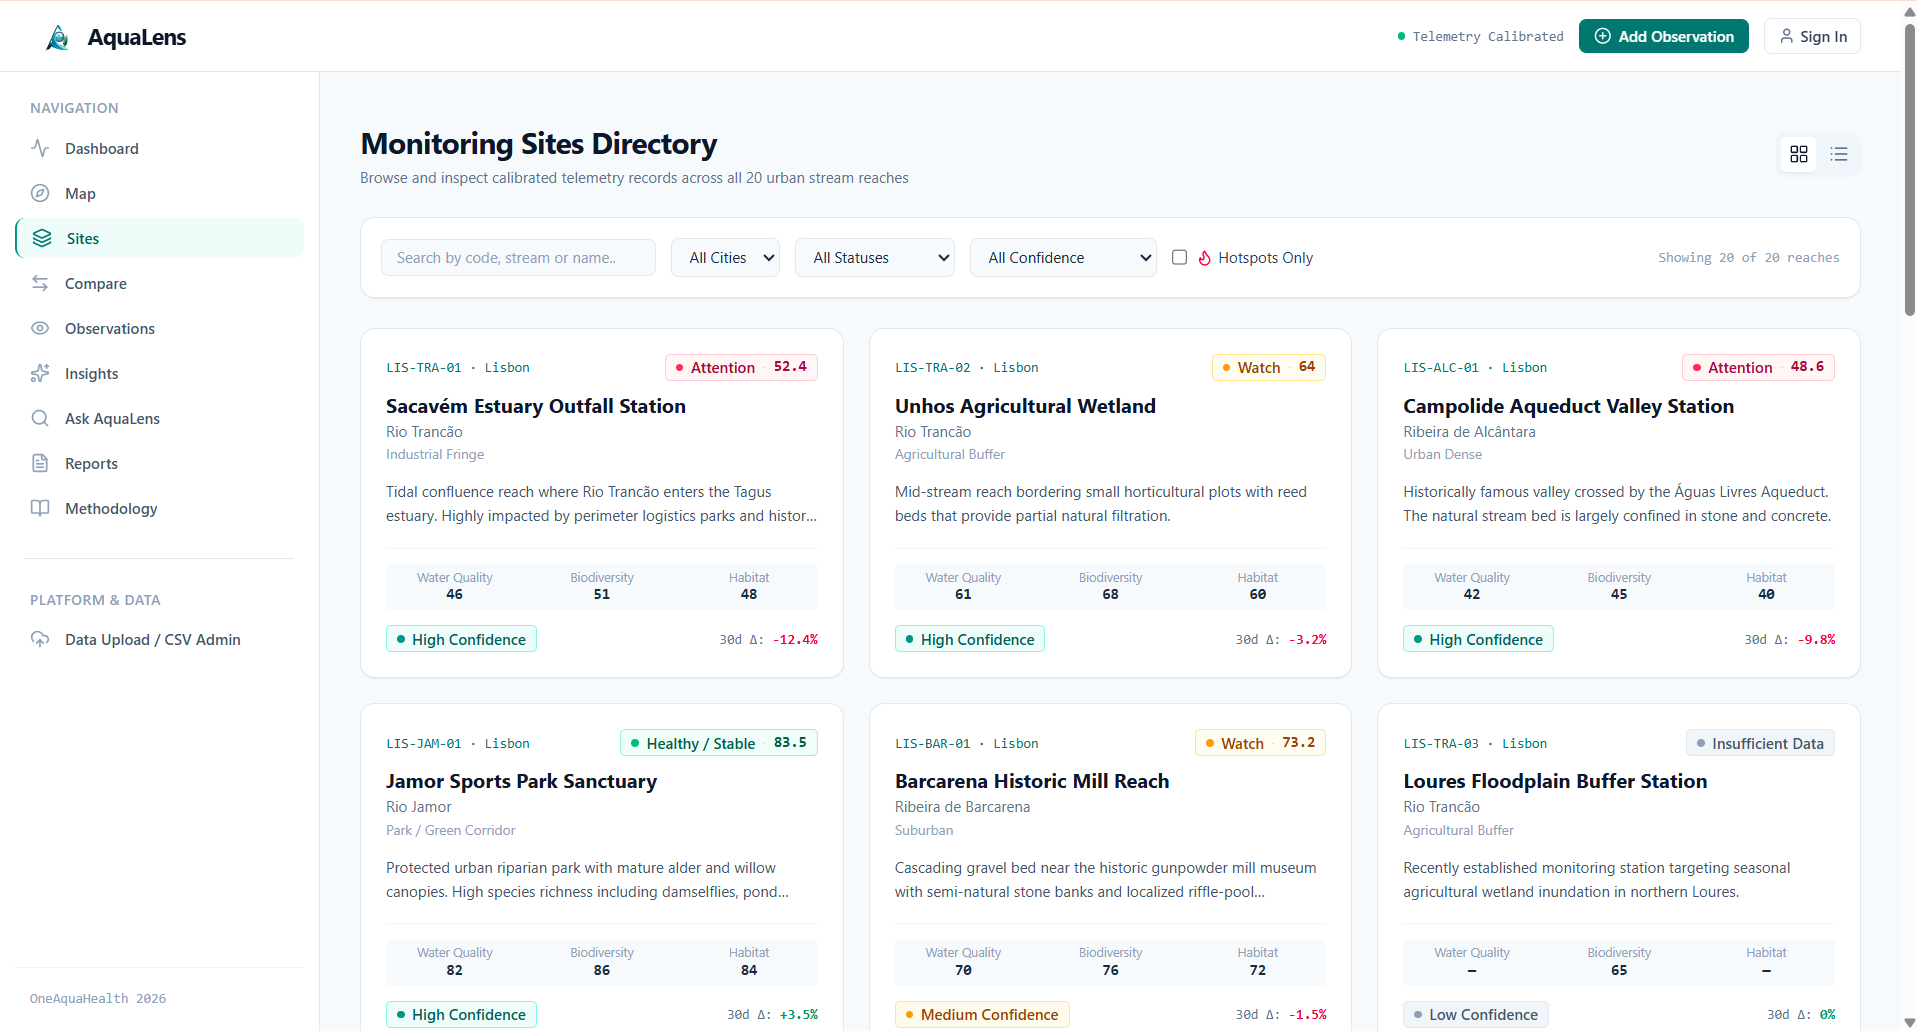
Sites page
-
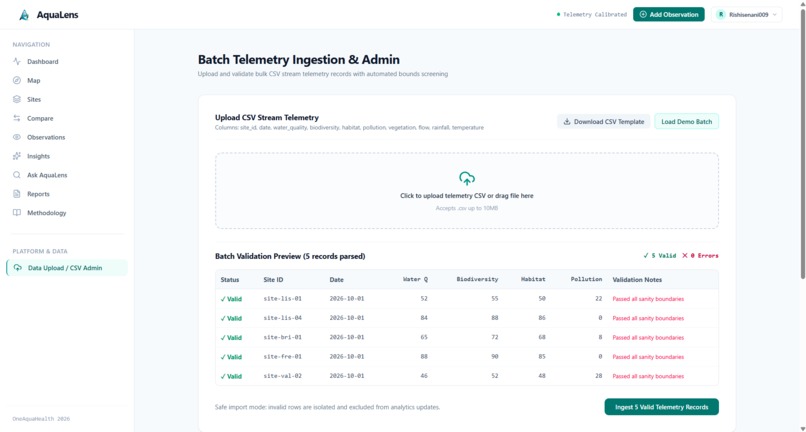
sample data upload
-
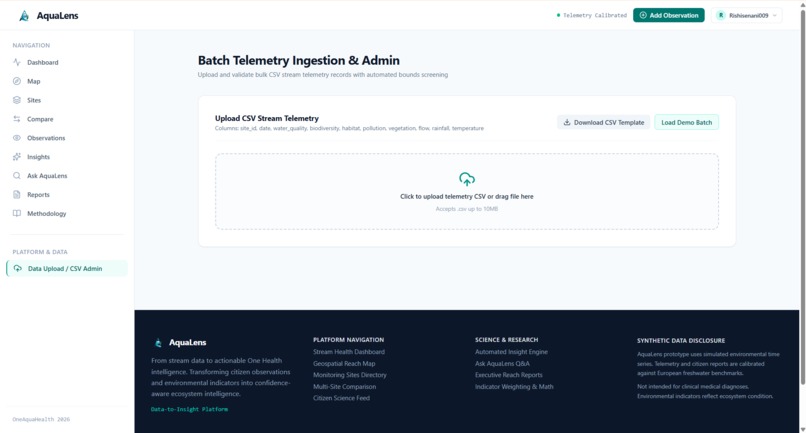
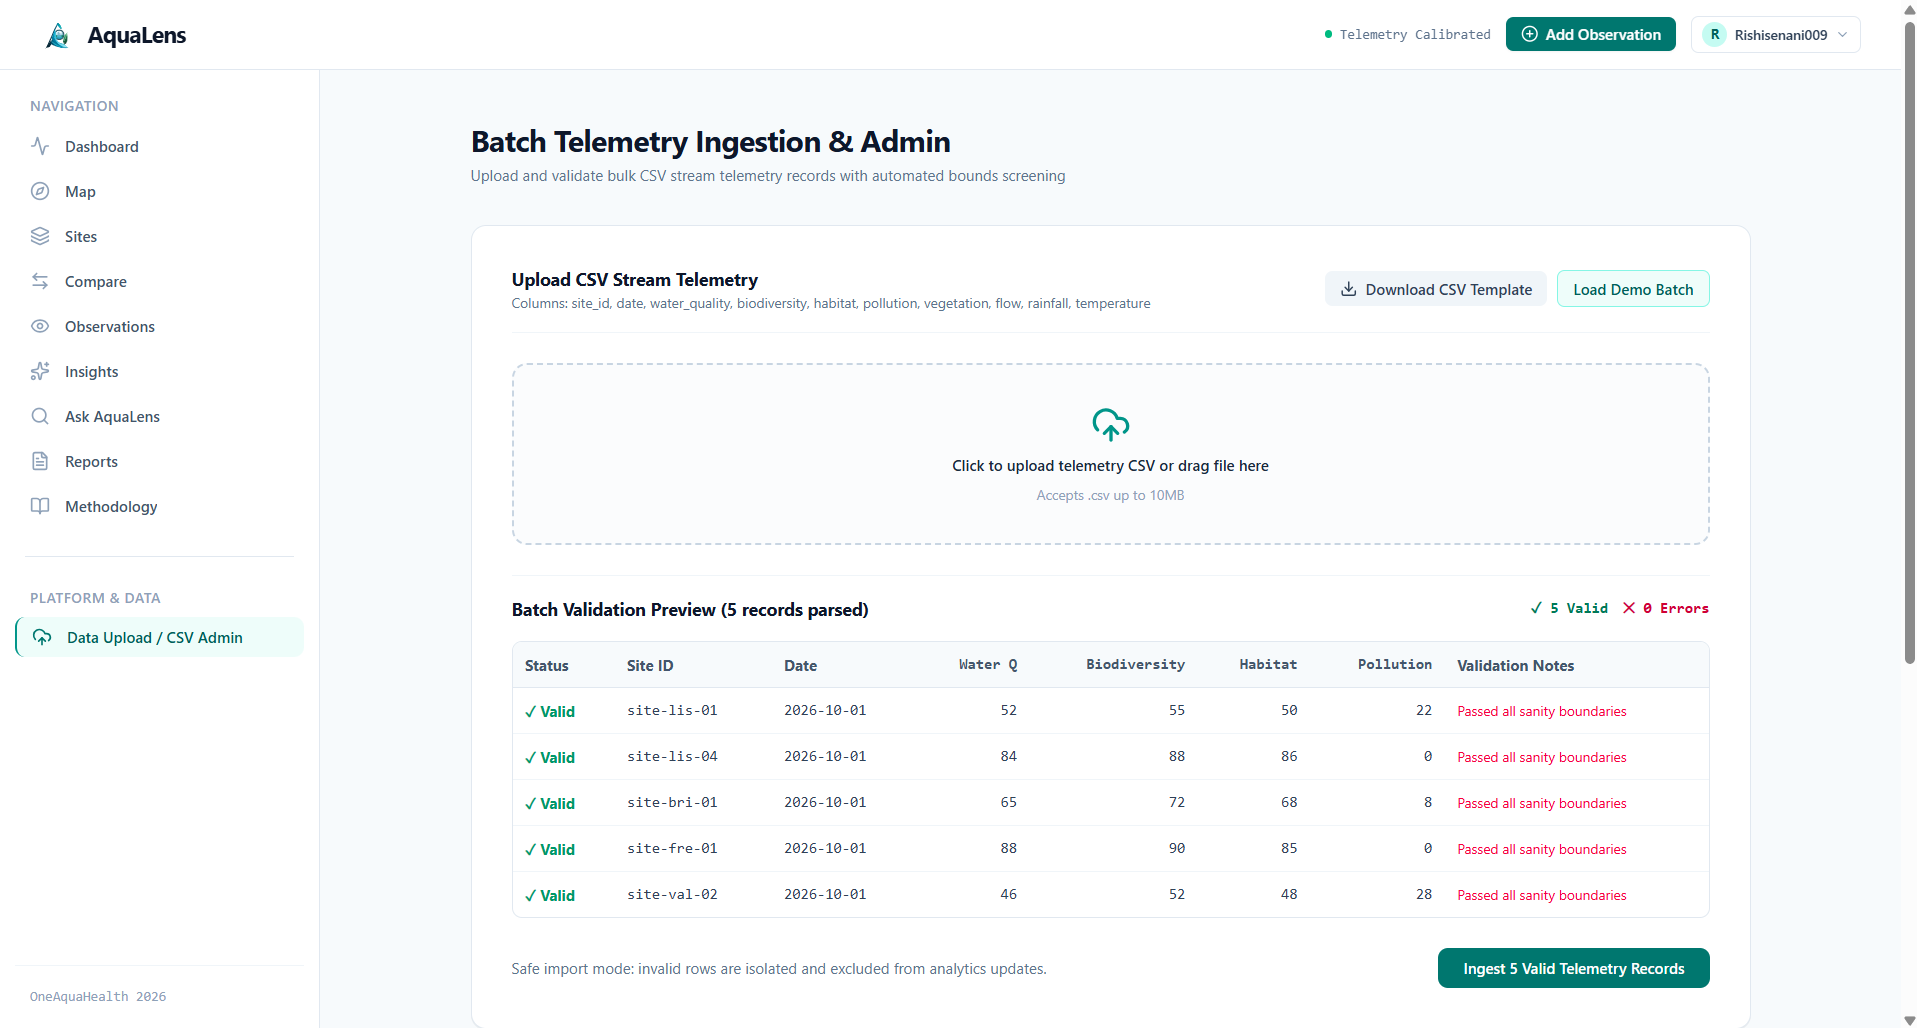
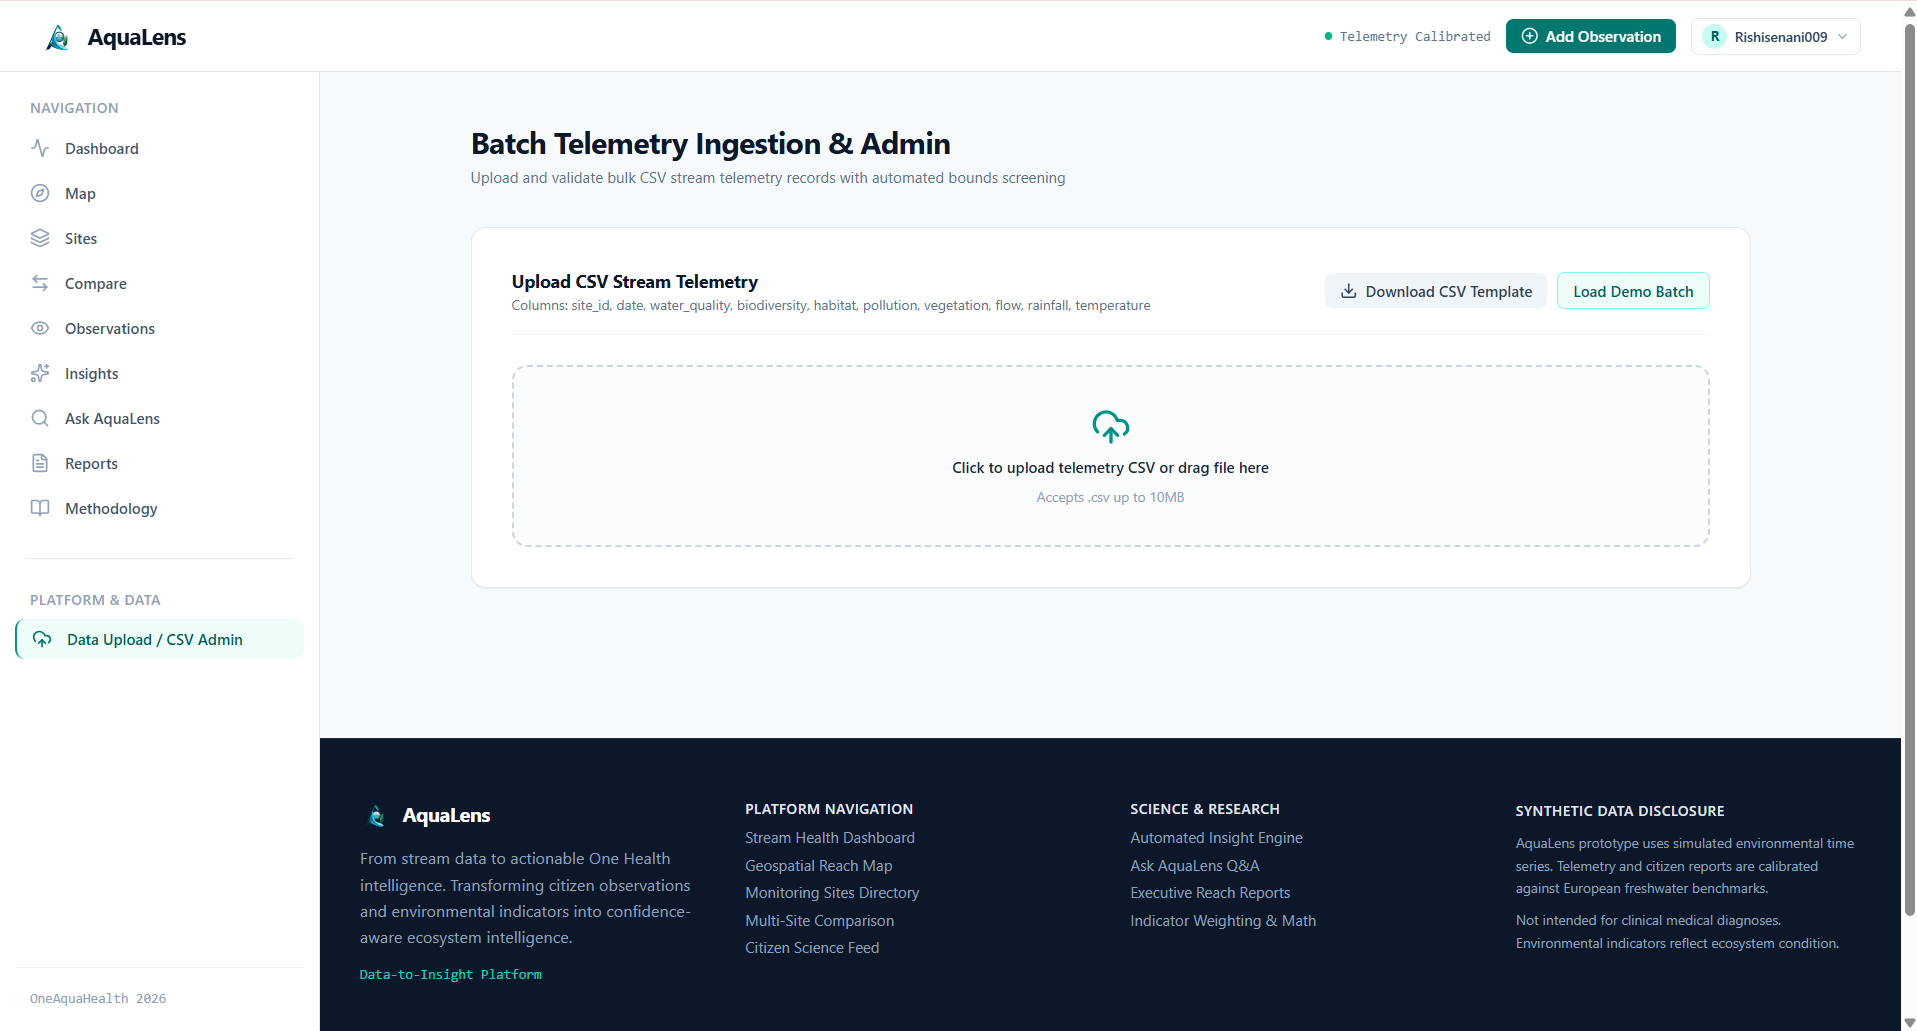
Data Upload page
-
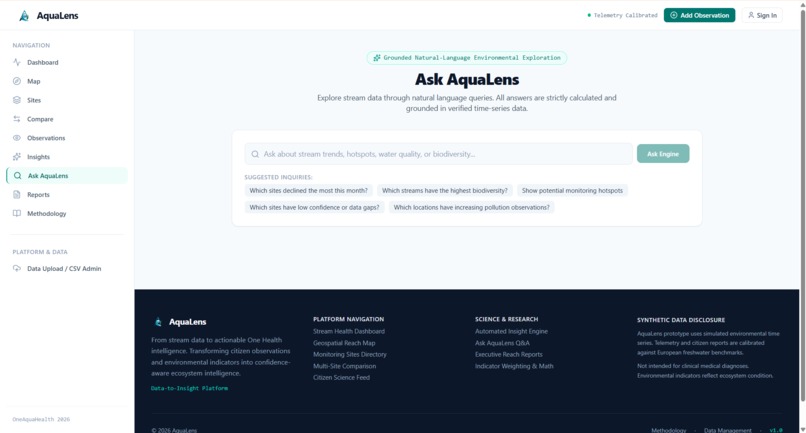
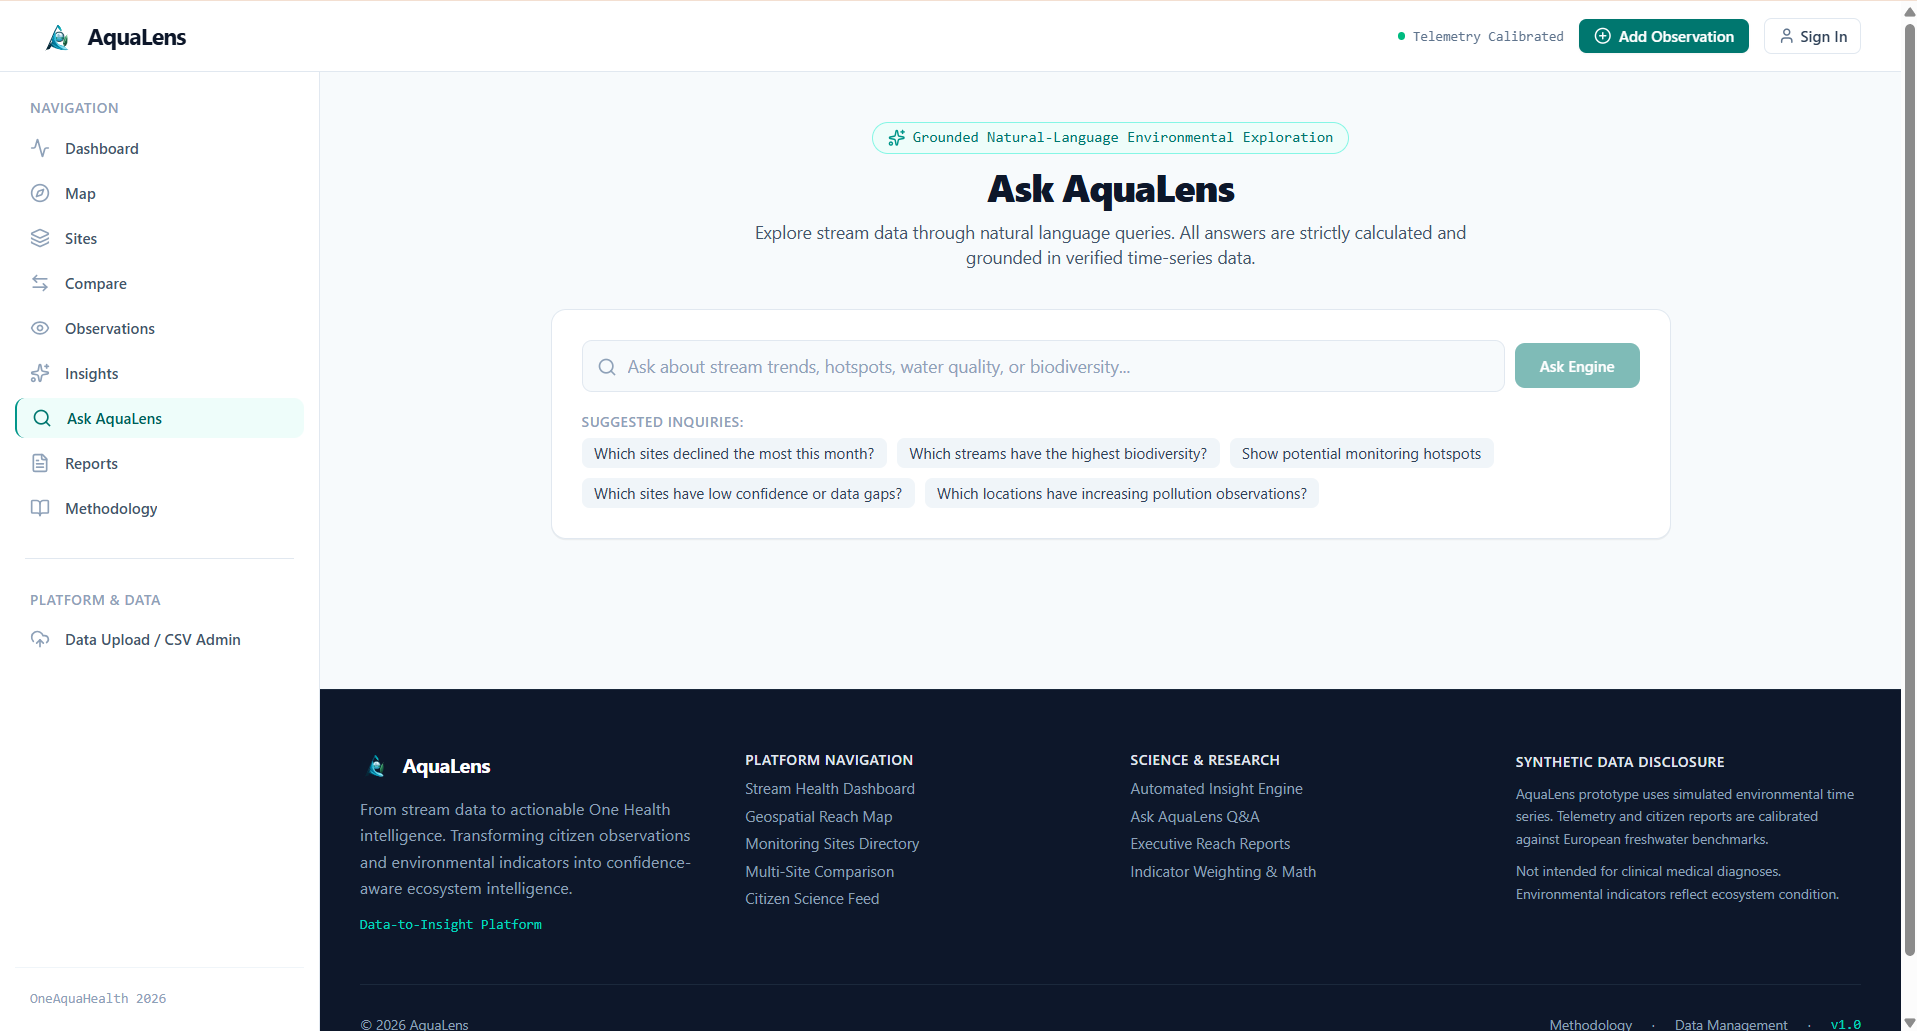
Ask AquaLens page
-
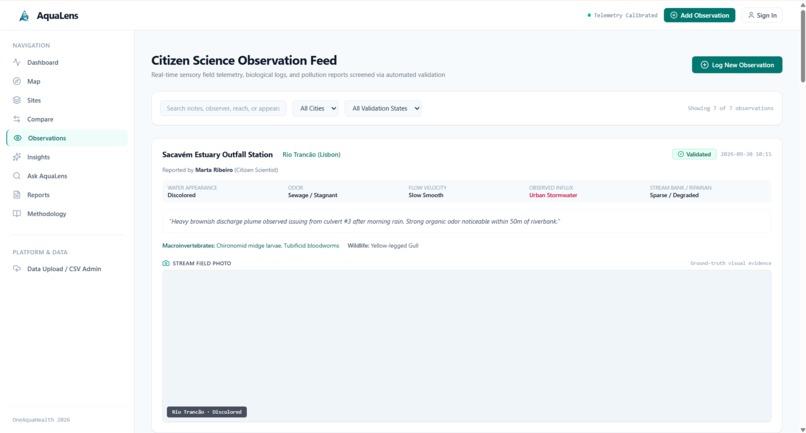
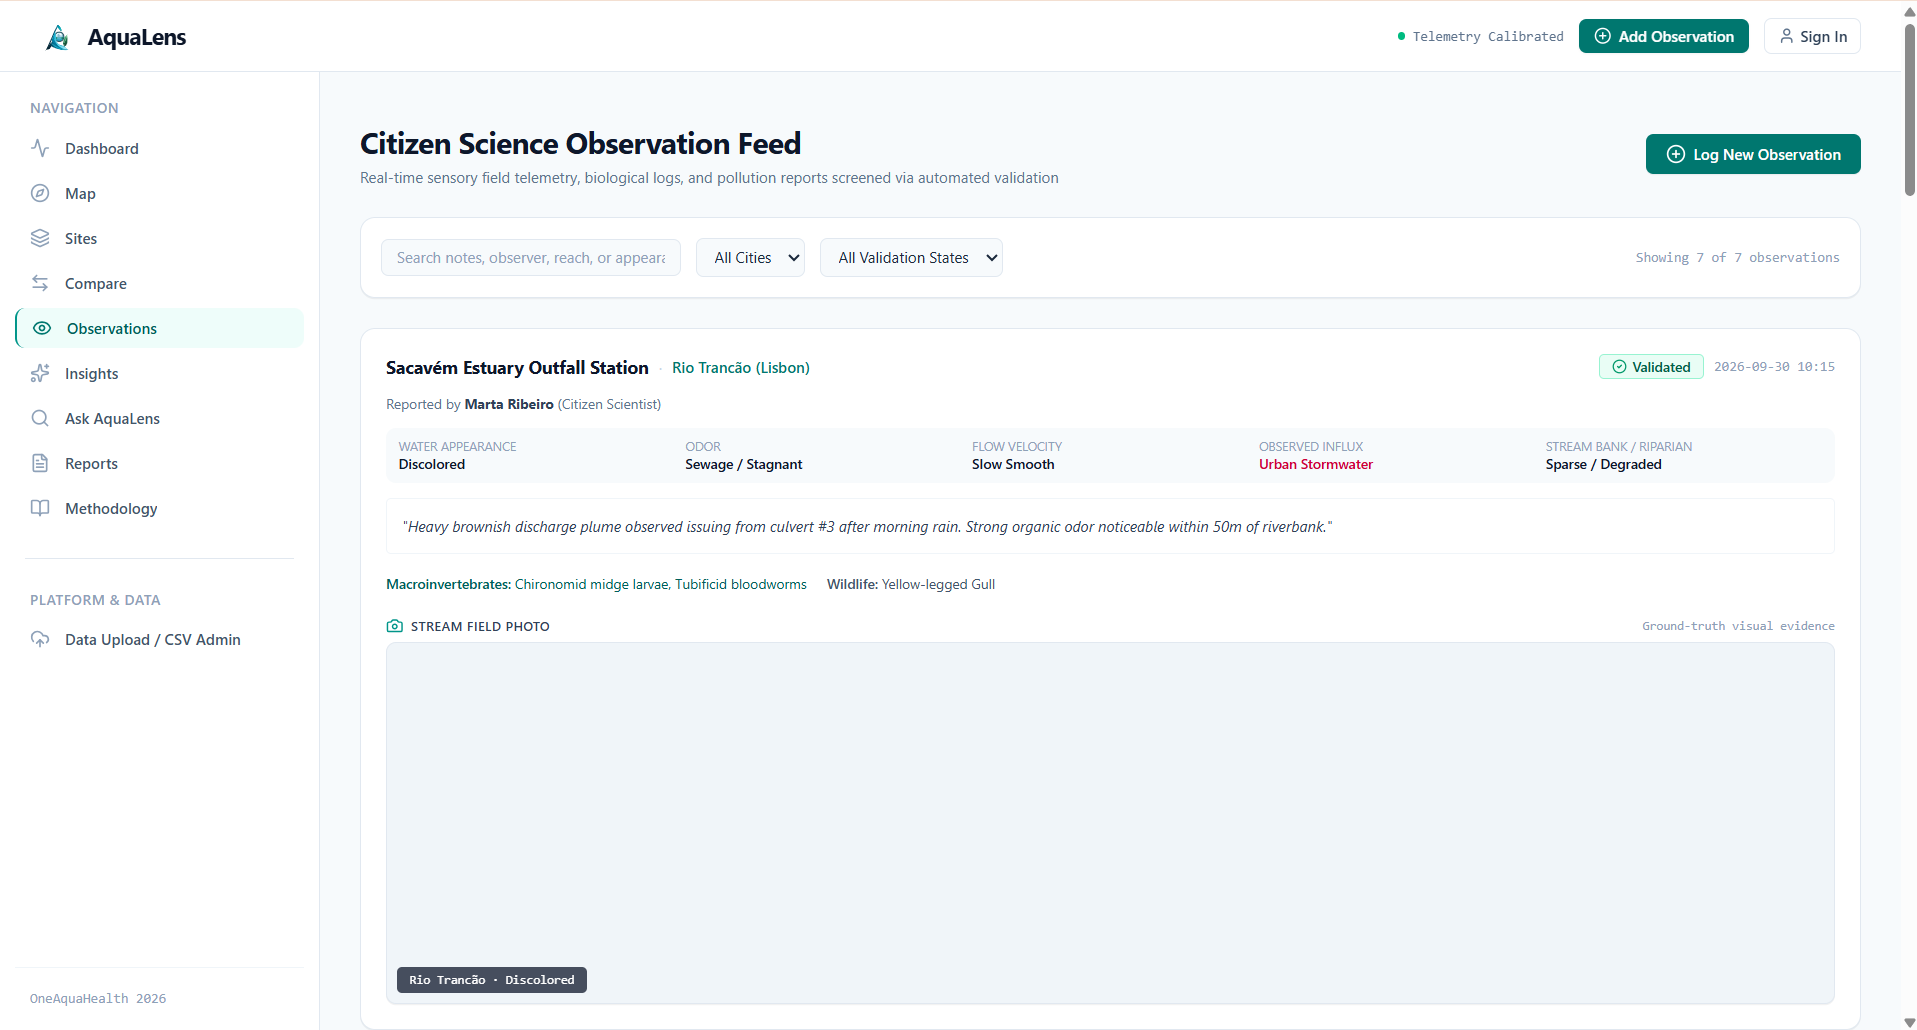
Observations page
-
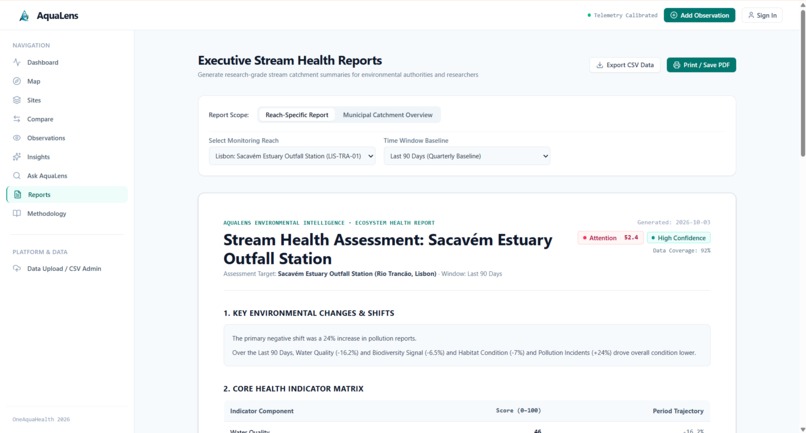
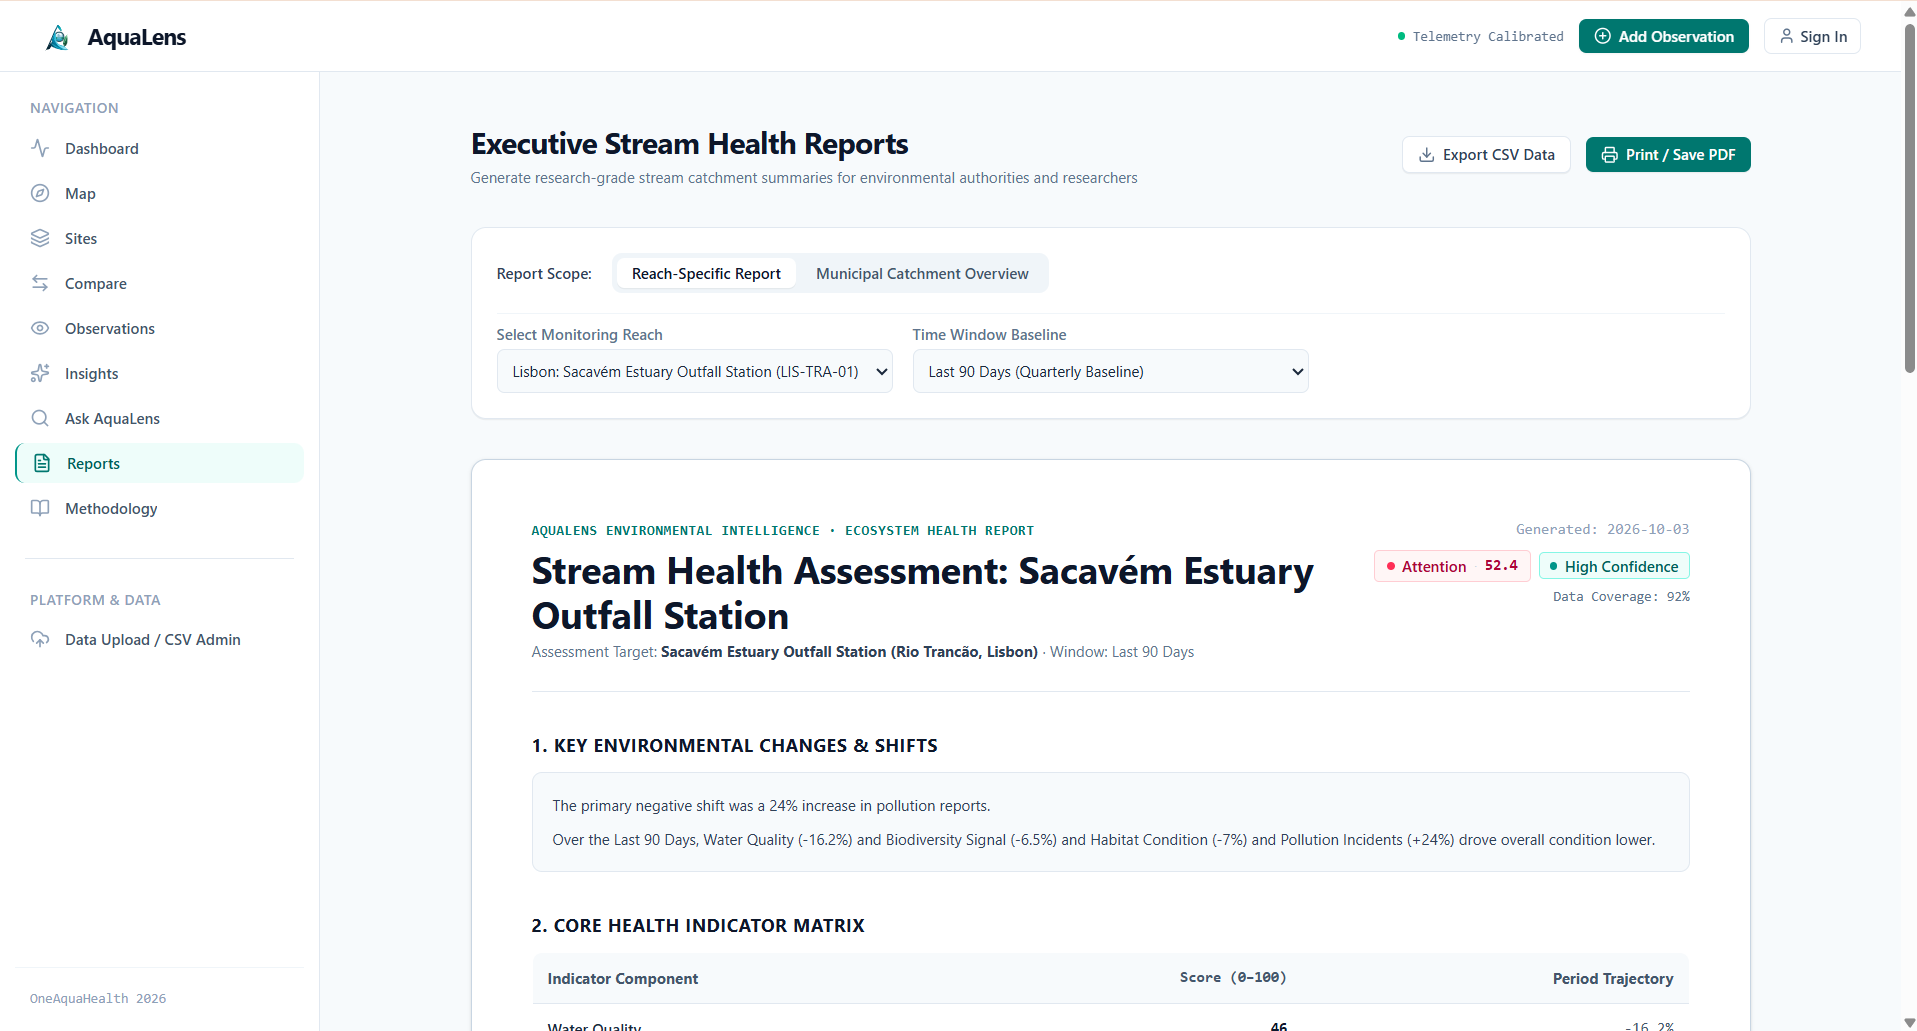
Reports page
-
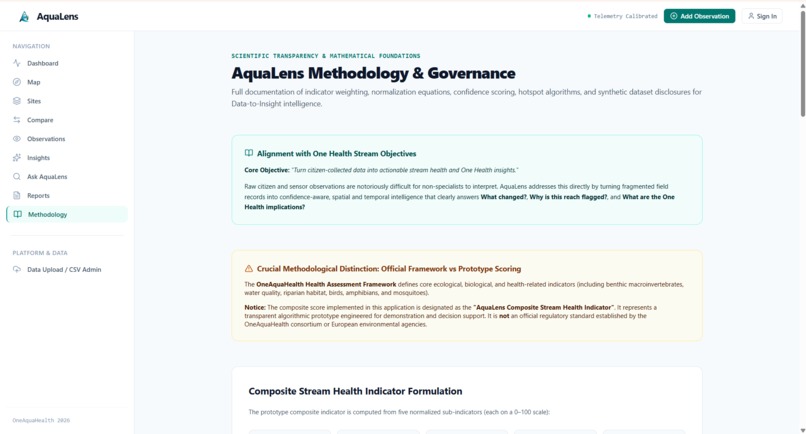
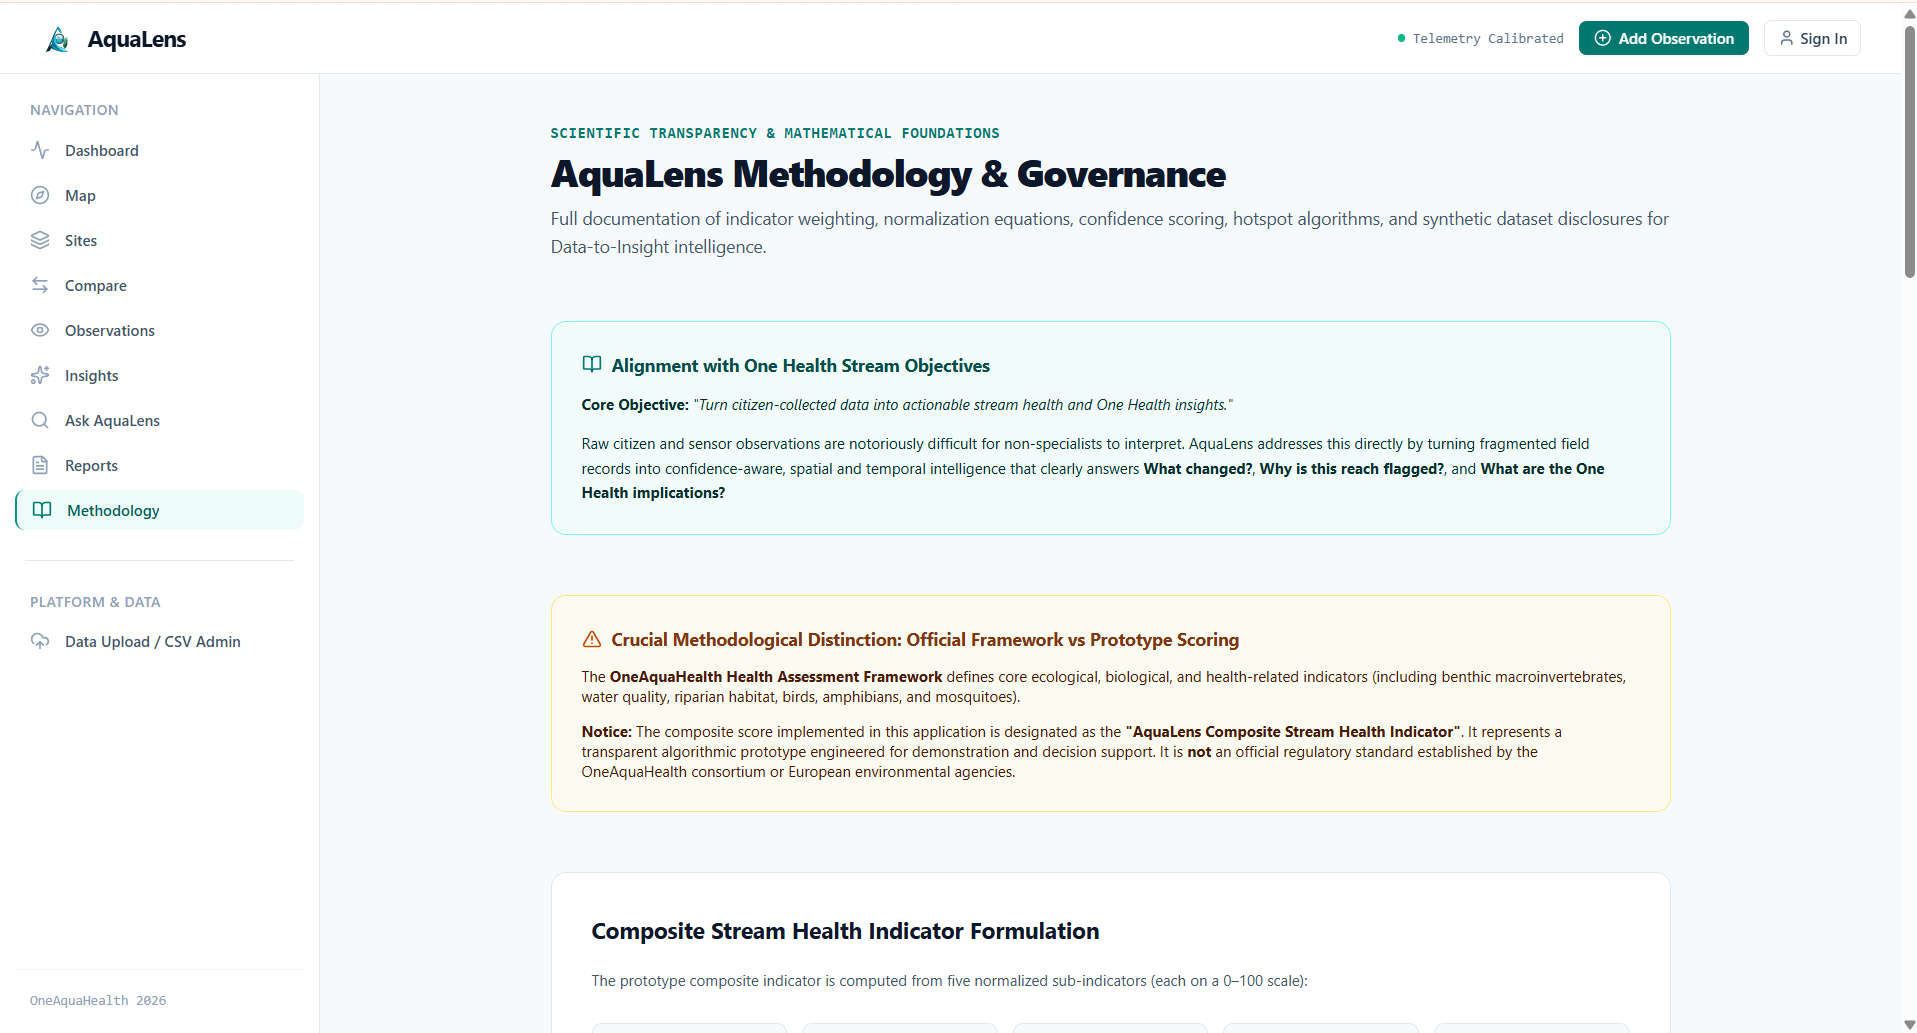
Methodology page
-
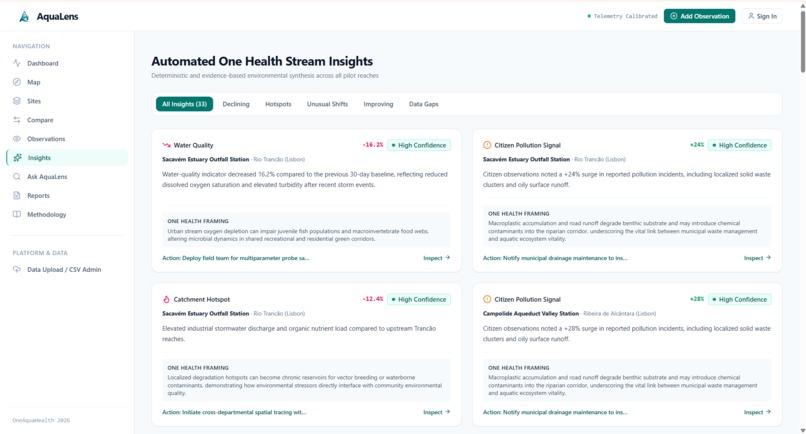
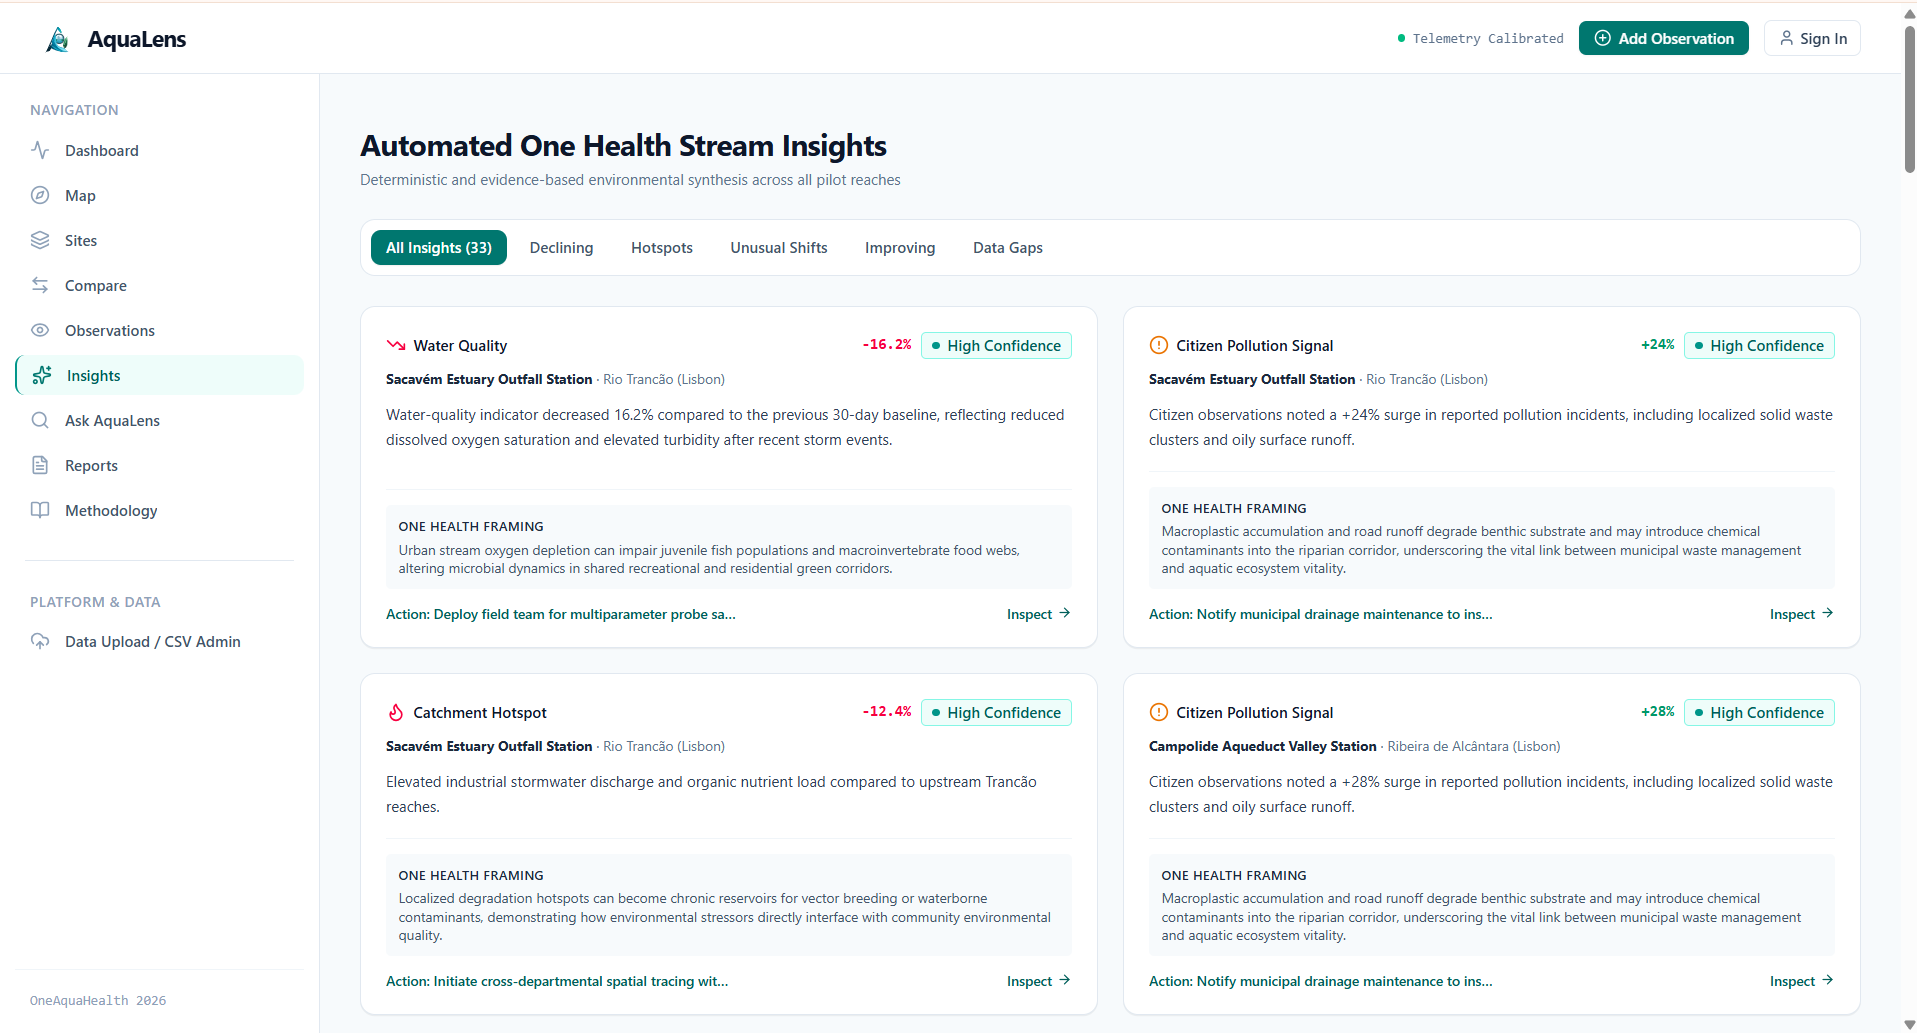
Insights page
-
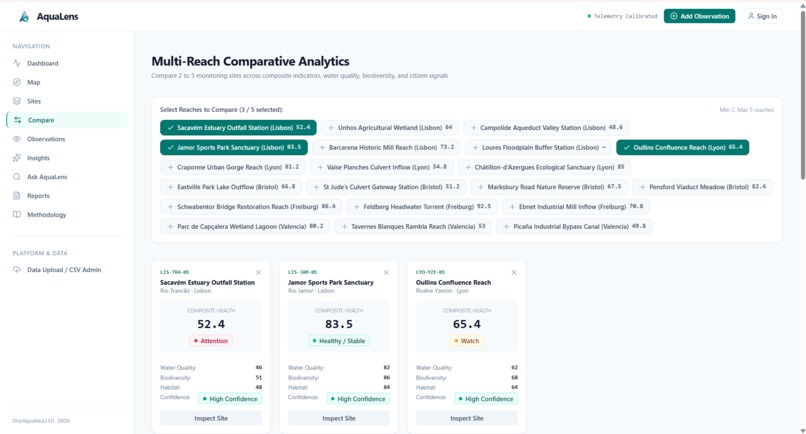
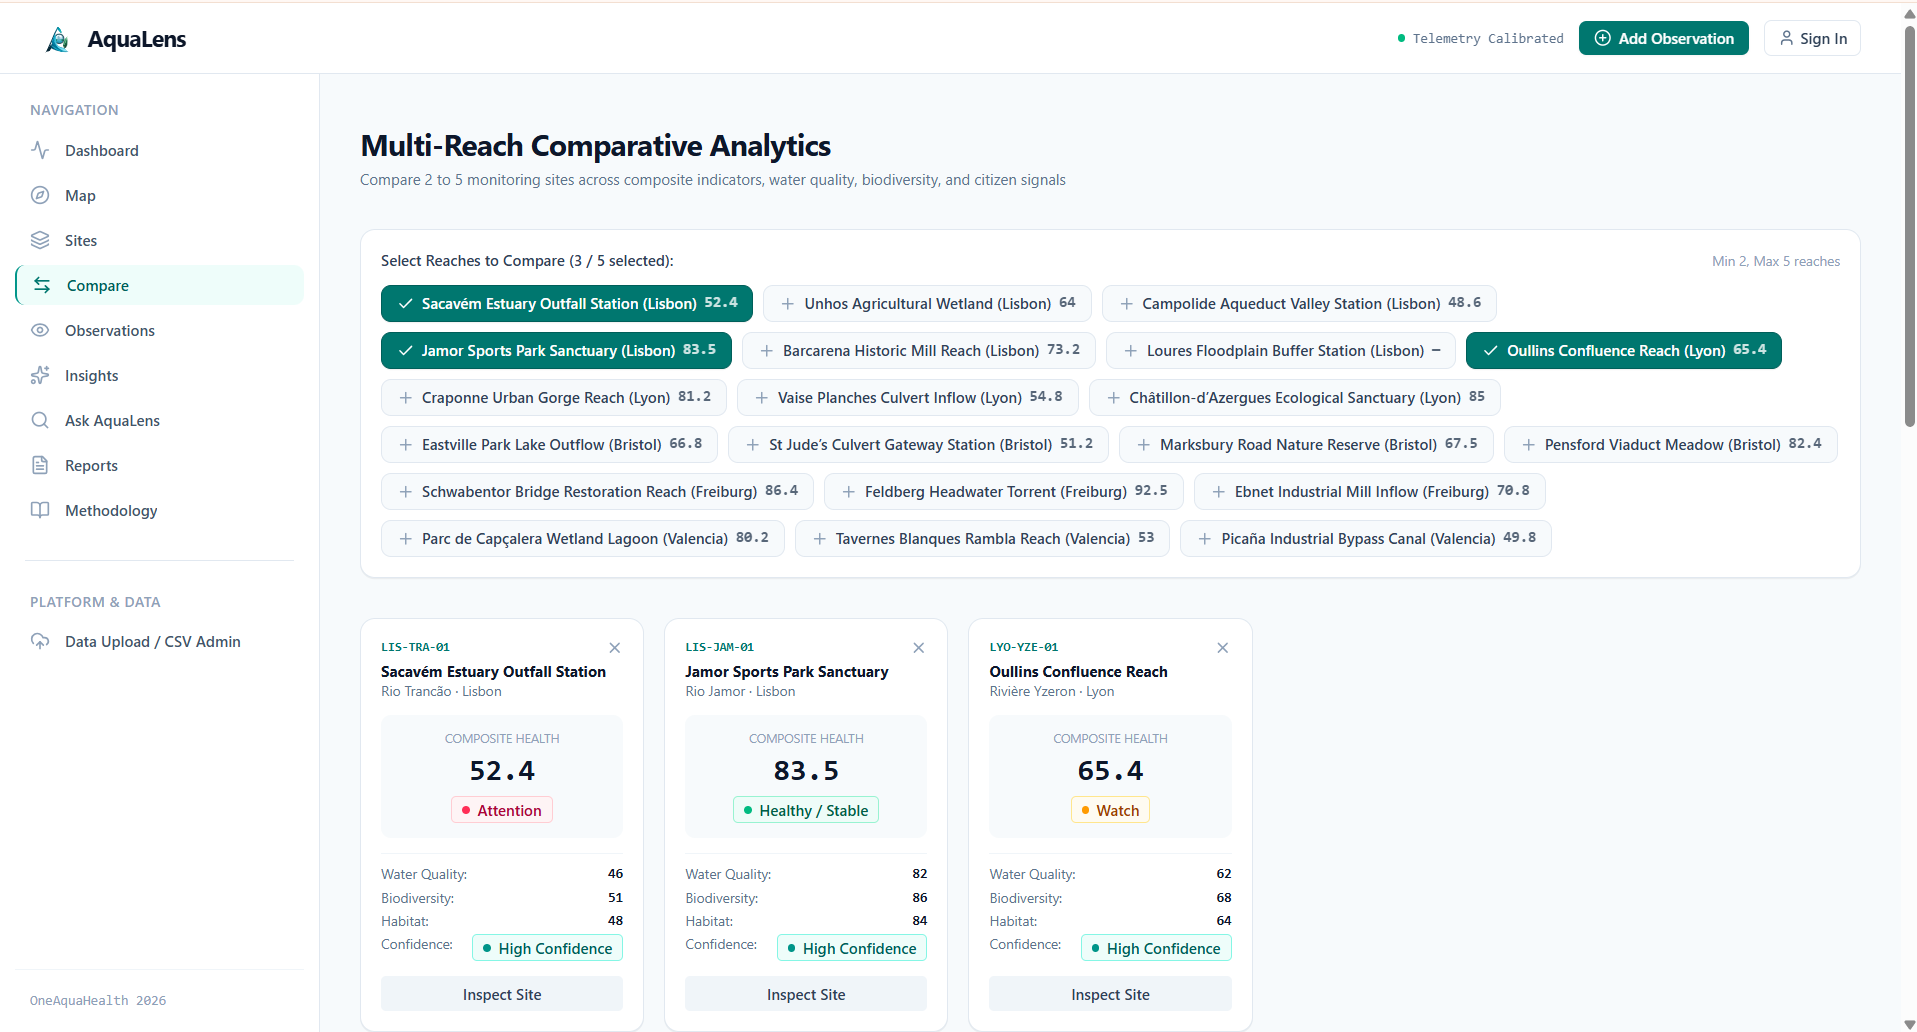
Compare page
-
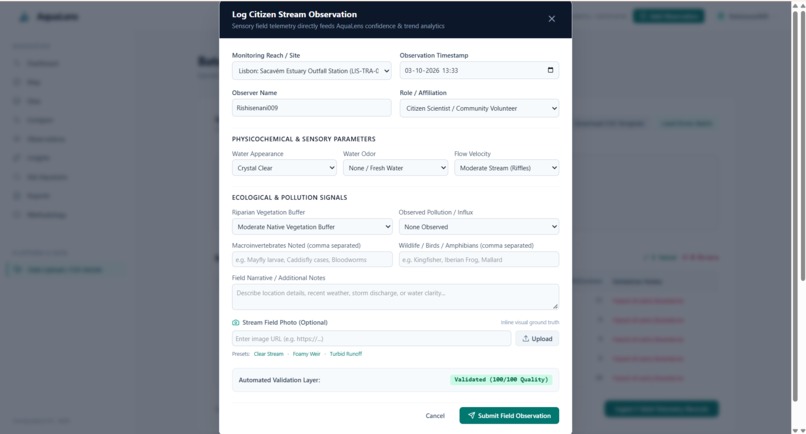
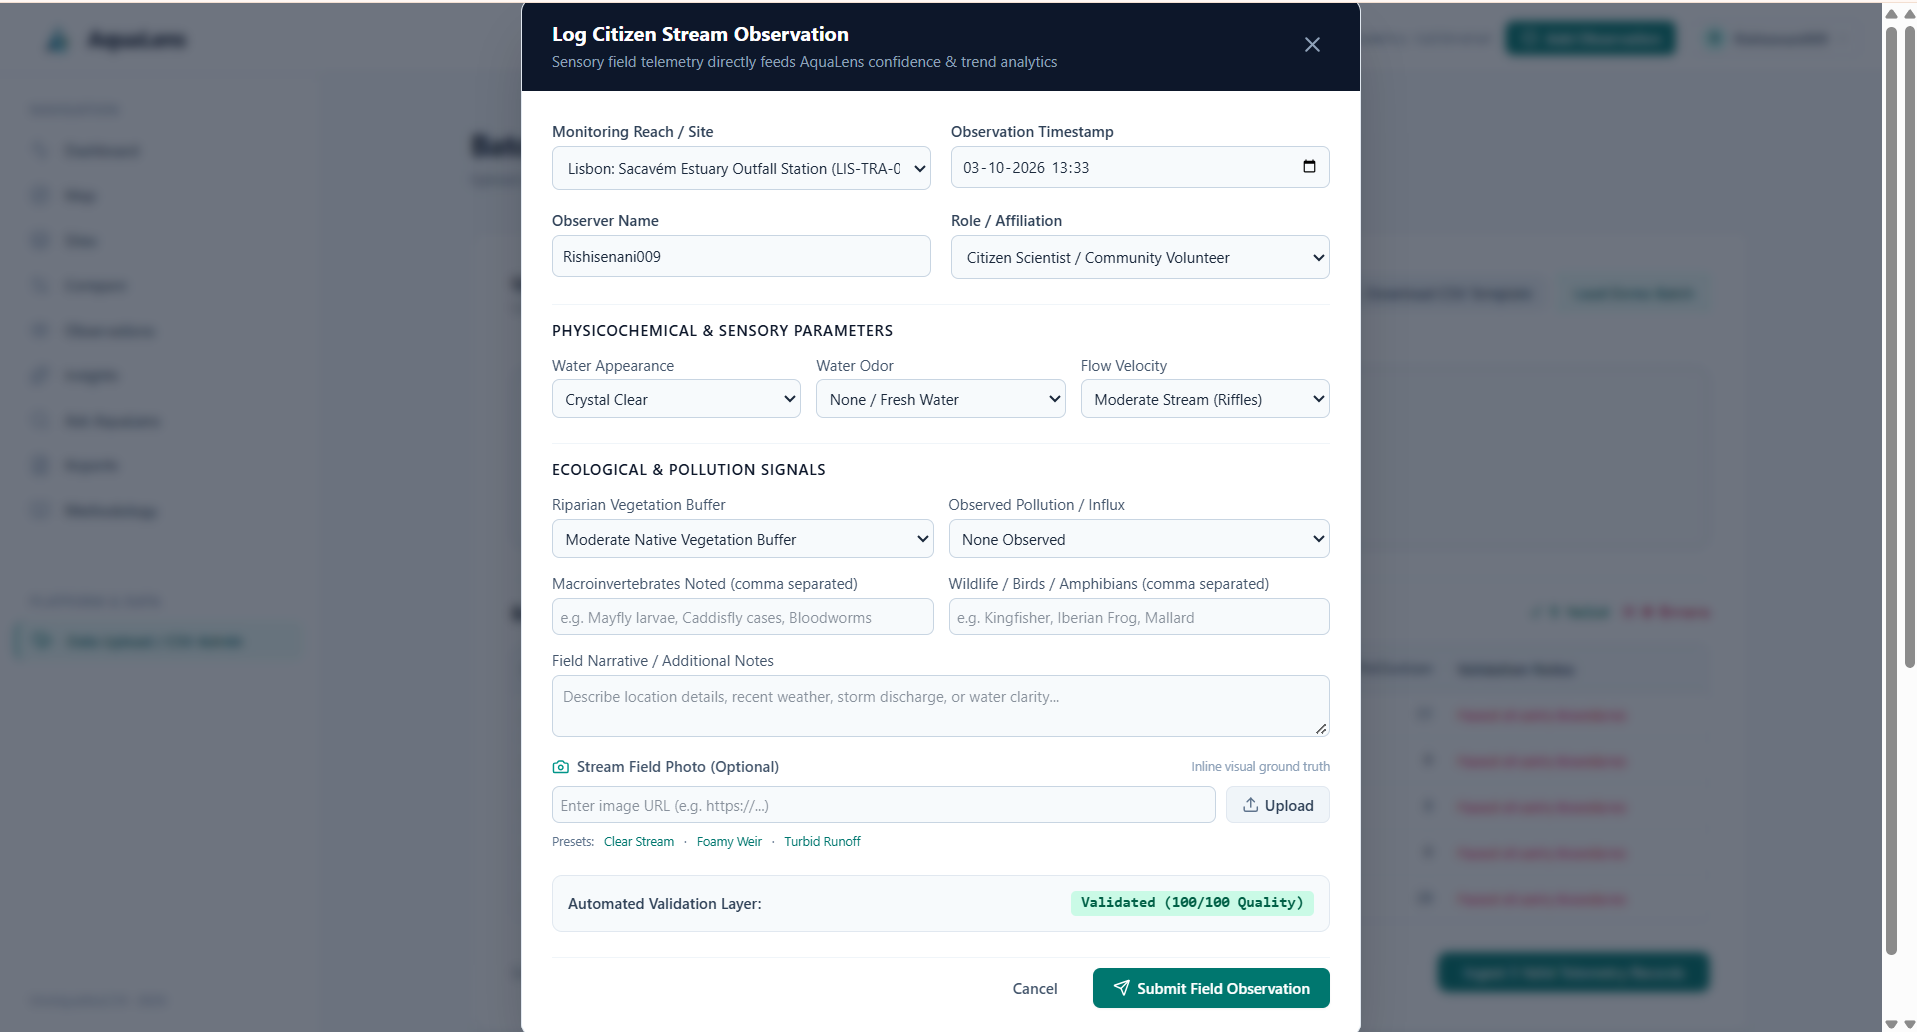
Add Observation form
Inspiration
Water and stream health data is valuable, but raw observations and environmental measurements are often difficult to understand at a glance. Citizen scientists, researchers, and environmental teams may collect information about water appearance, odor, flow, rainfall, temperature, biodiversity, habitat, and pollution, but turning these individual observations into meaningful patterns can be challenging.
We wanted to bridge that gap.
AquaLens was inspired by a simple question:
What if stream observations could be transformed into clear, understandable insights instead of remaining as isolated data points?
Our goal was to build a platform that connects citizen observations and environmental telemetry to help people understand the health of streams and surrounding ecosystems.
This aligns directly with Track 2: Data-to-Insight by transforming stream data into dashboards, maps, trends, comparisons, and understandable One Health insights.
What it does
AquaLens transforms stream and environmental observations into actionable water-health intelligence.
The platform brings different types of stream information together and presents it through an intuitive interface.
Key capabilities include:
- Stream Health Dashboard — provides an overview of monitored sites and their health status.
- Interactive Stream Map — visualizes monitoring locations and their associated conditions.
- Monitoring Sites — provides detailed information about individual stream reaches and monitoring locations.
- Observations Feed — displays citizen and field observations related specifically to stream health.
- Stream Field Photos — connects visual evidence with individual observations.
- Multi-Site Comparison — enables users to compare environmental conditions across monitoring locations.
- Trend Analysis — helps identify changes and patterns across environmental indicators.
- Insights Engine — converts collected observations and telemetry into understandable ecosystem-level insights.
- Ask AquaLens — provides a natural-language interface for exploring the available information.
- Reports — organizes important findings into a format that can support environmental monitoring and decision-making.
- CSV Telemetry Upload — allows monitoring data to be uploaded and validated in batches.
- Data Validation — performs basic data-quality and bounds screening before telemetry is incorporated into the platform.
- Citizen Observation Entry — allows users to contribute new stream observations and supporting visual evidence.
Rather than presenting users with disconnected numbers, AquaLens focuses on the journey:
Observation → Data → Pattern → Insight → Action
How we built it
We built AquaLens as a web-based environmental intelligence platform with a modular architecture so that different data sources and analytical components can be integrated over time.
The platform combines:
- Environmental telemetry
- Citizen science observations
- Stream and site metadata
- Water-quality indicators
- Biodiversity and habitat observations
- Weather/environmental variables
- Field photographs
- CSV-based bulk data ingestion
The frontend was designed around a clean dashboard experience with dedicated views for:
Dashboard → Map → Sites → Compare → Observations → Insights → Ask AquaLens → Reports → Methodology
For data ingestion, we implemented a CSV workflow that allows telemetry records to be uploaded, validated, and incorporated into the application's analytical views.
We also designed the observation system so that visual evidence is associated with the relevant stream observation rather than being treated as an unrelated media attachment.
For the prototype and demonstration environment, we use structured demonstration data representing monitoring sites and environmental observations. This allows the complete data-to-insight workflow to be demonstrated without requiring external services or live environmental sensors.
Our approach was intentionally focused on making environmental data understandable rather than overwhelming users with raw measurements.
Challenges we ran into
One of our biggest challenges was deciding how to convert heterogeneous environmental information into something understandable.
Stream health is not represented by a single number. A site can have clear water but poor habitat conditions, or elevated pollution indicators while other parameters remain stable. This made it important to avoid oversimplifying the environmental context.
We faced several other challenges:
1. Turning raw data into meaningful information
Environmental telemetry contains many parameters with different scales and meanings. We needed to organize them into a coherent user experience without hiding the underlying evidence.
2. Connecting observations with visual evidence
Citizen observations become much more useful when users can see the condition being described. We therefore had to ensure that field images were relevant to the corresponding stream observation instead of using generic or unrelated images.
3. Making complex environmental data accessible
The platform is intended for more than data scientists. We wanted citizen scientists, researchers, environmental teams, and other users to understand what the data means without requiring extensive technical knowledge.
4. Designing a complete data-to-insight workflow
It was not enough to create a dashboard. We needed to connect ingestion, validation, visualization, comparison, observations, and insights into one continuous workflow.
5. Building a useful prototype without depending on external APIs
We wanted the core demonstration to work reliably without requiring multiple external API keys or live infrastructure. This led us to design a self-contained demonstration dataset and ingestion workflow.
Accomplishments that we're proud of
We are proud that AquaLens evolved from the idea of a simple environmental dashboard into a complete stream data-to-insight platform.
Some of the things we are particularly proud of are:
- Building a complete end-to-end stream monitoring interface.
- Connecting citizen observations with environmental telemetry.
- Creating a dedicated observation system with relevant visual evidence.
- Building an interactive monitoring-site experience.
- Adding map-based exploration of stream health.
- Supporting multi-site comparison.
- Creating dashboard-level health indicators and trends.
- Implementing CSV telemetry ingestion and validation.
- Creating an interface for exploring environmental insights in natural language.
- Designing the platform around explainability rather than simply producing a score.
- Keeping the system usable for both technical and non-technical users.
Most importantly, we are proud of the core concept:
AquaLens doesn't just collect stream data — it helps people understand what the data is telling them.
What we learned
Building AquaLens taught us that environmental intelligence is not simply a machine-learning problem or a visualization problem.
It is a data interpretation problem.
We learned how important it is to:
- Design data models around real-world environmental concepts.
- Validate incoming data before using it for analysis.
- Connect quantitative measurements with qualitative observations.
- Treat photographs and citizen observations as valuable contextual evidence.
- Present trends without hiding the underlying data.
- Design interfaces that make complex information understandable.
- Think about environmental health as a connected system rather than isolated indicators.
- Build explainability into the product from the beginning.
We also learned that a good environmental platform should help users move from:
"What happened?"
to:
"Where did it happen?"
to:
"Is it changing?"
to:
"Why might it matter?"
That progression became an important design principle for AquaLens.
What's next for AquaLens
AquaLens is designed as a foundation that can grow beyond the current prototype.
Our next steps include:
Real-time sensor integration
Connect AquaLens directly with IoT and environmental monitoring sensors to provide continuously updated stream telemetry.
Advanced anomaly detection
Develop models that can automatically identify unusual changes in water quality, flow, temperature, rainfall, or other environmental indicators.
Predictive stream-health insights
Move from describing current conditions toward forecasting potential environmental risks.
Satellite and remote-sensing integration
Integrate satellite observations with ground-level citizen and sensor observations to provide a broader view of watershed conditions.
Stronger geospatial intelligence
Expand the map into a more advanced geospatial analysis environment capable of identifying spatial relationships between pollution sources, rainfall, land use, and stream conditions.
Better citizen-science participation
Make it easier for citizens to submit observations, photographs, and environmental reports while improving validation and quality control.
Explainable AI
Expand the insight engine so that every generated insight can clearly communicate:
What changed → Where it changed → What evidence supports it → Why it may matter
One Health connections
Eventually, AquaLens can connect environmental changes with broader ecosystem and human-health context while maintaining appropriate scientific caution and avoiding unsupported medical conclusions.
Our long-term vision is to make AquaLens a platform where citizen observations, sensor data, geospatial information, and AI-assisted analysis work together to turn streams of environmental data into understandable intelligence.
From streams to systems. From data to insight. From insight to informed action.
Built With
- ai
- analytics
- citizenscience
- csv
- dashboard
- dataanalytics
- datavisualization
- environmental
- environmentalmonitoring
- geospatialdata
- html
- javascript
- leaflet.js
- onehealth
- openstreetmap
- react
- recharts
- responsivedesign
- tailwindcss
- typescript
- vite


Log in or sign up for Devpost to join the conversation.