Inspiration
I met a consultant at my first hackathon who introduced me to the Central California Almond Growers Association. Working alongside him and talking with farmers, I kept hearing the same frustration described a few different ways: everything they need to know about a piece of ground exists somewhere in public data, but nobody has ever put it in one place.
To figure out whether one orchard is even work driving to, a farmer or a land buyer has to pull from six different sources. The state's crop mapping tells you what's planted, when, and where. The county assessor's parcel file tells you the legal boundary and APN. USDA soil surveys tell you the pH, clay, drainage and whether there's a hardpan. The state water district layer tells you if it's on district water or pumping groundwater
None of these files share a common key which can be matched up automatically. Each one labels the same piece of ground a different way. County property records go by parcel number. The crop map has its own field IDs. The soil data and water districtive maps ignore orchard boundaries completely. There is no shared lD running through any of the data. So the answer to a simple question, "which almond ground around here is on good soil, has district water, is at peak age, and who do I call about it," takes days of spreadsheets and manual work. Then you drive out to look for it based on its coordinates and you make get lost and lose signal.
What it does
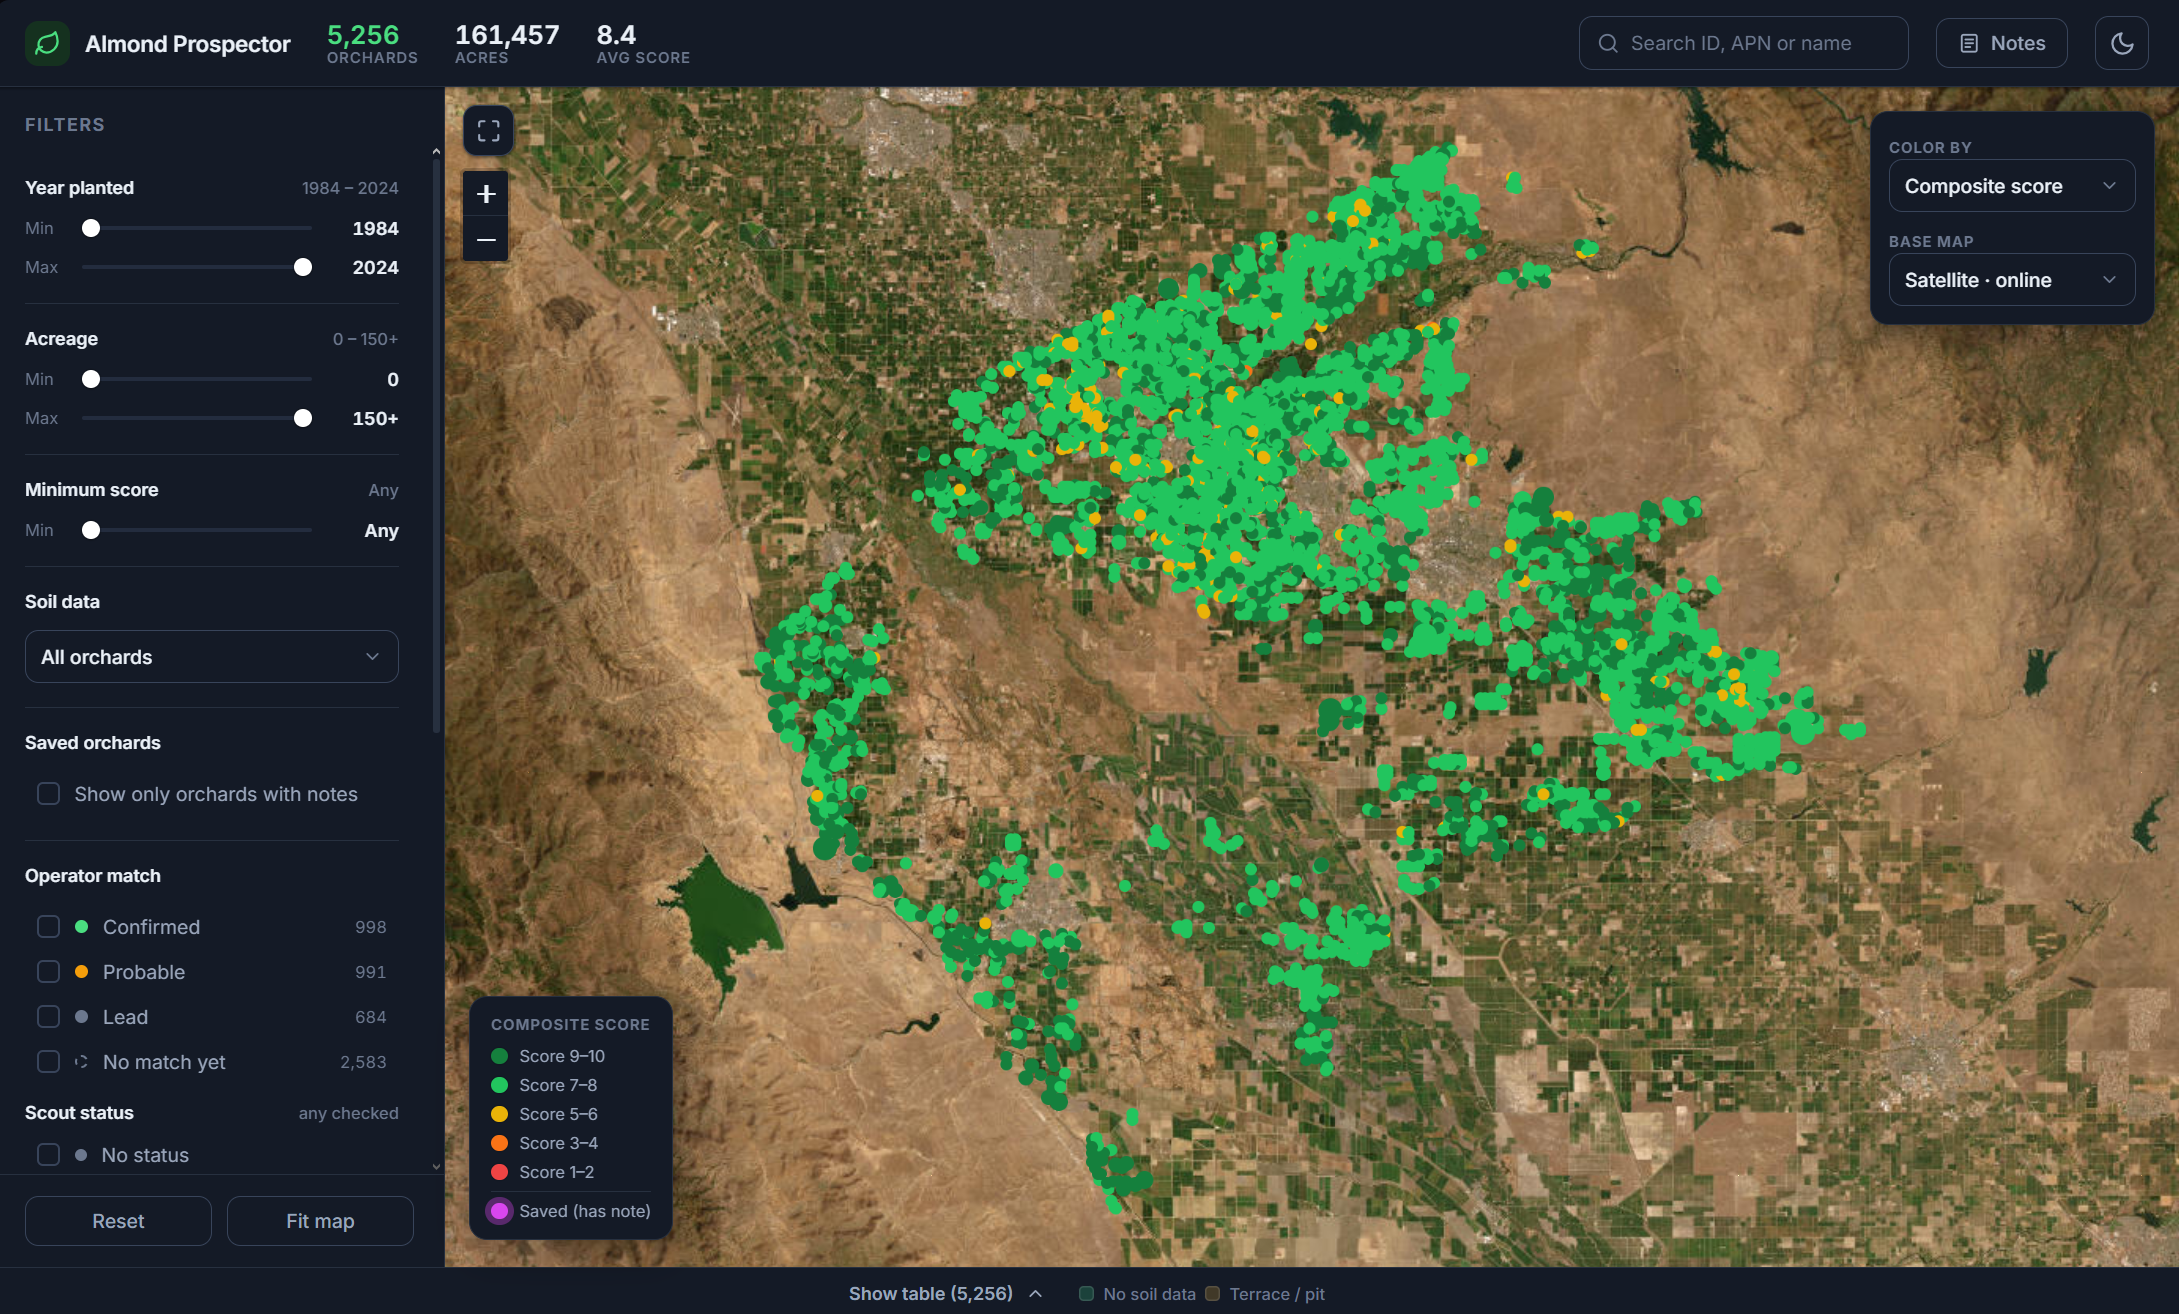
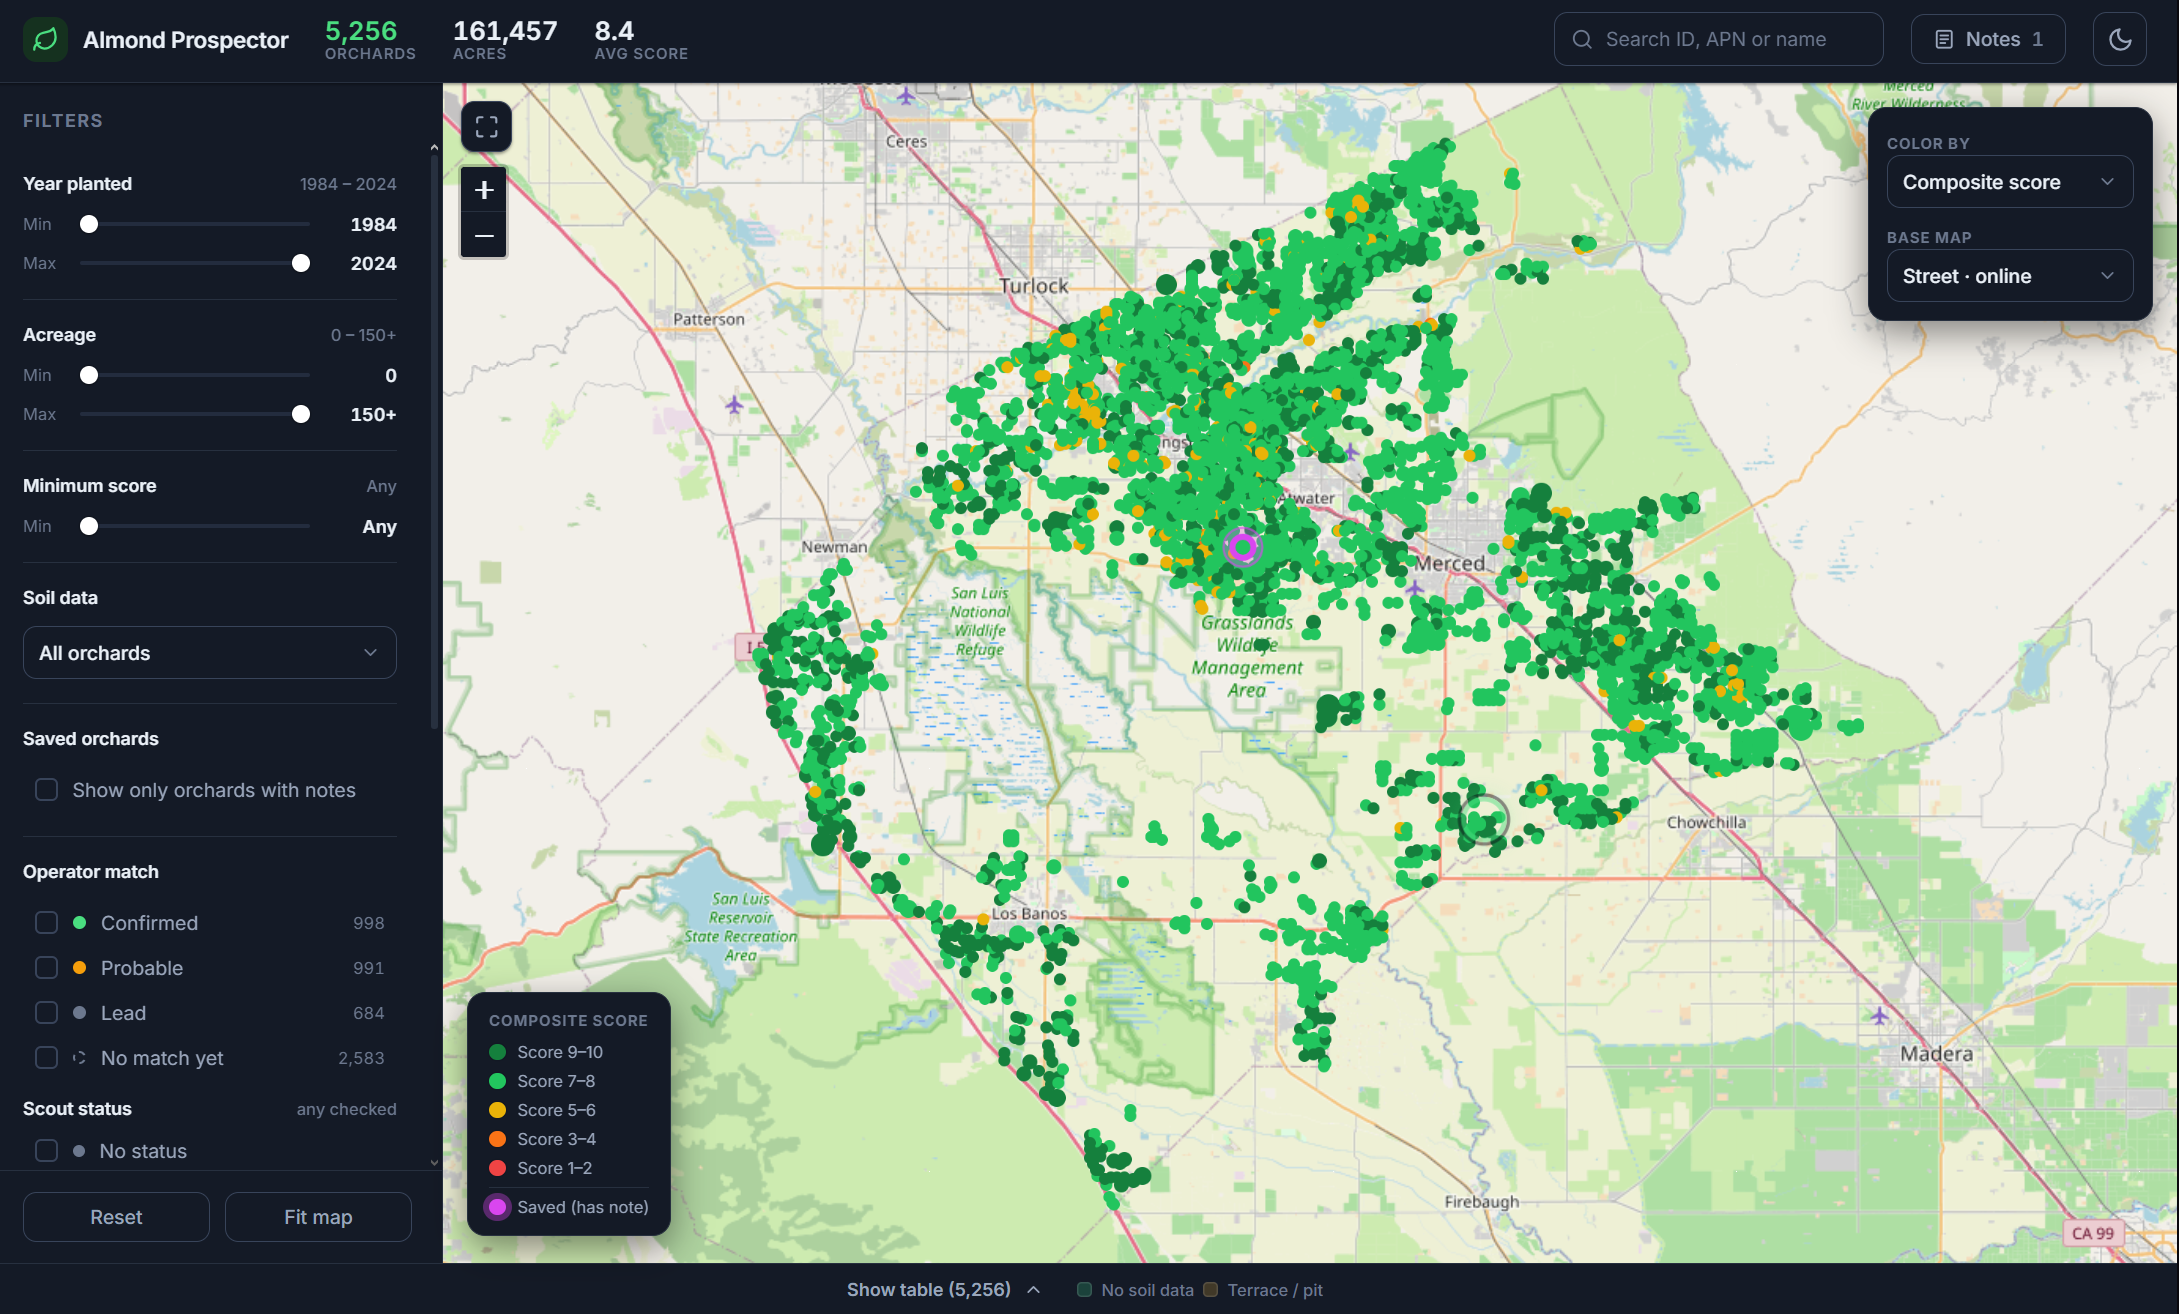
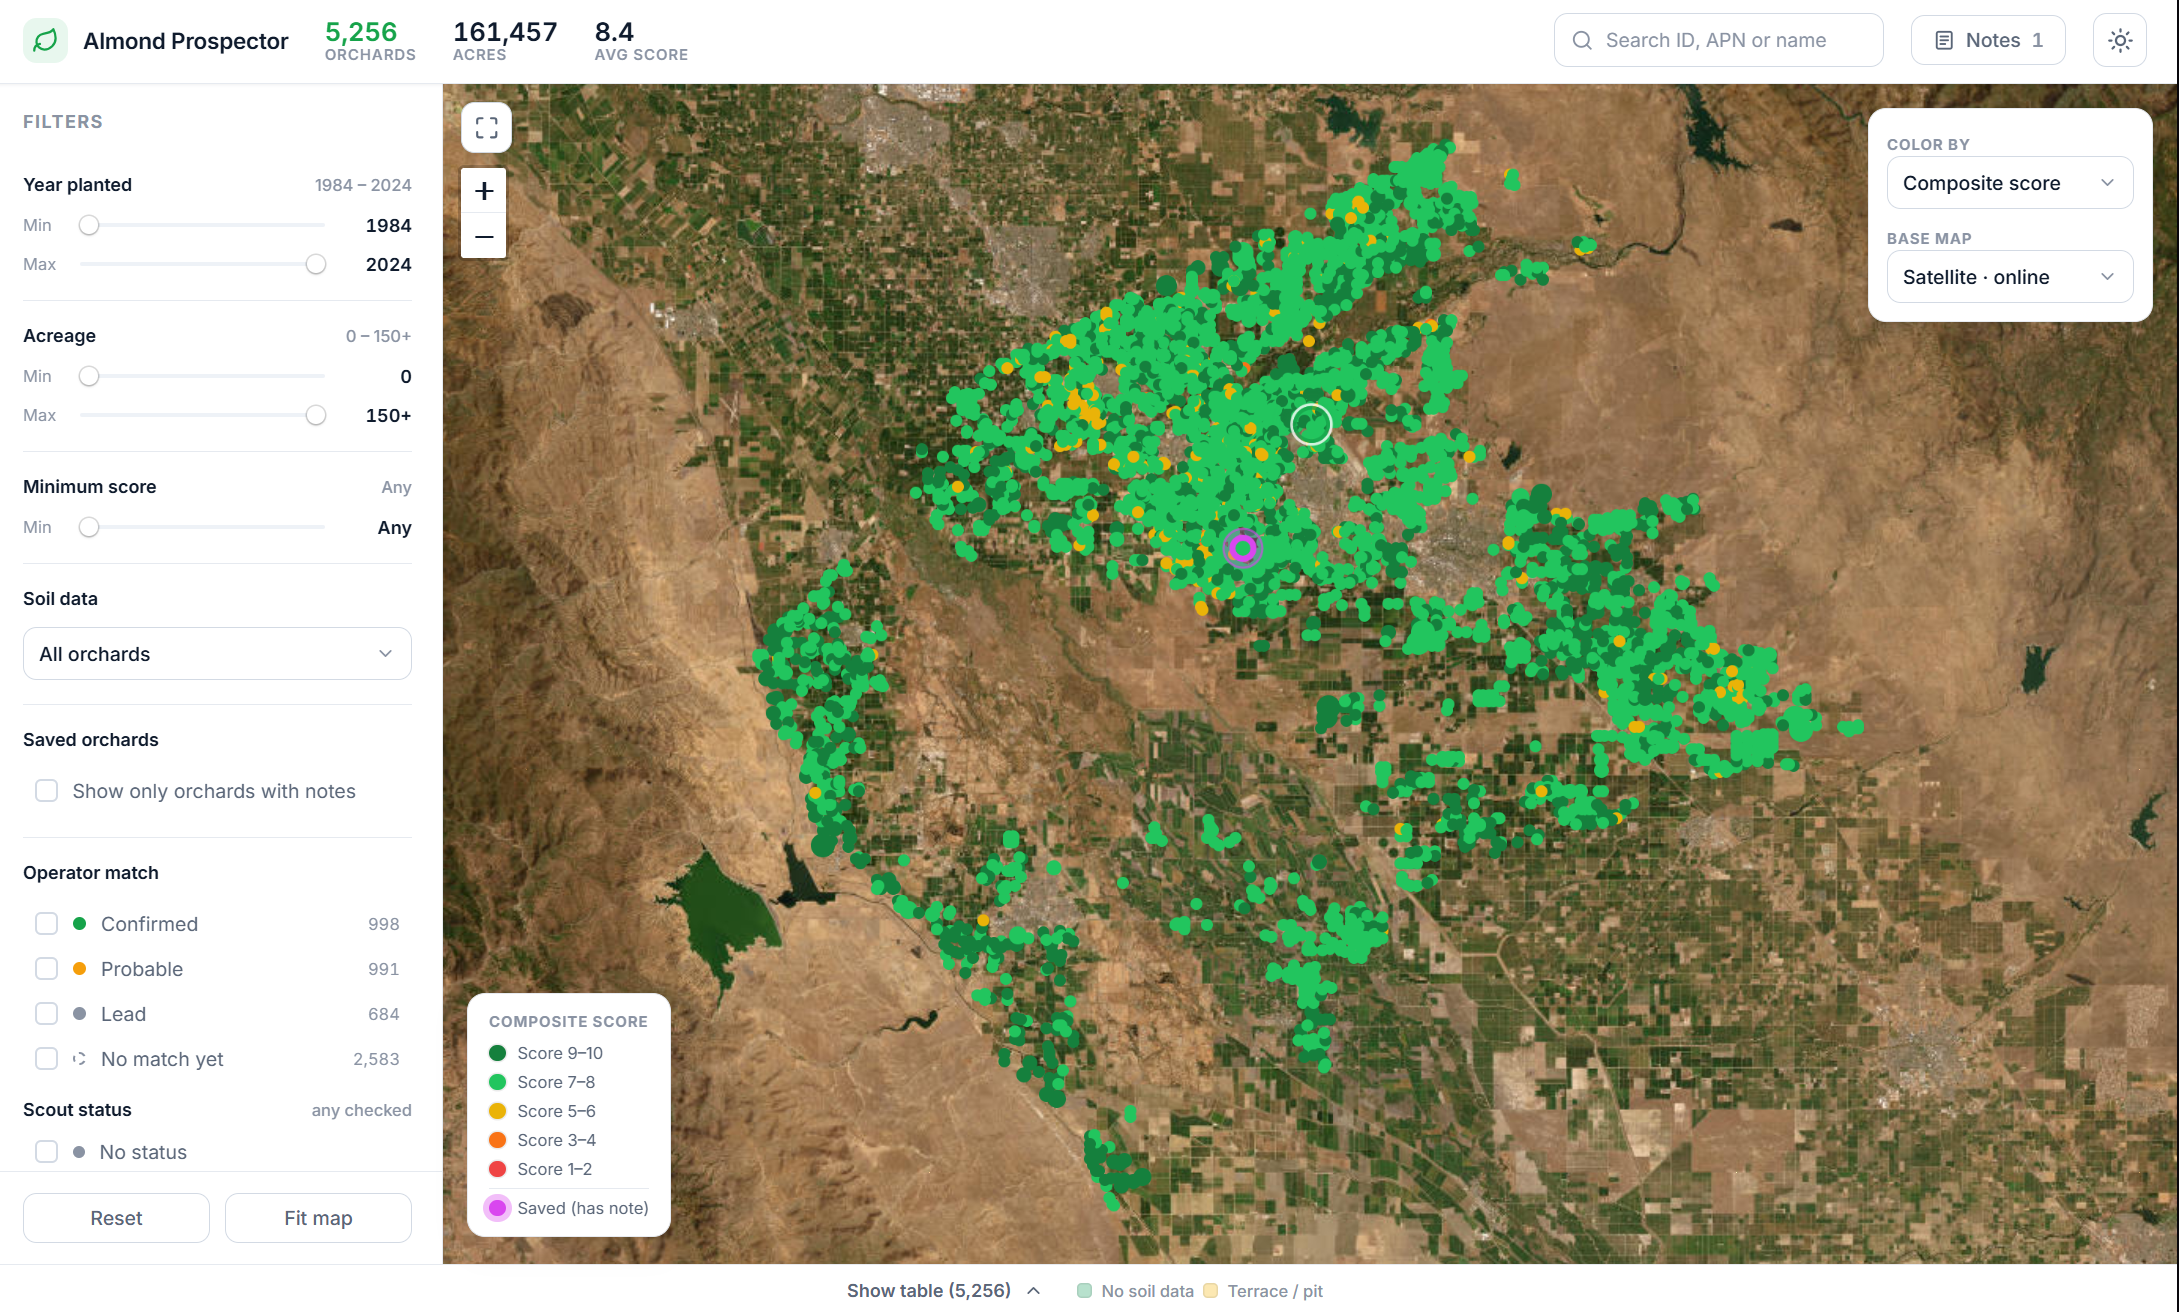
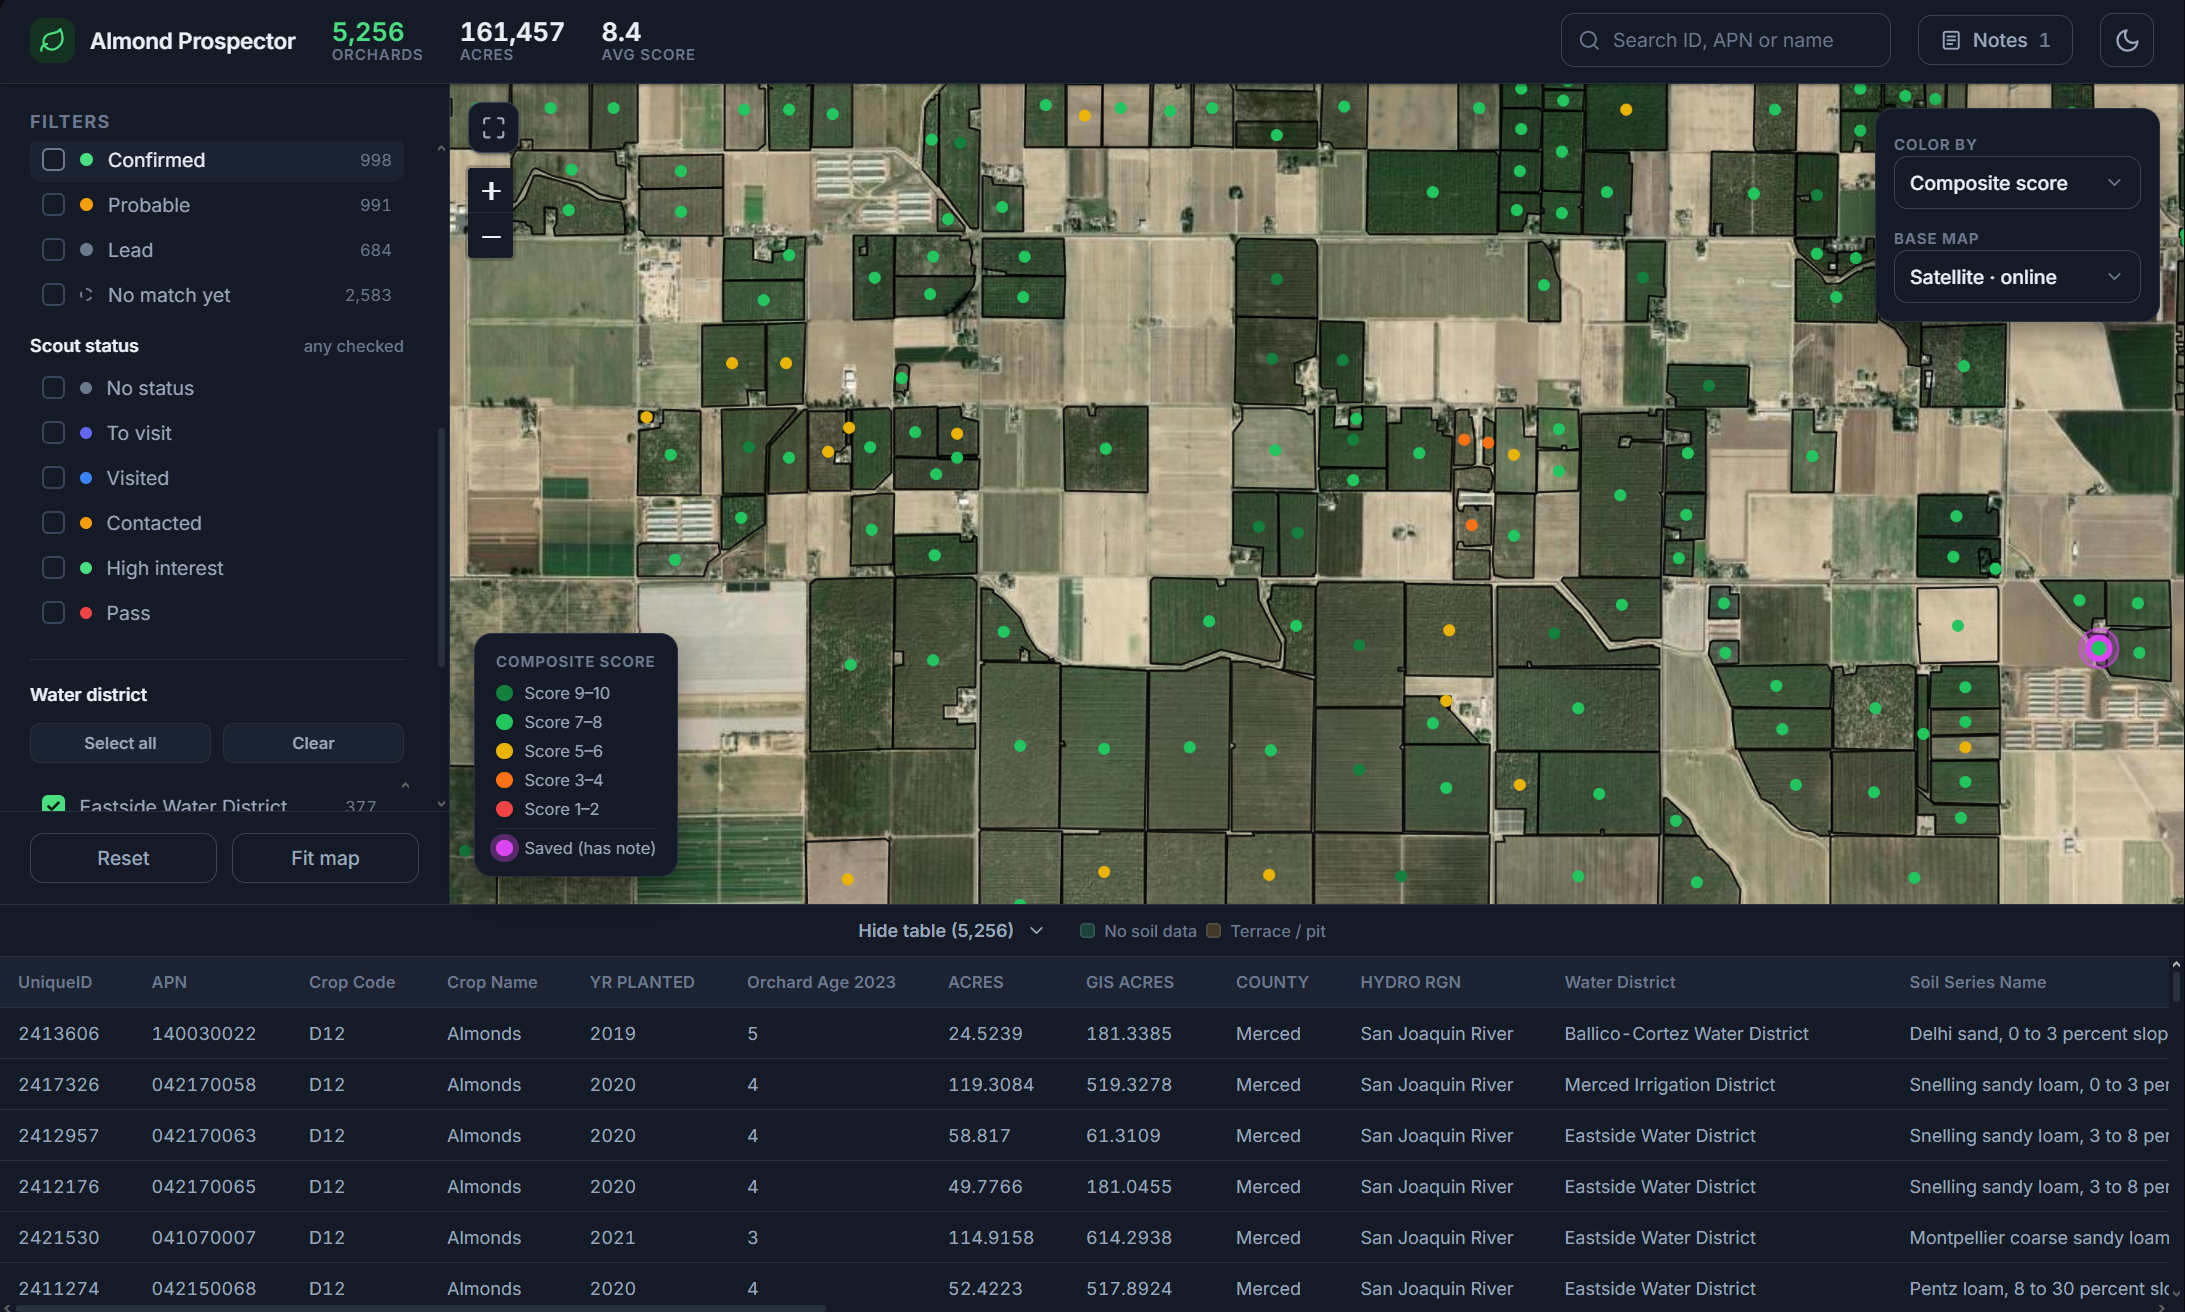
Almond Prospector is an interactive map of every almond orchard in Merced County, 5,256 of them covering 161,457 acres, with all the scattered data joined onto each one.
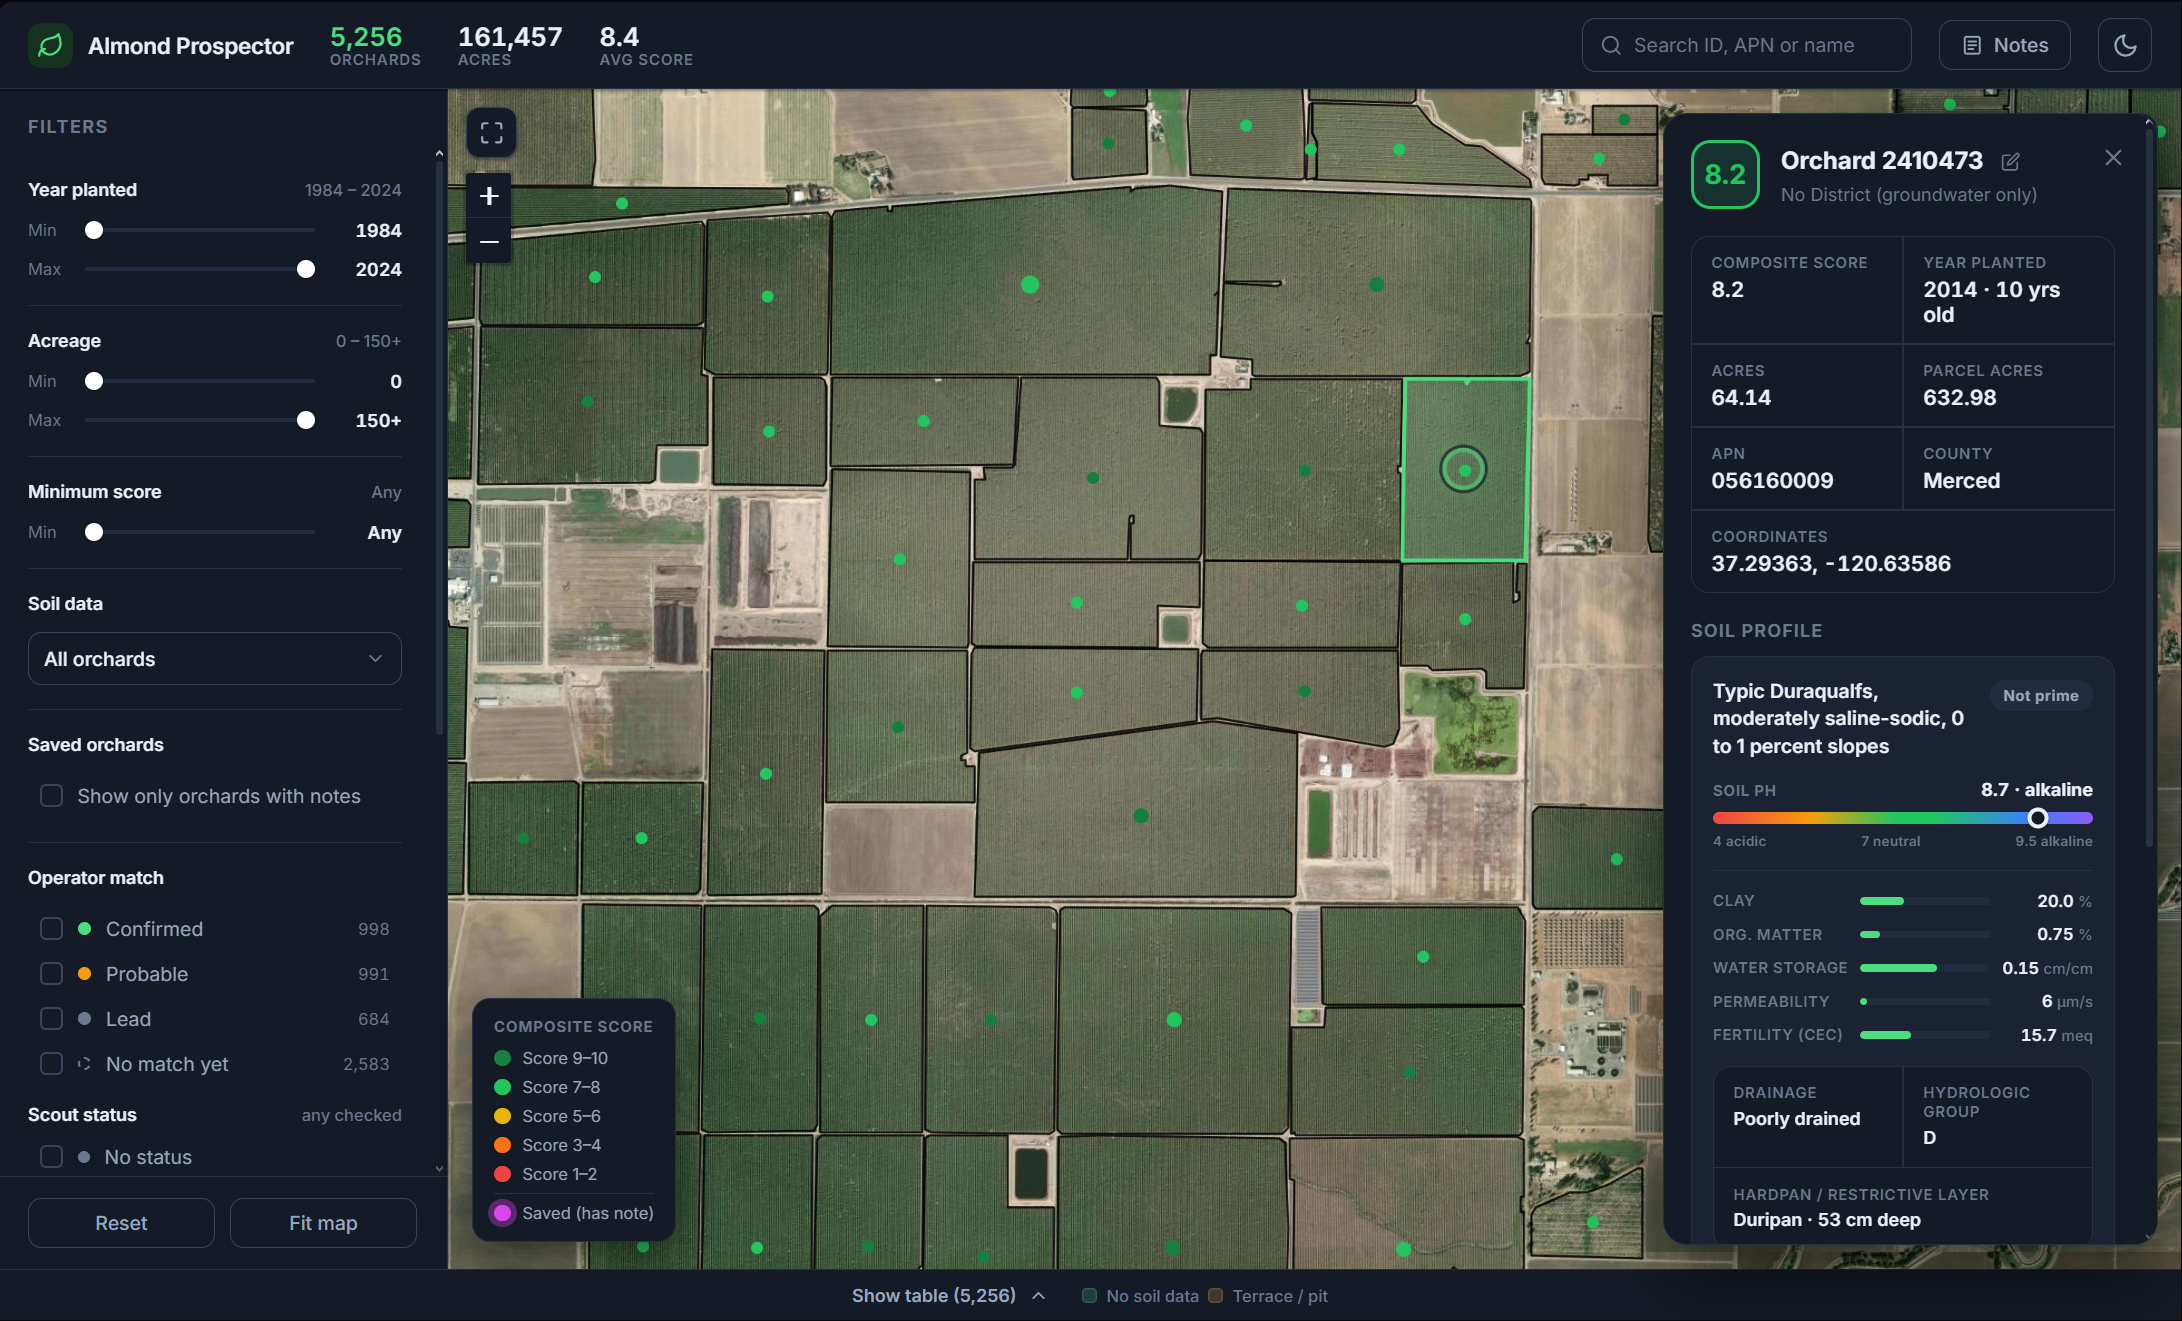
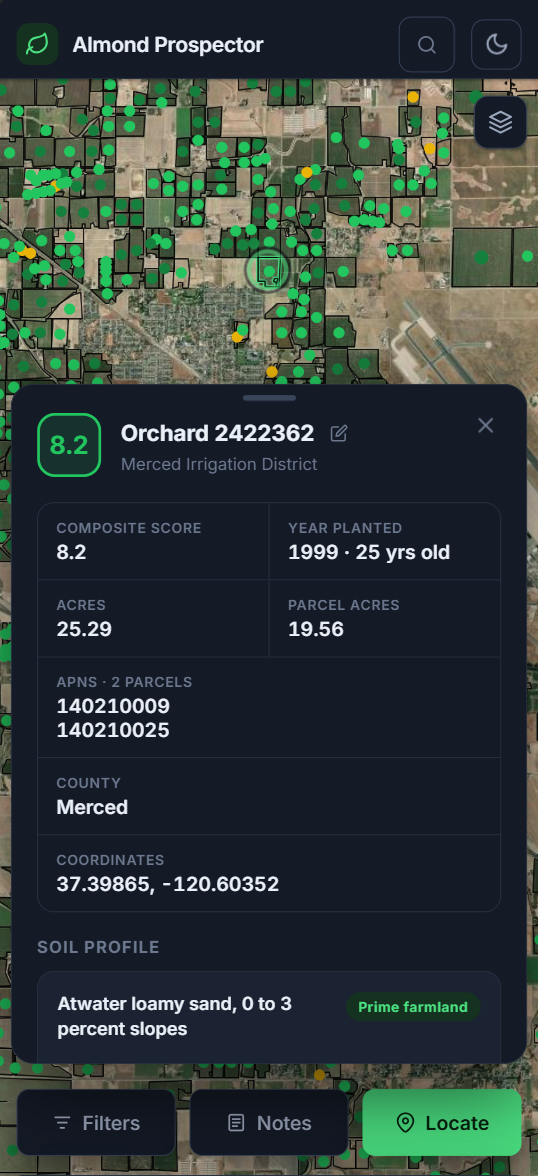
Tap an orchard and you get:
- Soil profile: pulled from USDA survey data: pH on a gradient bar, clay percent, available water capacity, permeability, organic matter, CEC, drainage class, prime farmland class, and any restrictive layer with its depth.
- Water districts: which of the 22 irrigation districts it sits in, or a flag that it's groundwater only with no district behind it.
- Tree age and planting year: straight from the state crop mapping vintage.
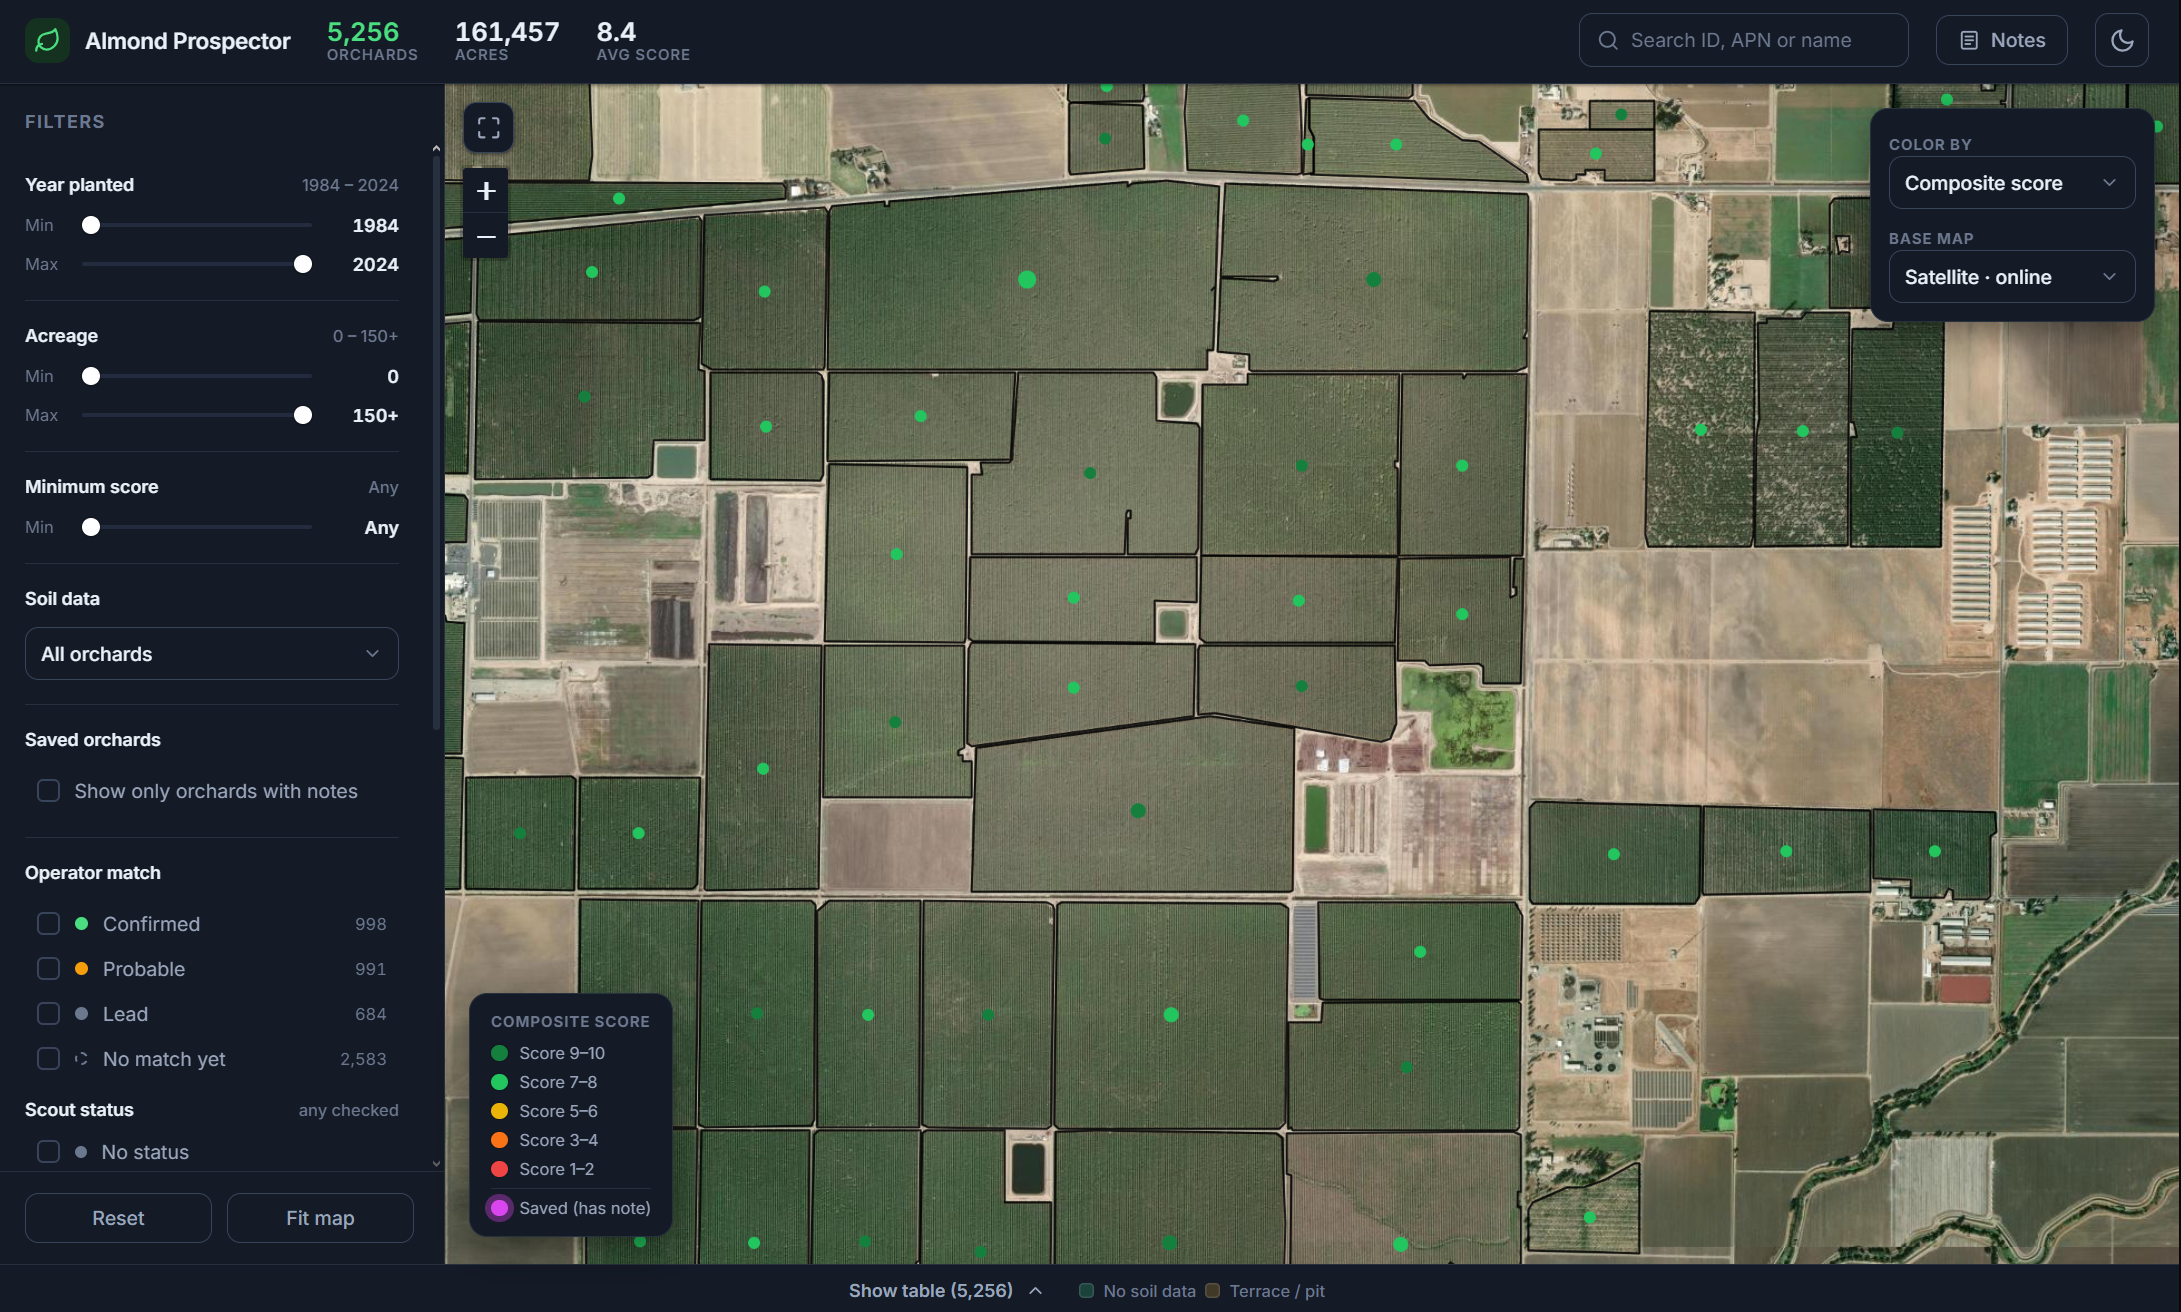
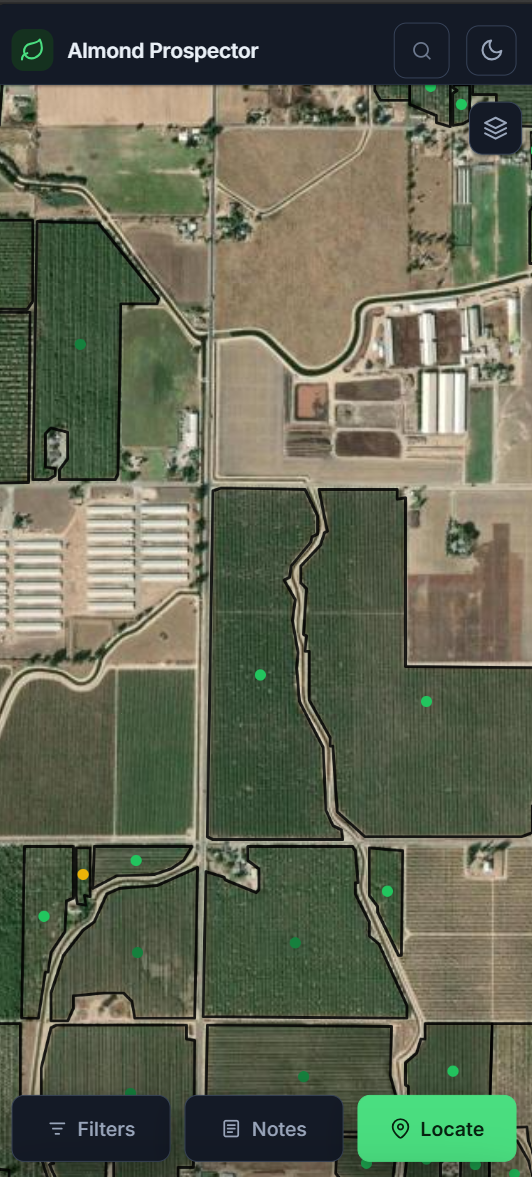
- The legal parcel: Every orchard is linked to its real APN(s) and field ID along its acreage, thhe parcel's acreage and exact coordinates The map draws the orchard outline in black so you can see how much land the orchard is on visually
- Who's farming it: 2,673 orchards are linked to a likely operator, graded confirmed, probable or lead with the reasoning shown.
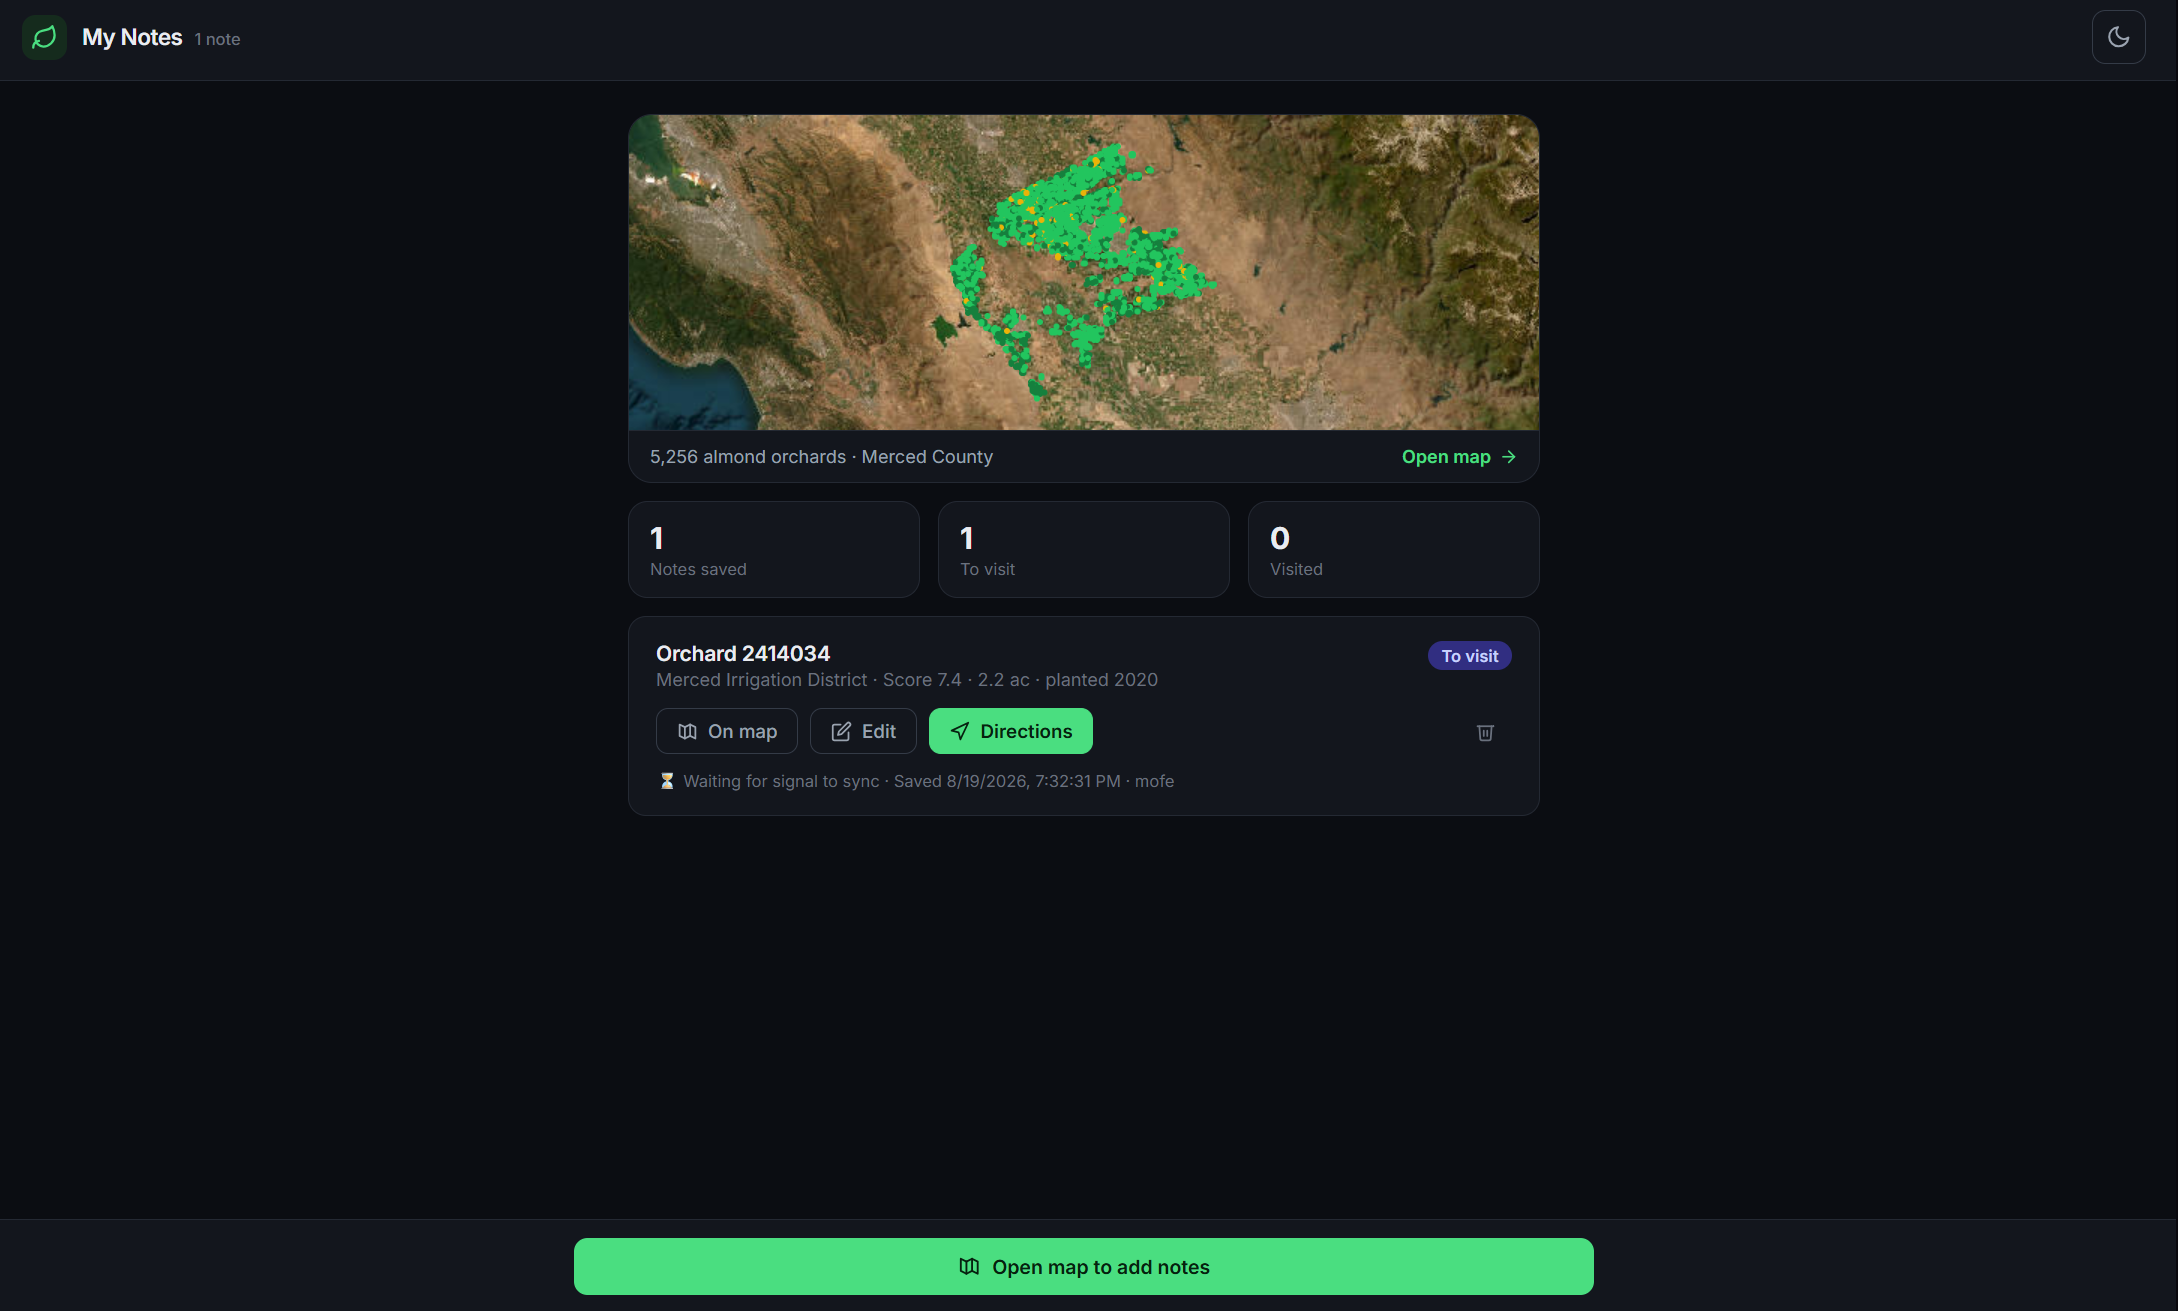
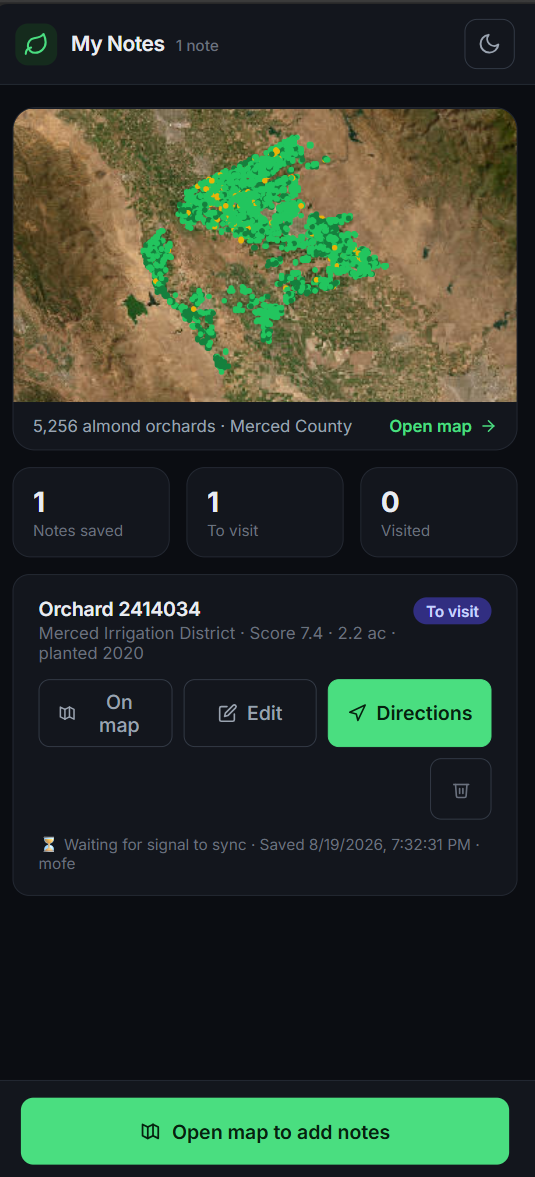
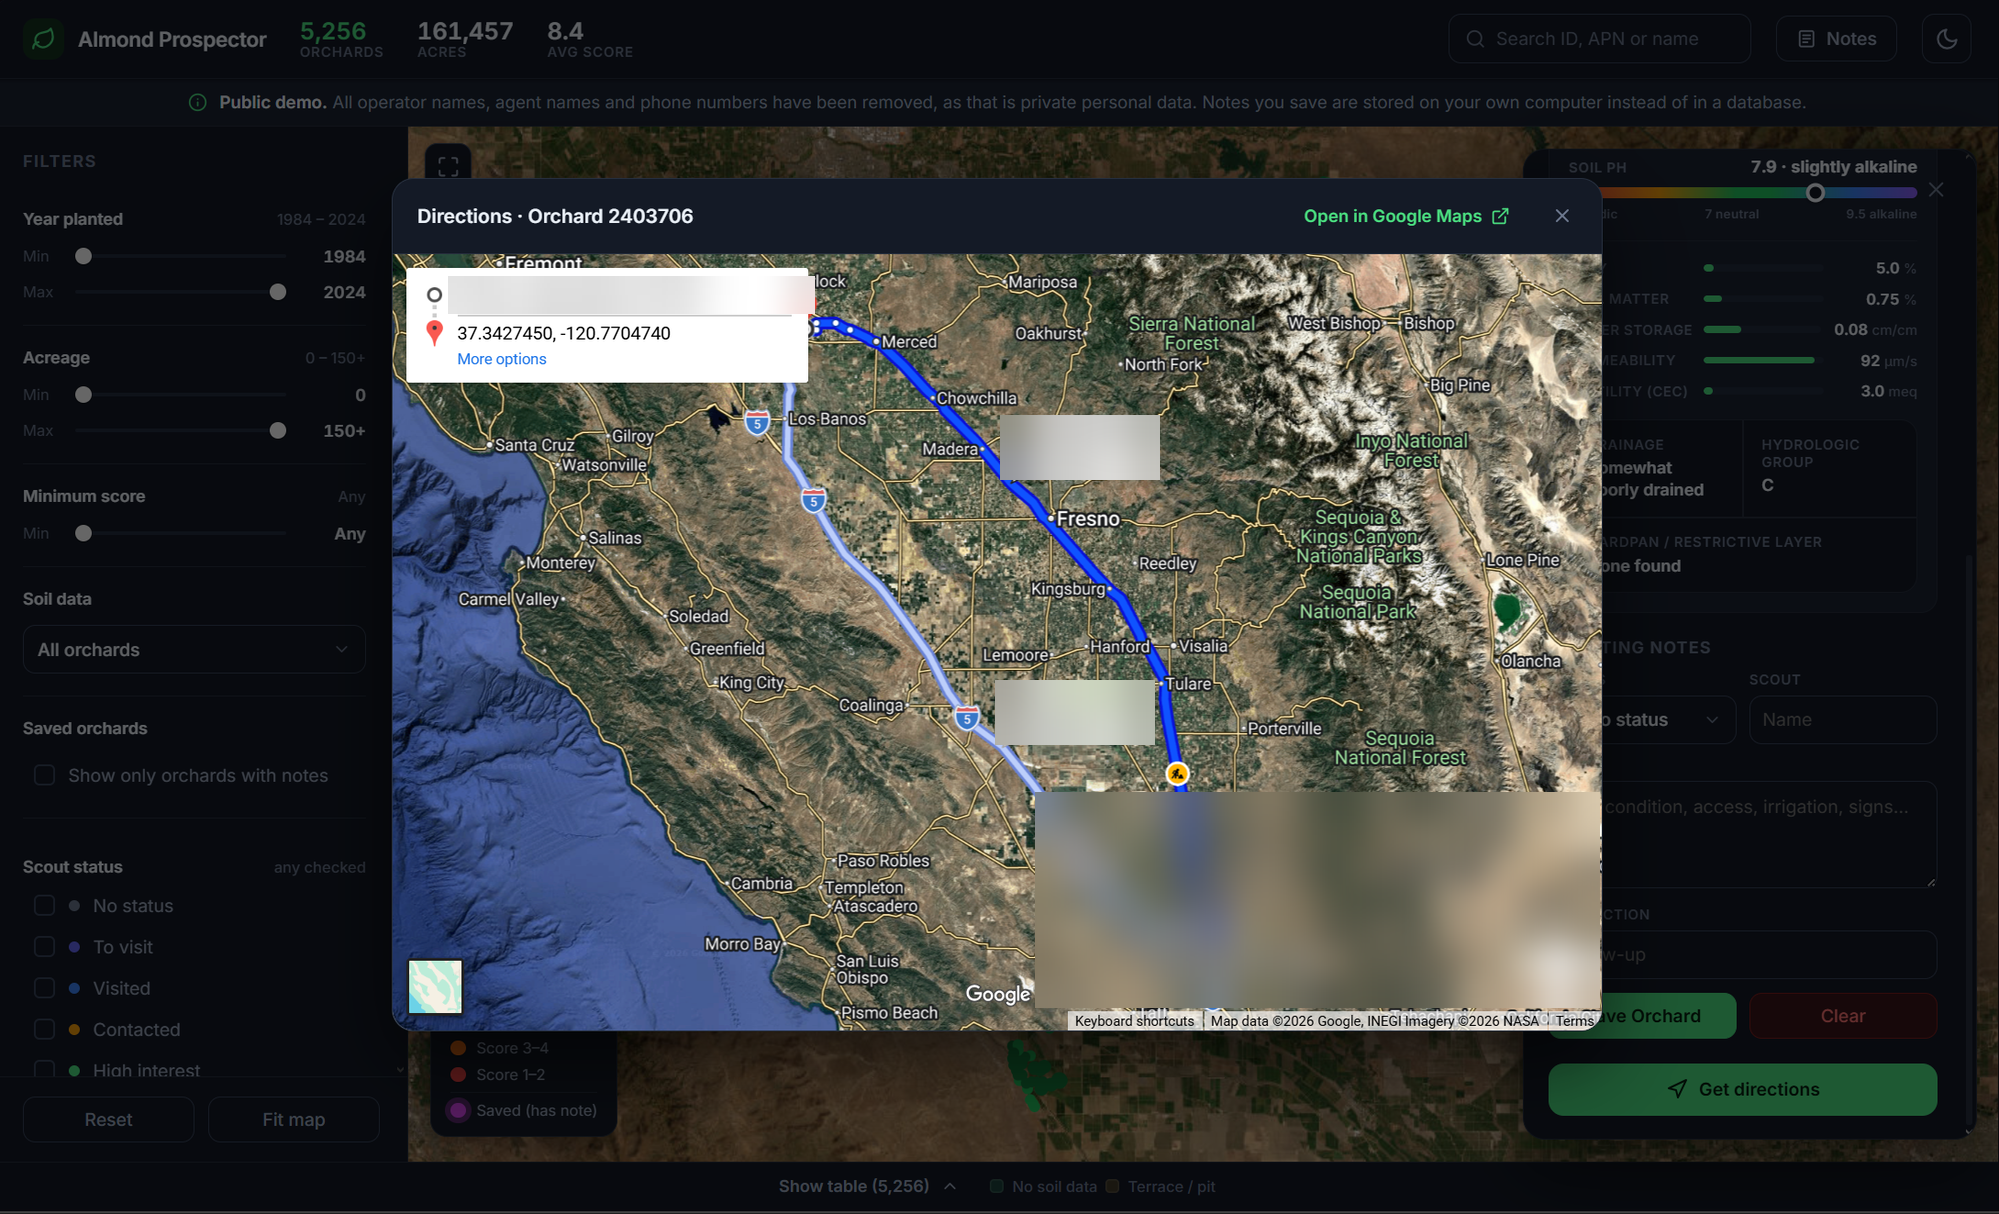
On top of that we added multiple features such as search by APN, ID, orchard name, or operator. Filters for water district, planting year, soil coverage and match tier. Notes saved per orchard, satellite and street basemaps, light and dark modes, and one-tap handoff to driving directions.
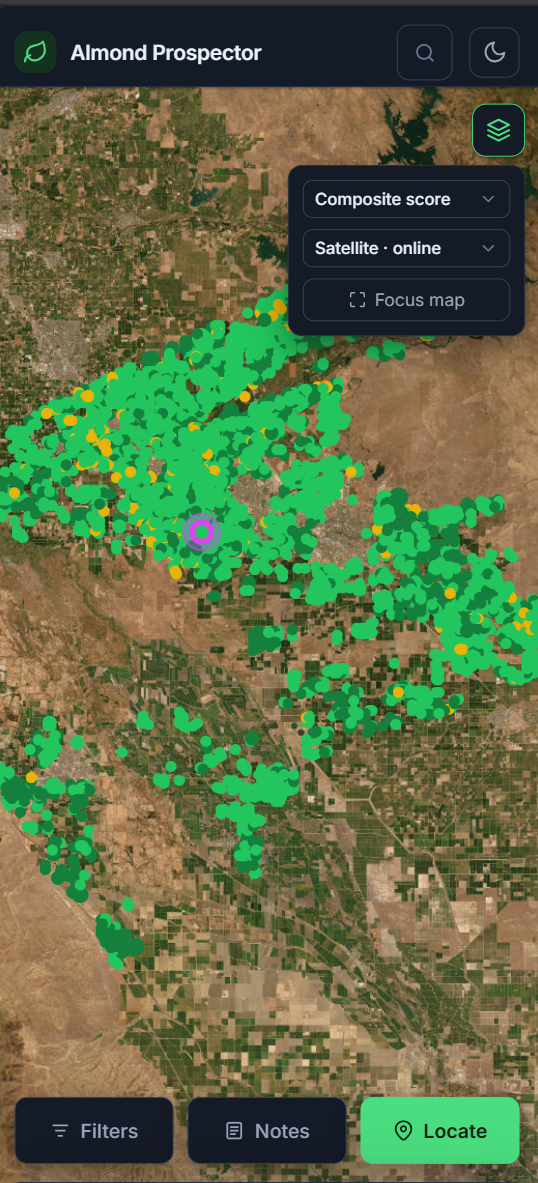
It's a progressive web app which makes it work as a website and app, so there's no app store and nothing to install. On a phone you open it in the browser, hit add to home screen, and from then on it launches with its own icon and runs fullscreen like anything you'd have downloaded.
The two things that make it usable in the field:
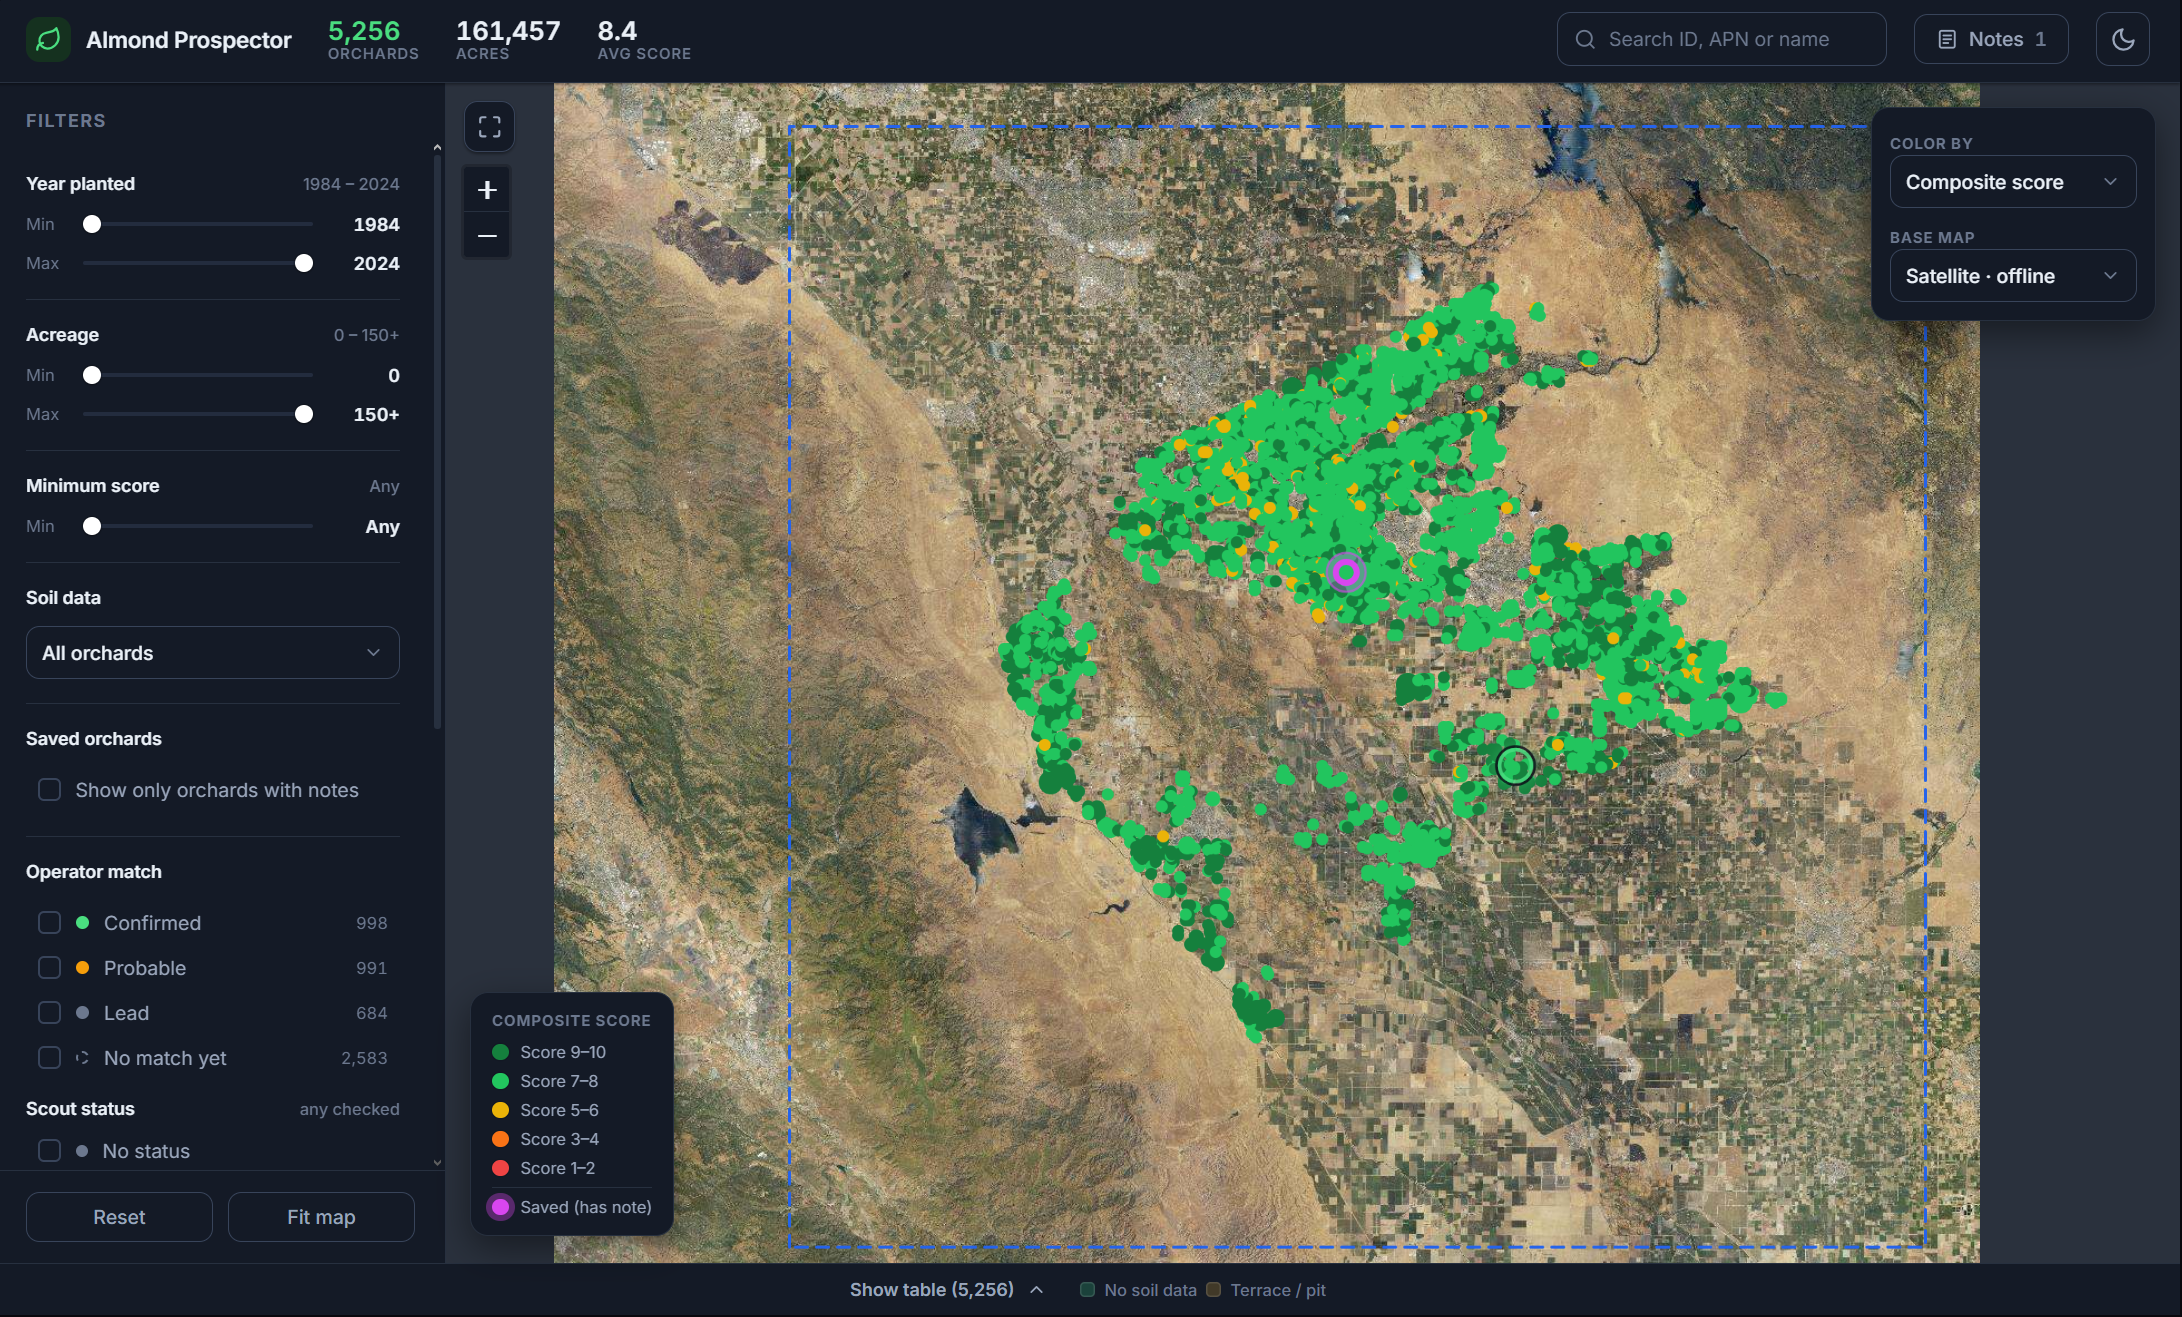
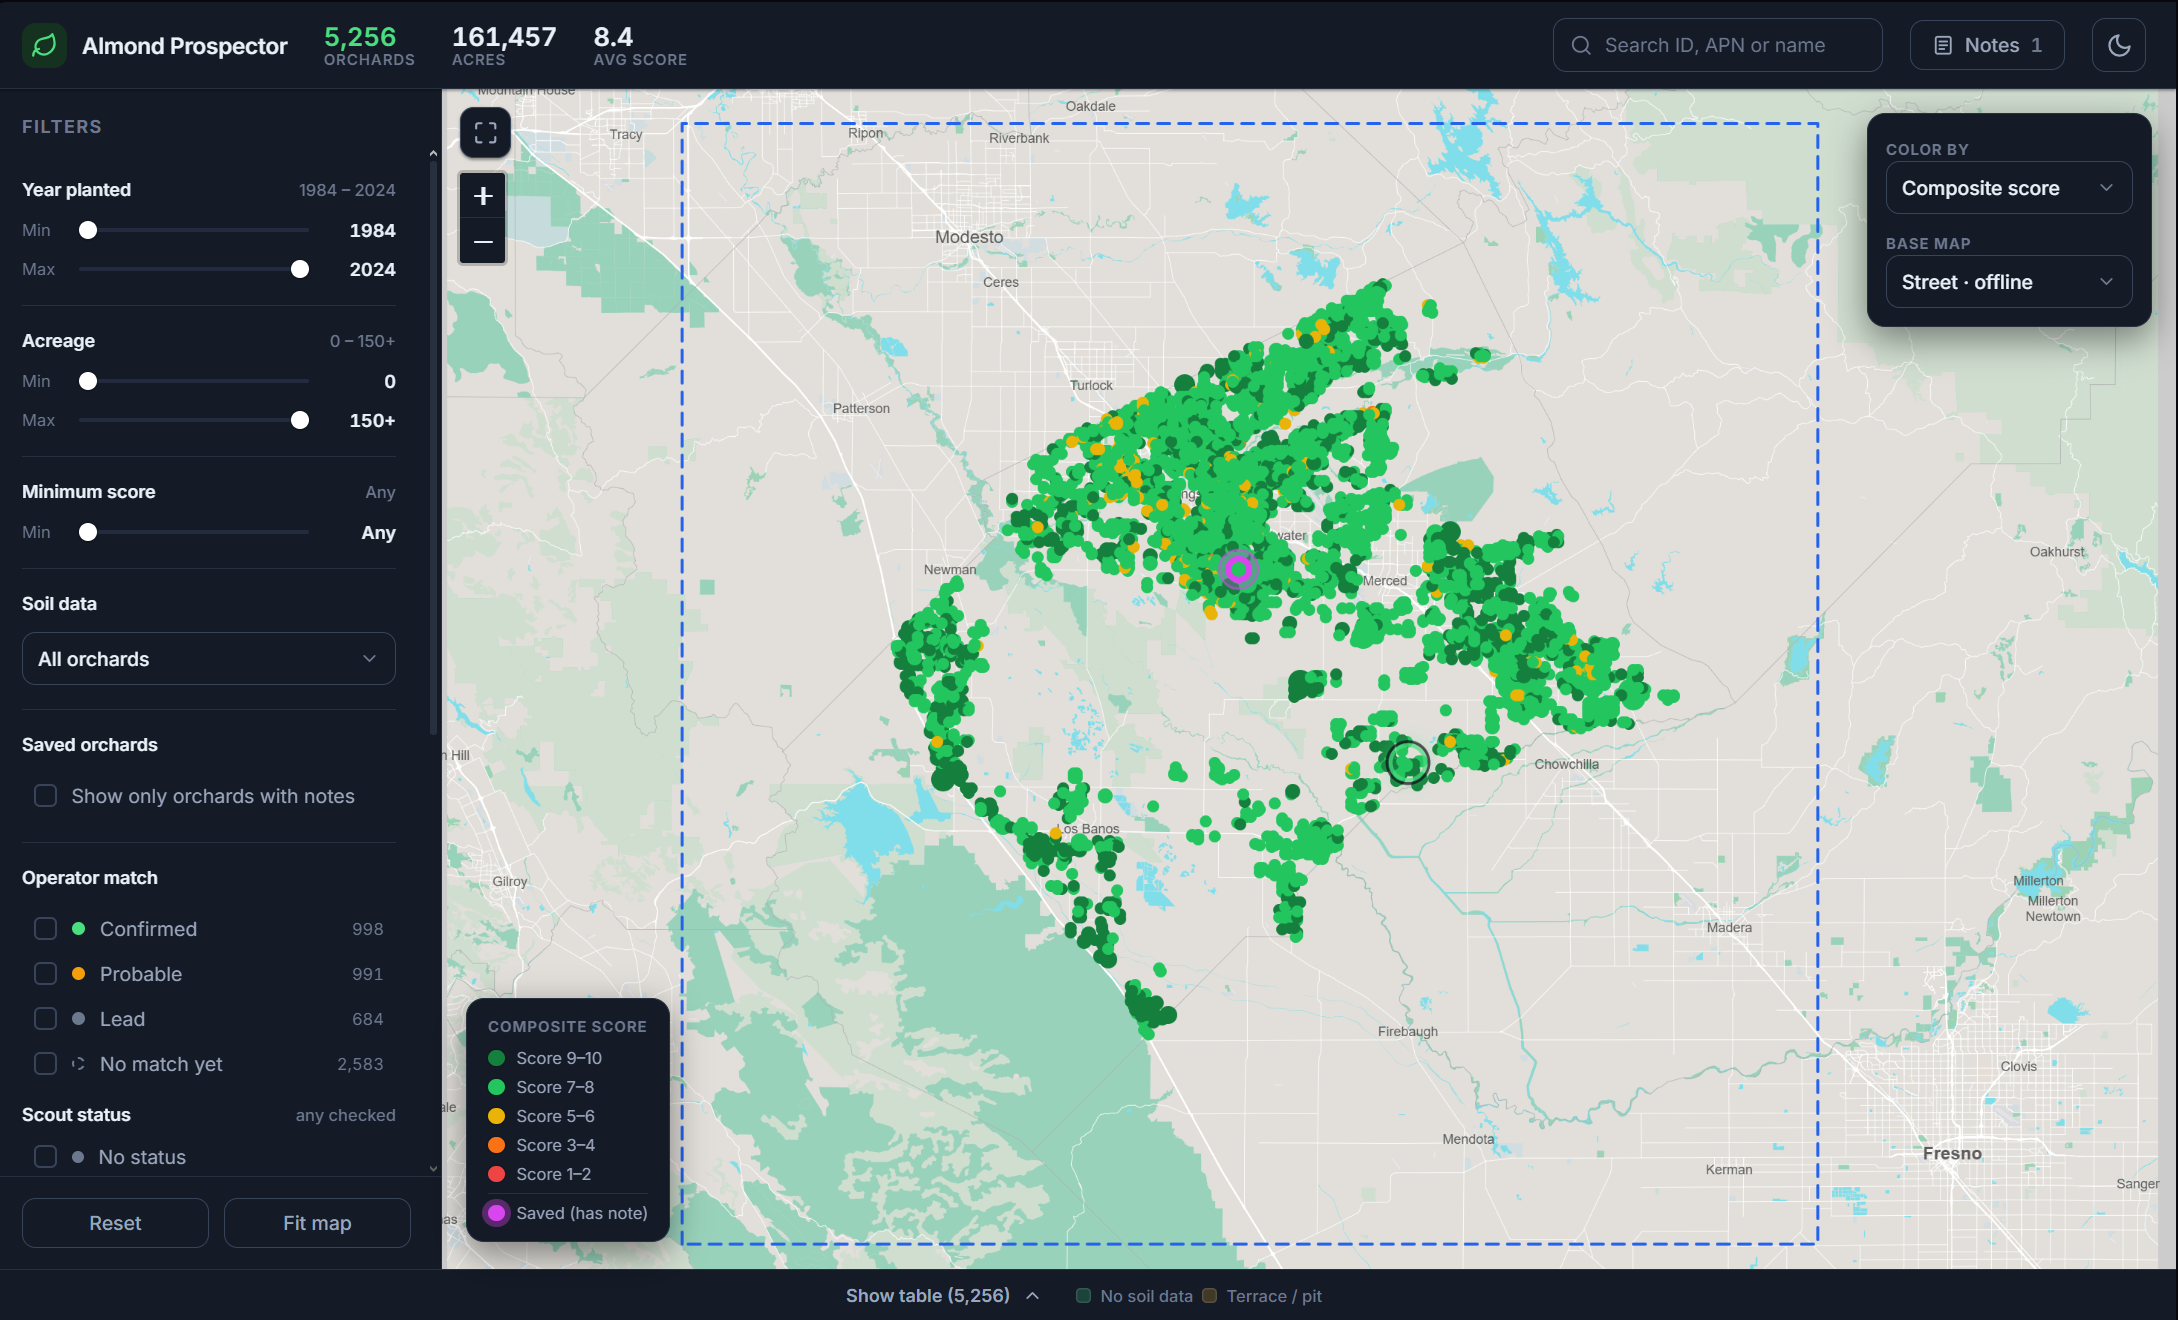
Works with no signal: It brings its own basemaps with it, a 19MB vector street map and satellite imagery over the orchards stored on the device. All 5,256 orchards data, their data and boundaris, and search and filters keep working. Notes written in no signal areas imediately syncs when signal comes back.
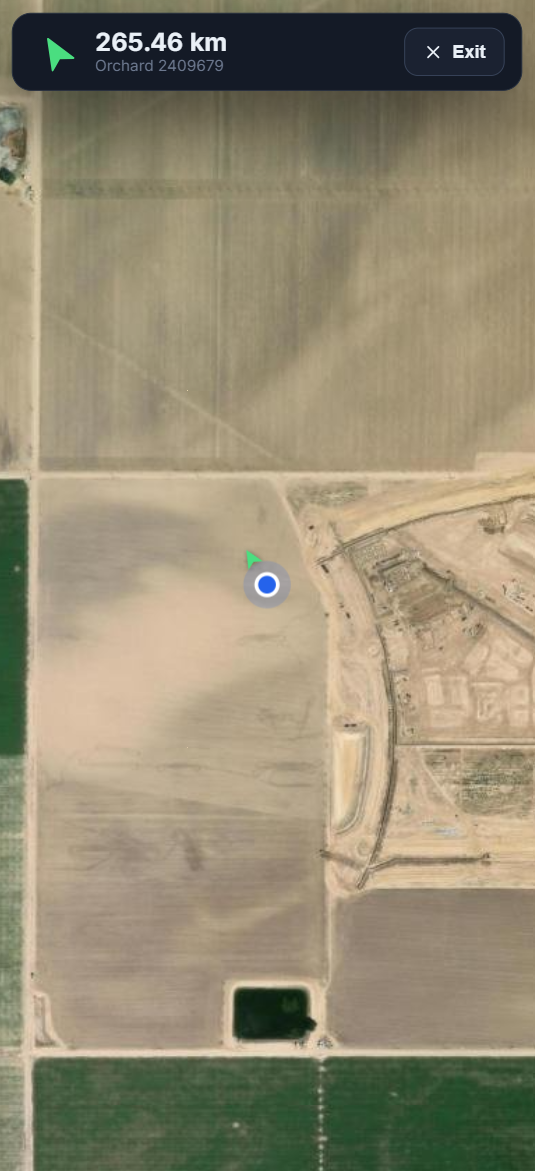
GPS guidance: Hit locate on your phone and the whole interface gets out of the way, leaving a fullscreen map and which shows you where you are and it directs you to the orchard you picked, so you can still find the right field if you lose signal.
How we built it
Language and the code: The whole web app is plain HTML, CSS and JavaScript and the data work behind it is Python scripts, and the database is SQL.
Data Pipeline (Python):
- Started with DWR i15 Crop Mapping 2024 filtered to almonds in Merced County, which gives 5,256 orchard outlines and I overlaied those shapes on the county's parcel map.
- Joined USDA SSURGO soil surveys by checking which soil area each orchard's coordinates land inside and then pulling pH, clay, AWC, Ksat, organic matter, CEC, drainage class, farmland class and restrictive layer for every layer
- Joined DWR water district boundaries, defaulting to groundwater only where nothing covers it.
Maps: There are two of everything (satelittle & street), one streamed and one stored on the device. Online, the satellite view is Esri's imagery and the street view is OpenStreetMap, which is what you get with signal and what the app opens on by default. Offline is where the work went. The offline street map is a Protomaps extract built from OpenStreetMap data, cut down to the area around the county and stored as a single 19MB PMTiles file the app renders itself with protomaps-leaflet. The offline satellite is aerial photography from USDA's 2024 NAIP survey, and instead of storing the whole county I only pull the imagery sitting over the orchards themselves plus a buffer around each one, at three levels of detail. Everything runs through Leaflet, a JavaScript library that handles the map itself, the panning, zooming and layer switching.
Frontend: The whole ap is interactive and Leaflet handle the map, with the 5,256 orchard outlines drawn on top of it. Everything else is built around it: a filters panel on the left, an orchard panel that opens on the right when you tap a field, and a separate notes page in the top right listing all the note's you've saved in one place.
Progressive Web App: A web app manifest is what lets a phone add it to the home screen and launch it fullscreen with its own icon, and a service worker is what makes it run with no connection. The service worker keeps the app and the map files in local storage on the device, so when you pan to a spot on the map, the app just asks for that piece and the area around it. Then the service worker cuts it out of the stored file and hands it back, which is normally a server's job.
The backend: Cloudflare Pages with Pages Functions for the API and D1 for the database, with the whole app behind Cloudflare Access so only invited members can get in.
Challenges we ran into
The hardest part we ran into was never the app but tracking down all the data. Every layer sits on a different agency's site in a different format and we had to match them all up for the orchard data. Once everything was downloaded none of it shared an ID so it all had to be matched by location. Then all of it had to work with no signal, which meant getting the satellite imagery down from gigabytes to megabytes and the app had to serve its own map files, since there's no server out in a field offline to do it for you.
Accomplishments that we're proud of
Sitting with farmers and understanding the problemsl they were describing well enough to build it. Almost every feature that matters came out of a conversation rather than something I thought up on my own, and it's now being used by many farmers in the Central California Almond Growers Association and scaled to over 5,000 orchards.
What we learned
I had to learn SQL and get my hands dirty by pulling everything off the different sites and combining it all into one clean dataset and how to communicate with others well in order to be able to build something that solves their problems.
What's next for Almond Prospector
In the future I plan to expand this to orchards in other counties, and then to other crops entirely. Pistachios and walnuts have the same scattered data so the pipeline isn't specific to almonds or to Merced. It's specific to the sources, and those cover the whole state.
Impact Statement
Almond farmers and land buyers in Merced County benefit first. Answering one ordinary question, which ground has good soil, district water, and trees at peak age, and who to call about it, meant pulling six public datasets that share no common ID and matching them by hand over several days. Almond Prospector does that join once for all 5,256 orchards and 161,457 acres in the county and returns the answer in a tap.
Additionally, it works where the work actually happens. Faermers plan their trips around only the orchards worth visiting, saving hours of driving blindly. The map, the orchard data, and GPS keep running with no signal, so a farmer standing in a field with no signal still knows whose parcel they are on, what the soil is, and how to reach the next one.
Finally, it is already being used by farmers in the Central California Almond Growers Association, and nearly every feature in it came out of a conversation with one of them rather than an idea of my own. The data problem it solves is not specific to almonds or to Merced. The same public sources cover the whole state, so the same pipeline reaches other counties and other crops.
Built With
- claude
- cloudflare
- cloudflare-d1
- cloudflare-pages
- cloudflare-worker
- css
- data
- geopandas
- html
- javascript
- leaflet.js
- openstreetmap
- pandas
- pmtiles
- protomaps
- pyogrio
- python
- service-workers
- shapely
- sql
- sqlite

Log in or sign up for Devpost to join the conversation.