
🌿 About the Project
Air-Y was born from a simple but powerful idea: we breathe air every second, yet we rarely understand its quality. In many parts of the world, air pollution is a silent threat—impacting health without immediate visibility. We wanted to change that by making air quality visible, interactive, and easy to understand.
💡 Inspiration
The inspiration came from daily life—seeing pollution levels rise while most people remain unaware of what they’re breathing. Existing tools often feel too technical or cluttered.
We asked ourselves: 👉 What if anyone could instantly understand their air like they check the weather?
That question led to Air-Y.
🚀 What We Built
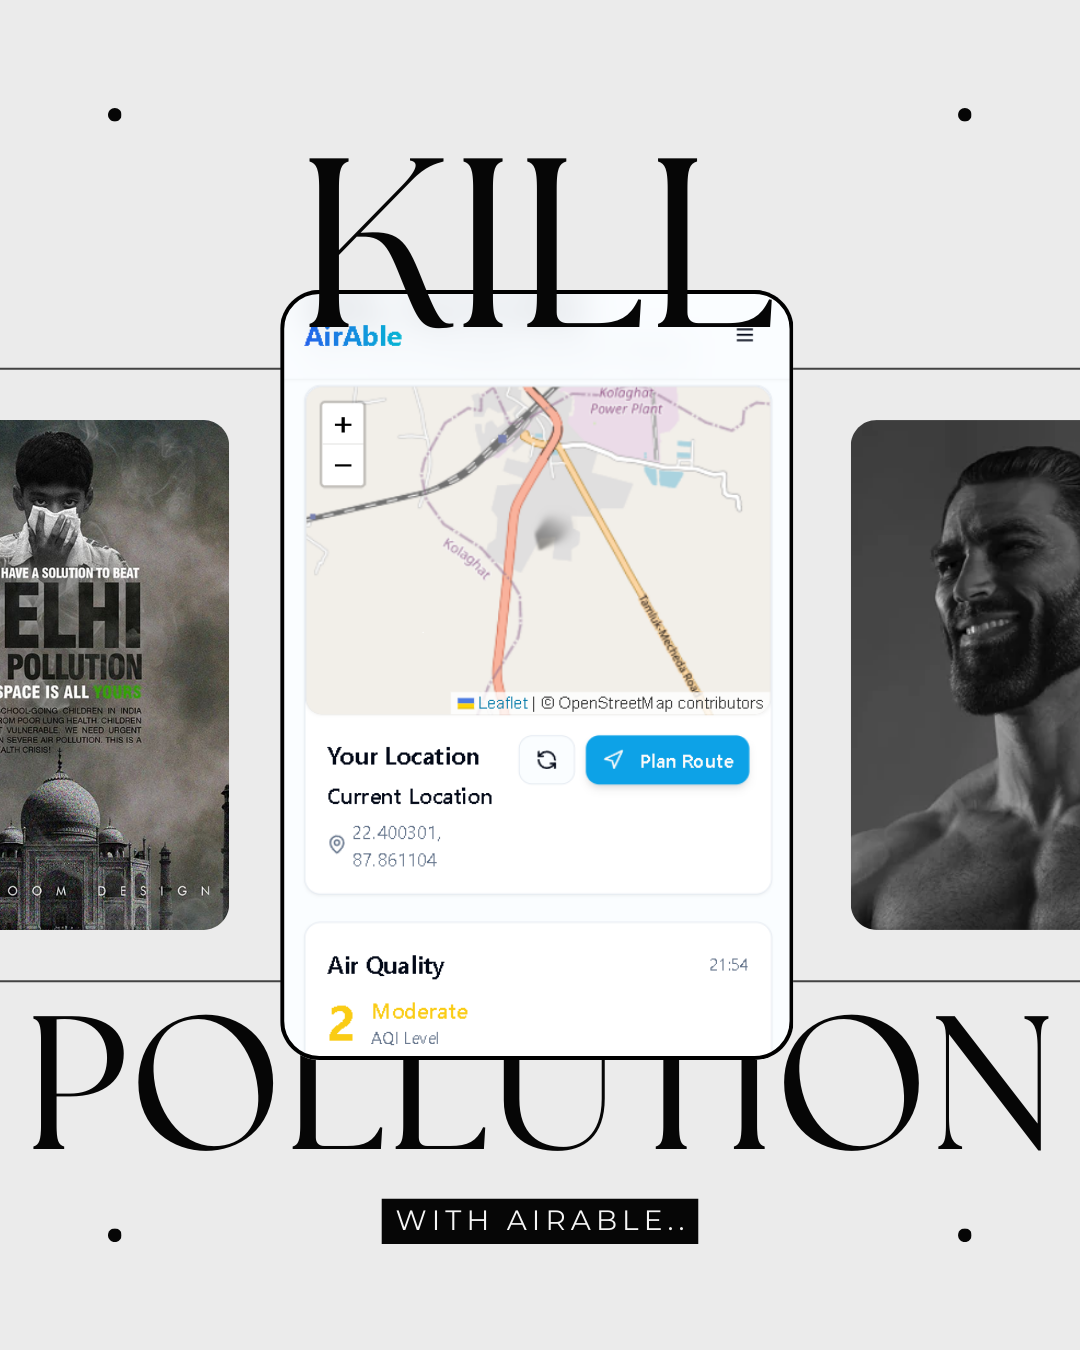
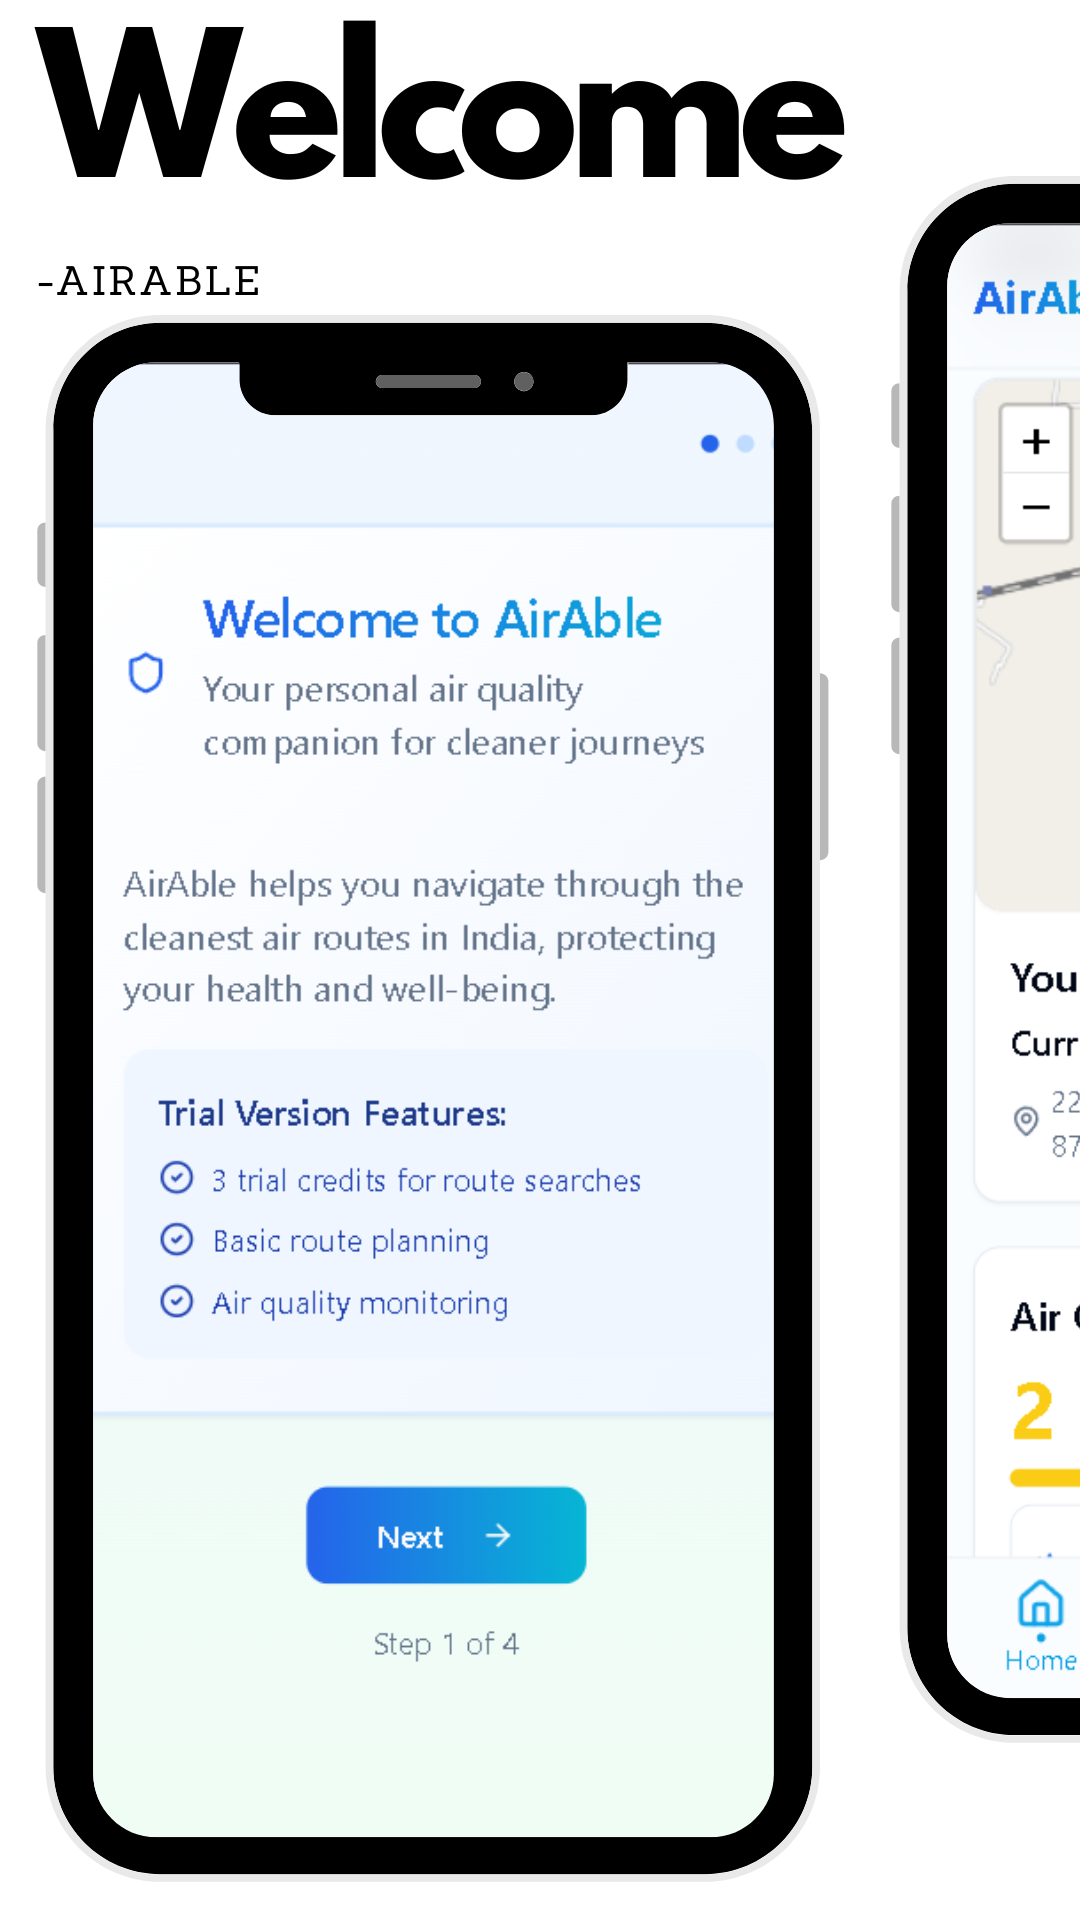
Air-Y is a real-time air quality web app that transforms complex environmental data into simple, actionable insights.
🔍 Key Features:
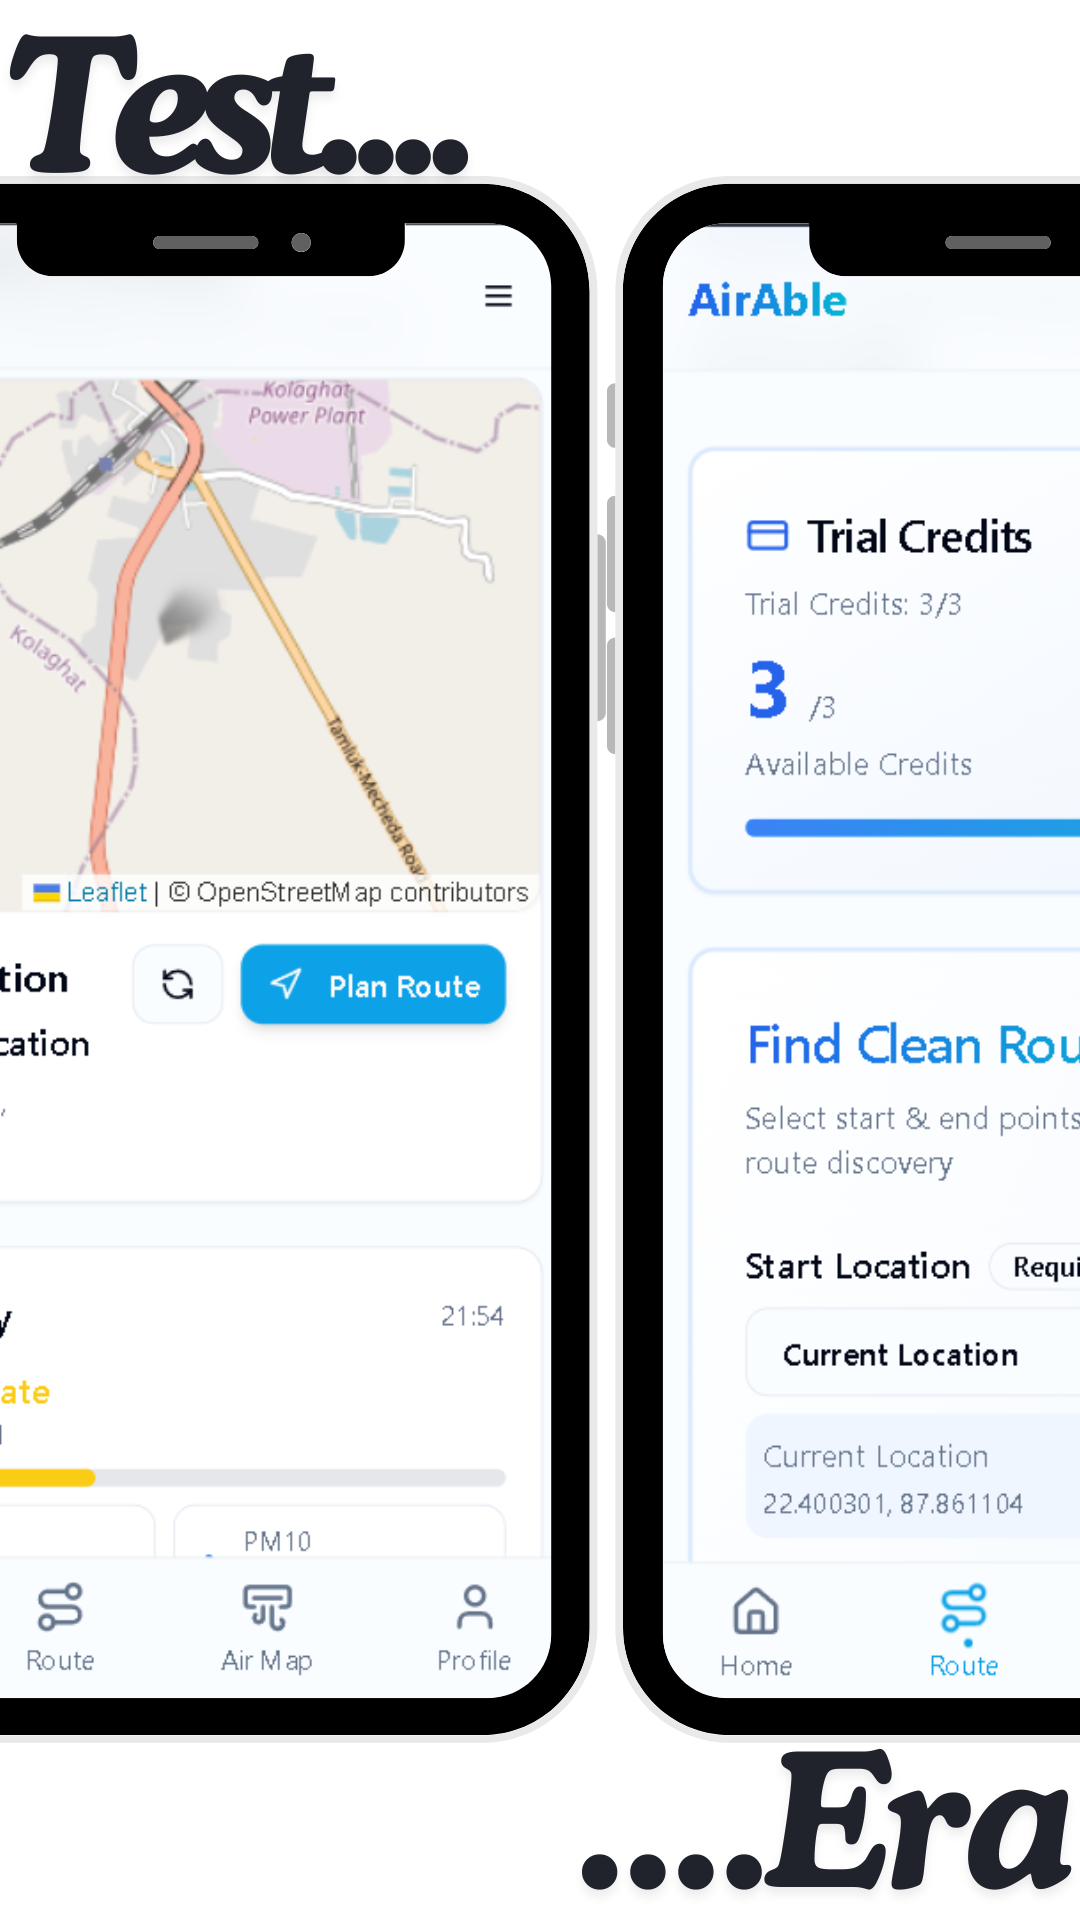
- 🌍 Live Air Quality Index (AQI)
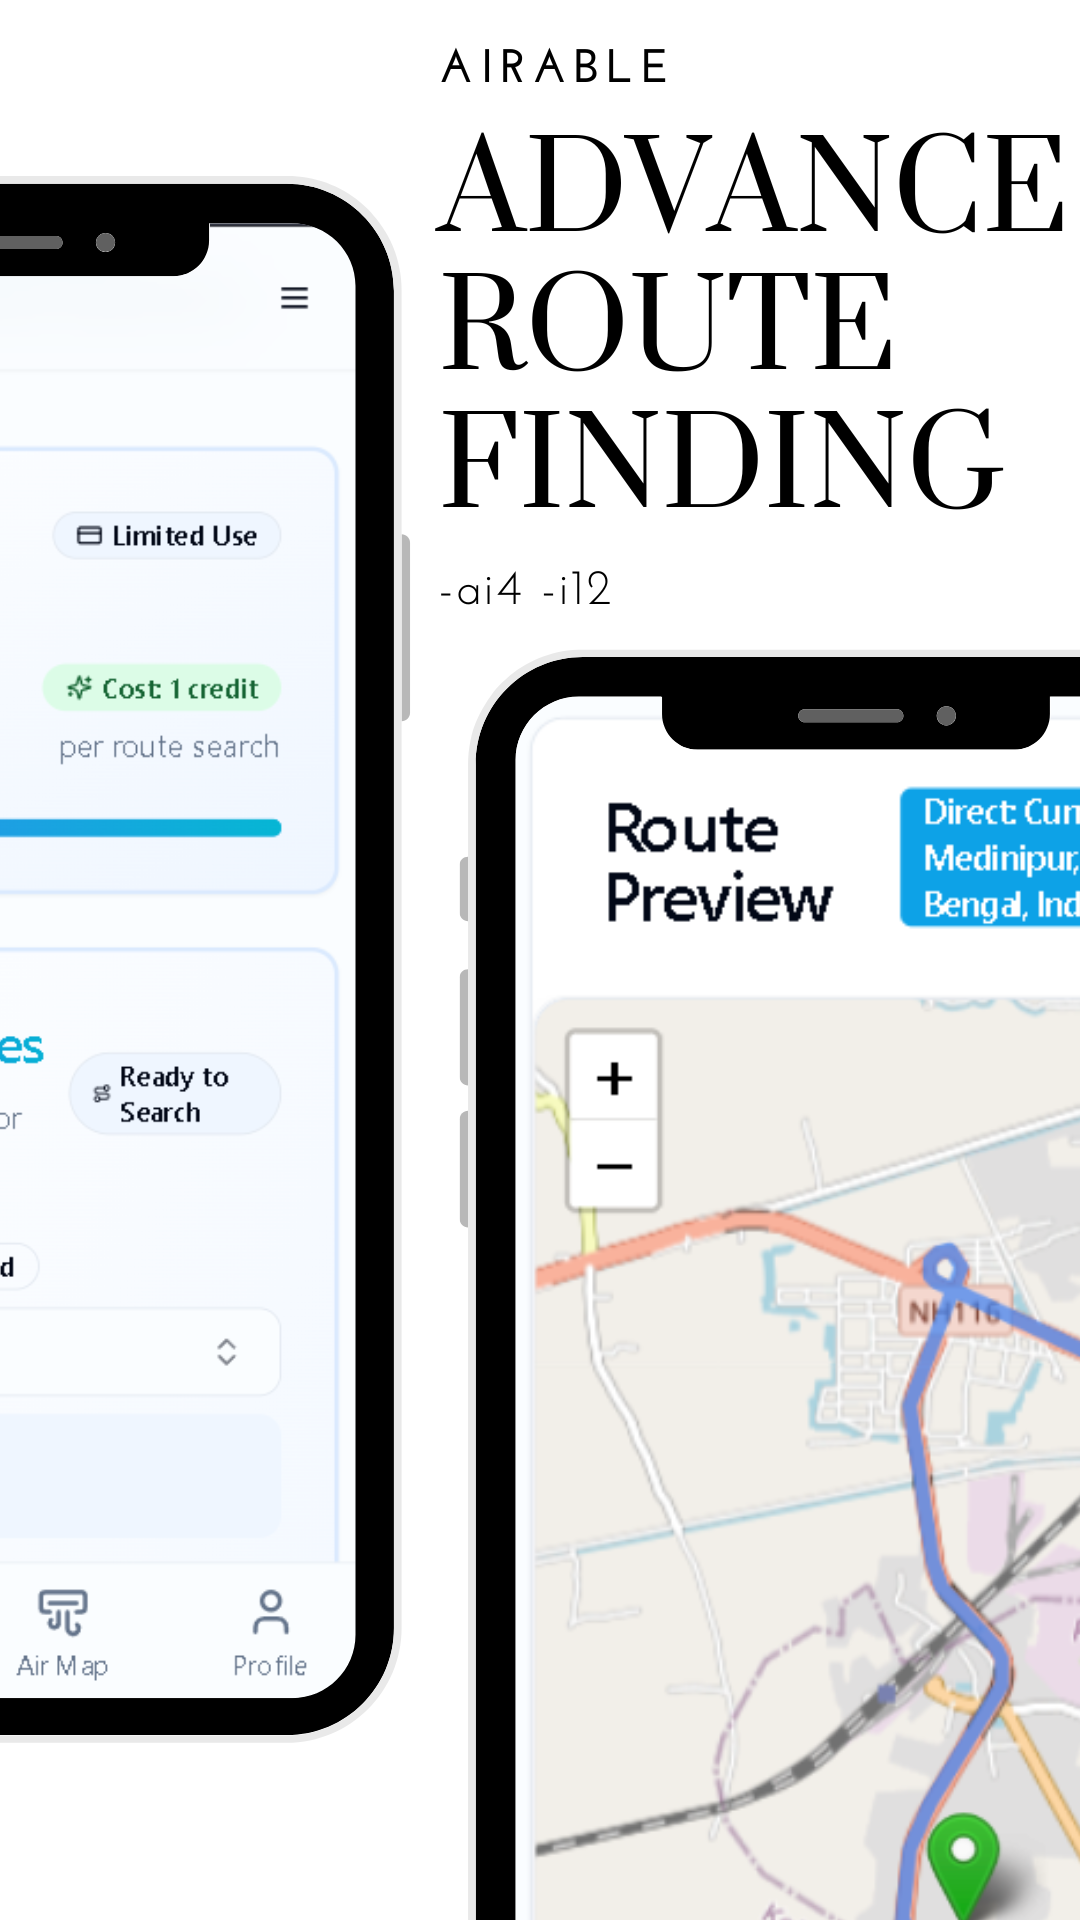
- 🗺️ Interactive map powered by Leaflet + OpenStreetMap
- 🌤️ Weather + pollution data using OpenWeatherMap API
- ❤️ Health suggestions based on AQI levels
- ⚡ Fast, minimal, and responsive UI
🛠️ How We Built It
We focused on building something fast, clean, and scalable:
- Frontend: HTML, CSS, JavaScript
- Maps: Leaflet.js with OpenStreetMap tiles 🗺️
- API: OpenWeatherMap (air pollution + weather data) 🌤️
- Deployment: Netlify
- Security:
.envfor API key management
We used API calls to fetch real-time data and mapped it visually to provide an intuitive user experience.
⚔️ Challenges We Faced
- 🌐 Inconsistent air quality data across different locations
- 🔑 Securing API keys in a deployed environment
- 🧠 Simplifying complex AQI data into user-friendly insights
- ⚡ Optimizing performance while handling real-time updates
- 🗺️ Integrating maps smoothly with live data overlays
🏆 What We’re Proud Of
- 🌱 Turning invisible air data into a visual experience
- ⚡ Building a fast and responsive real-time app
- 🧩 Seamlessly combining maps, weather, and AQI data
- 🌍 Making the app accessible and easy for anyone to use
📚 What We Learned
- How to work with real-time APIs and handle edge cases
- The importance of UX in data-heavy applications
- Secure deployment practices using environment variables
- Integrating mapping systems like Leaflet effectively
- Shipping a complete product under time constraints
🔮 What’s Next for Air-Y
We’re just getting started 🚀
- 🤖 AI-powered personalized health recommendations
- 📈 Predictive AQI forecasting
- 📱 Mobile app version
- 🔔 Smart alerts for dangerous air conditions
- 🌍 Community-driven environmental data
- ⌚ Wearable integration for health tracking
📊 Bonus: Understanding AQI
Air Quality Index (AQI) simplifies pollution levels into a single number:
[ AQI \propto \sum (pollutant\ concentration \times risk\ factor) ]
Higher AQI = higher health risk 🚨
Built With
- css
- dotenv
- geolocation-api
- html
- javascript
- leaflet.js
- netlify
- openstreetmap
- openweathermap-api

Log in or sign up for Devpost to join the conversation.