-
-
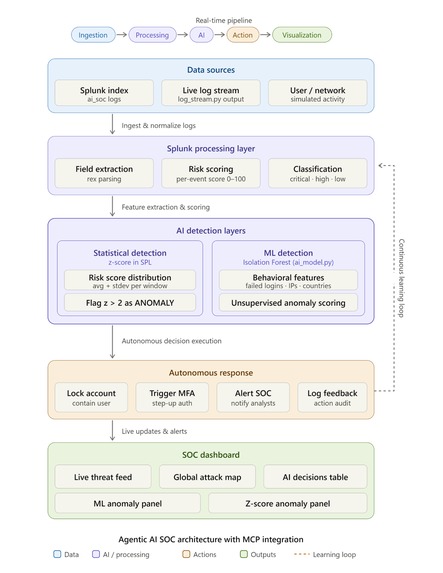
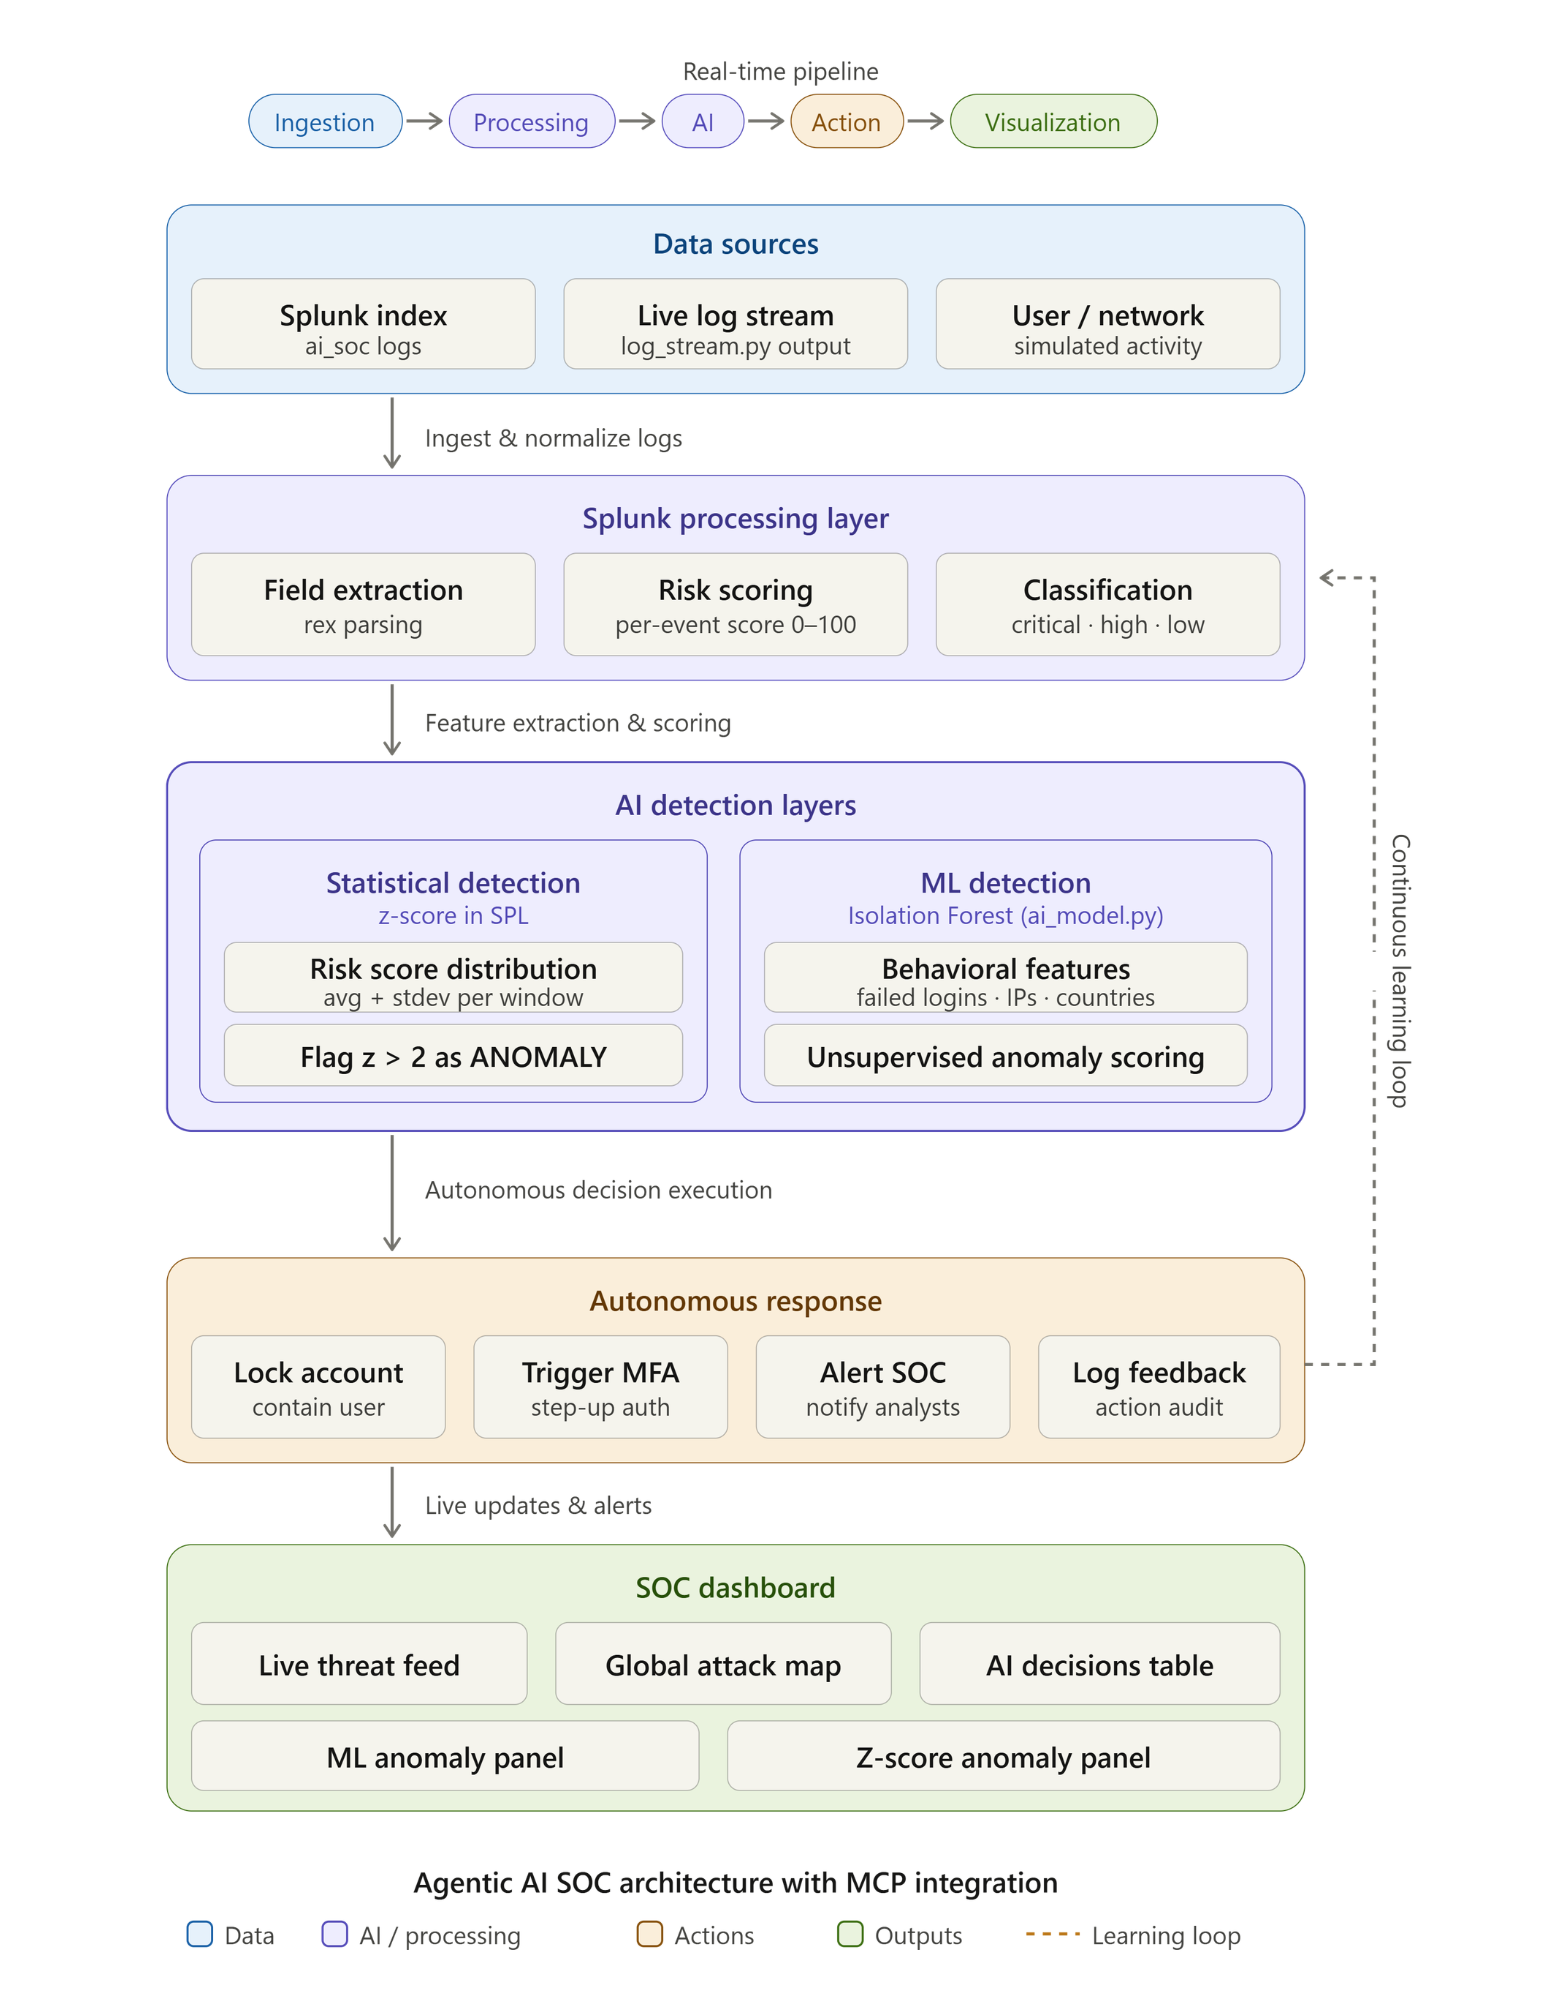
Project Architecture
-
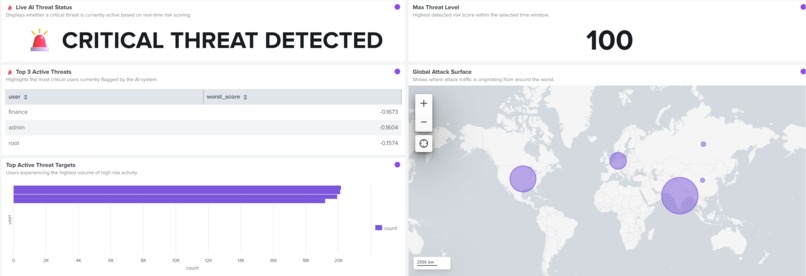
Dashboard1
-
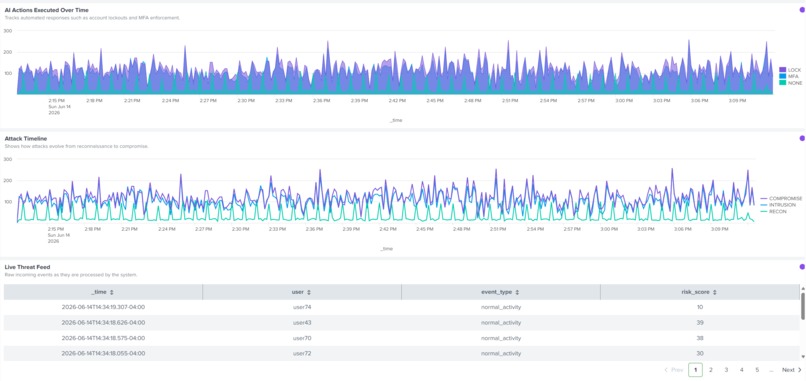
Dashboard2
-
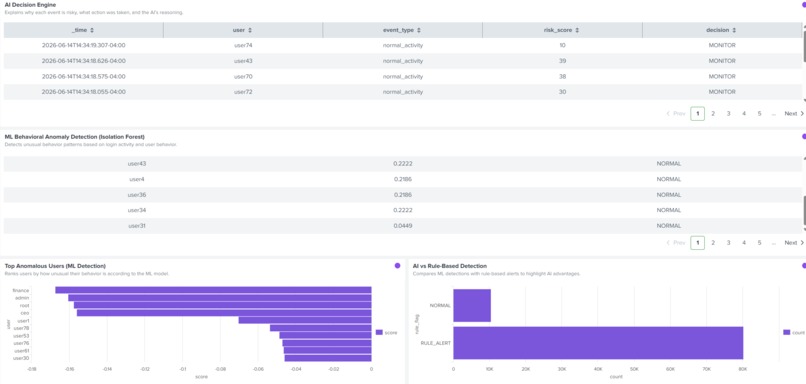
Dashboard3
Inspiration
As a Computer Science, Statistics & Data Science, and Artificial Intelligence triple major student with a cybersecurity focus, I've spent a lot of time learning how systems detect threats. Most Security Operations Centers can identify attacks. But they still rely on humans to respond.
That gap is the problem!
Attackers move in seconds. Defenders often take minutes or longer because every step requires human intervention. I wanted to build something that doesn't just detect attacks, but actually understands what's happening and responds in real time, while still being transparent enough for humans to trust.
What it does
This project is an AI-powered Security Operations Center built on Splunk that:
- Detects cyber-attack patterns in real time
- Explains why activity is risky
- Responds automatically(lock account, trigger MFA, or monitor)
- Provides a fully auditable decision trail
It combines rule-based detection, statistical analysis, and machine learning to create a system that doesn't just alert, it acts.
How I built it
Event Simulation
A Python script (log_stream.py) continuously generates realistic security events, logins, failures, IPs, geolocations, device types, simulating live enterprise telemetry.
Data Ingestion
Splunk monitors the live log file and ingests events into index: ai_soc in real time.
Processing & Detection
Using SPL (rex, eval, stats), I extract fields and classify every event into a threat level:
| Level | Threshold |
|---|---|
| CRITICAL | risk ≥ 90 |
| HIGH | risk ≥ 75 |
| NORMAL | risk < 75 |
AI Layer 1 - Machine Learning (Isolation Forest)
ai_model.py runs as a separate Python process* alongside Splunk. It trains an Isolation Forest on behavioral features per user per minute:
- Failed logins
- Distinct IP addresses
- Number of countries accessed
- Sensitive actions taken
The model never sees risk scores or event labels, it finds attacks by learning what normal looks like and flagging everything that doesn't fit.
AI Layer 2 - Statistical Anomaly Detection
$$ z = \frac{x - \mu}{\sigma} $$ For every one-minute window, I calculate the z-score of each user's average risk against the population mean. Anyone more than 2 standard deviations above the mean is flagged, no training data required.
Response Engine
- risk ≥ 90 → Lock account
- risk ≥ 75 → Trigger MFA
- else → Monitor
Every action is logged back into Splunk.
Visualization
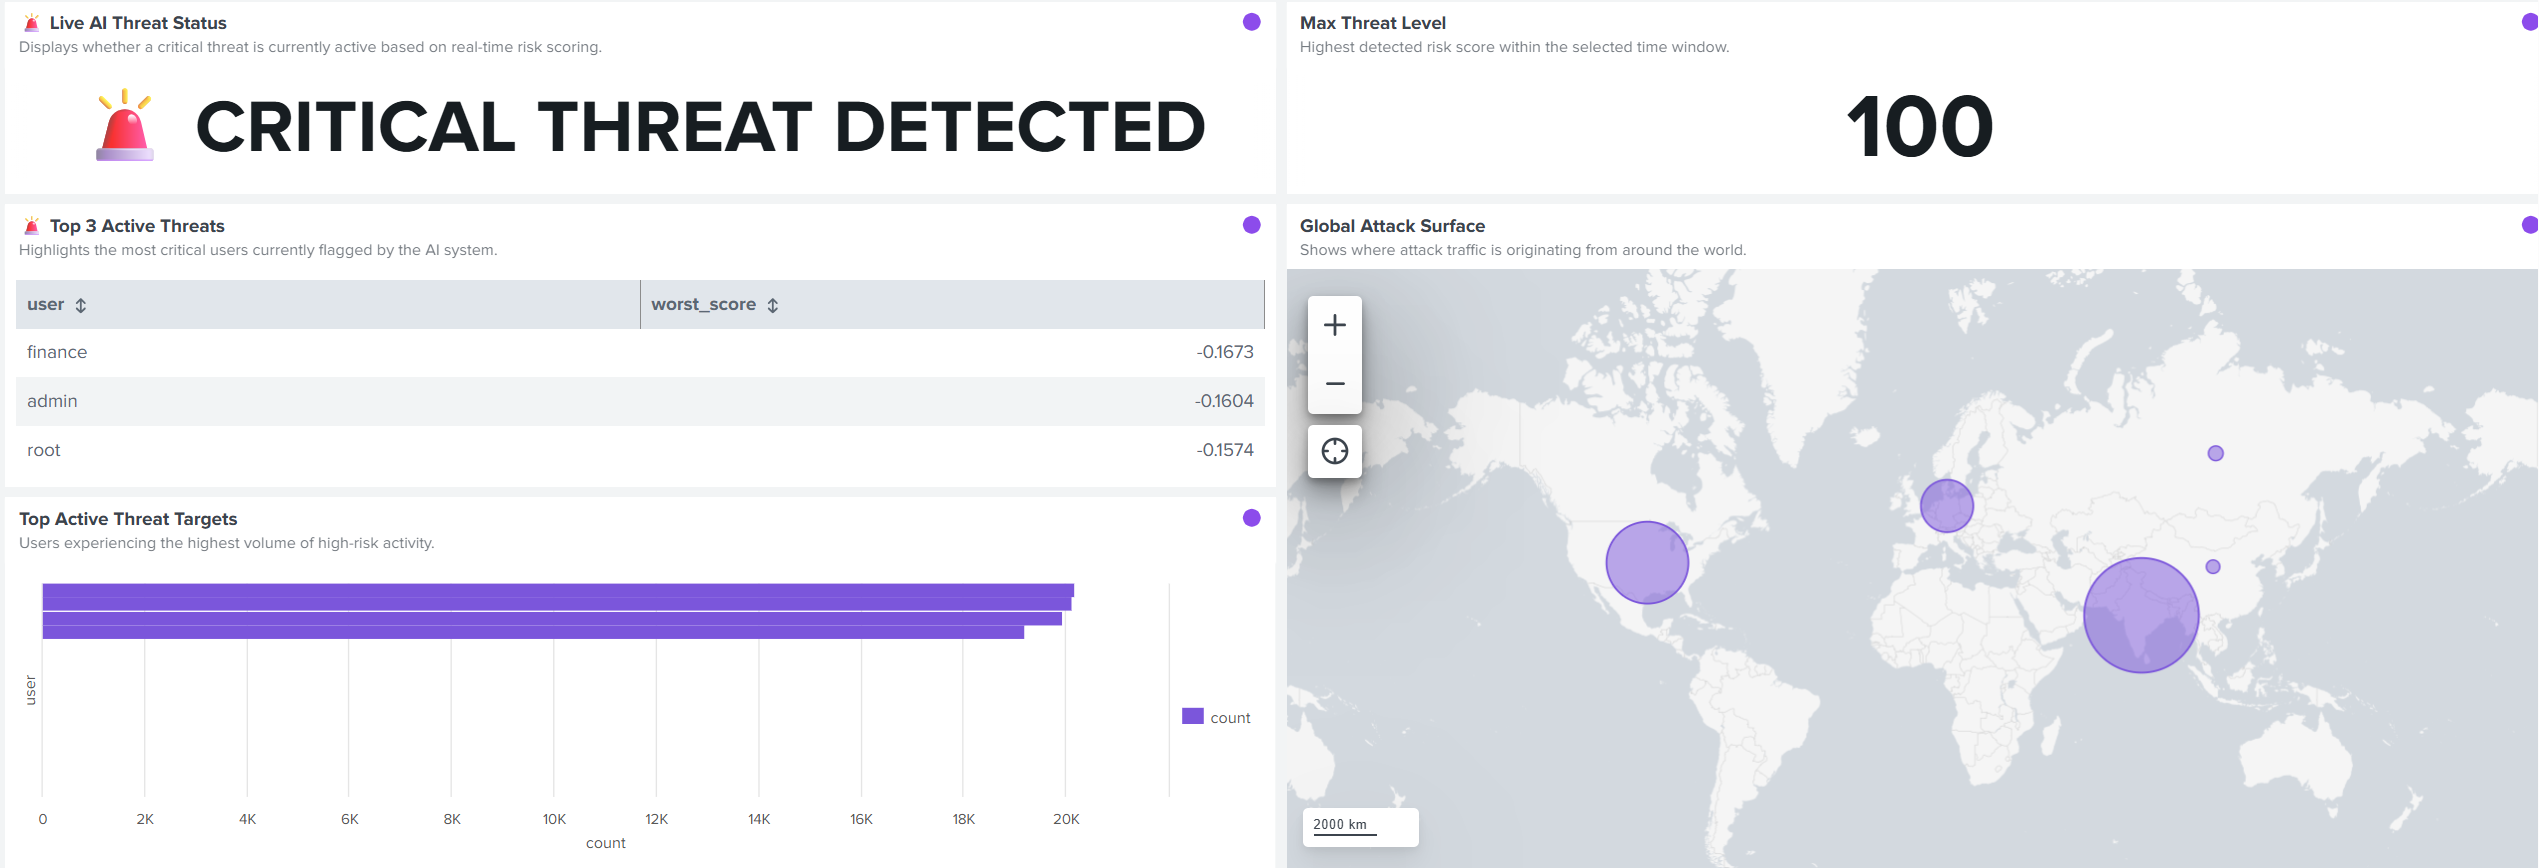
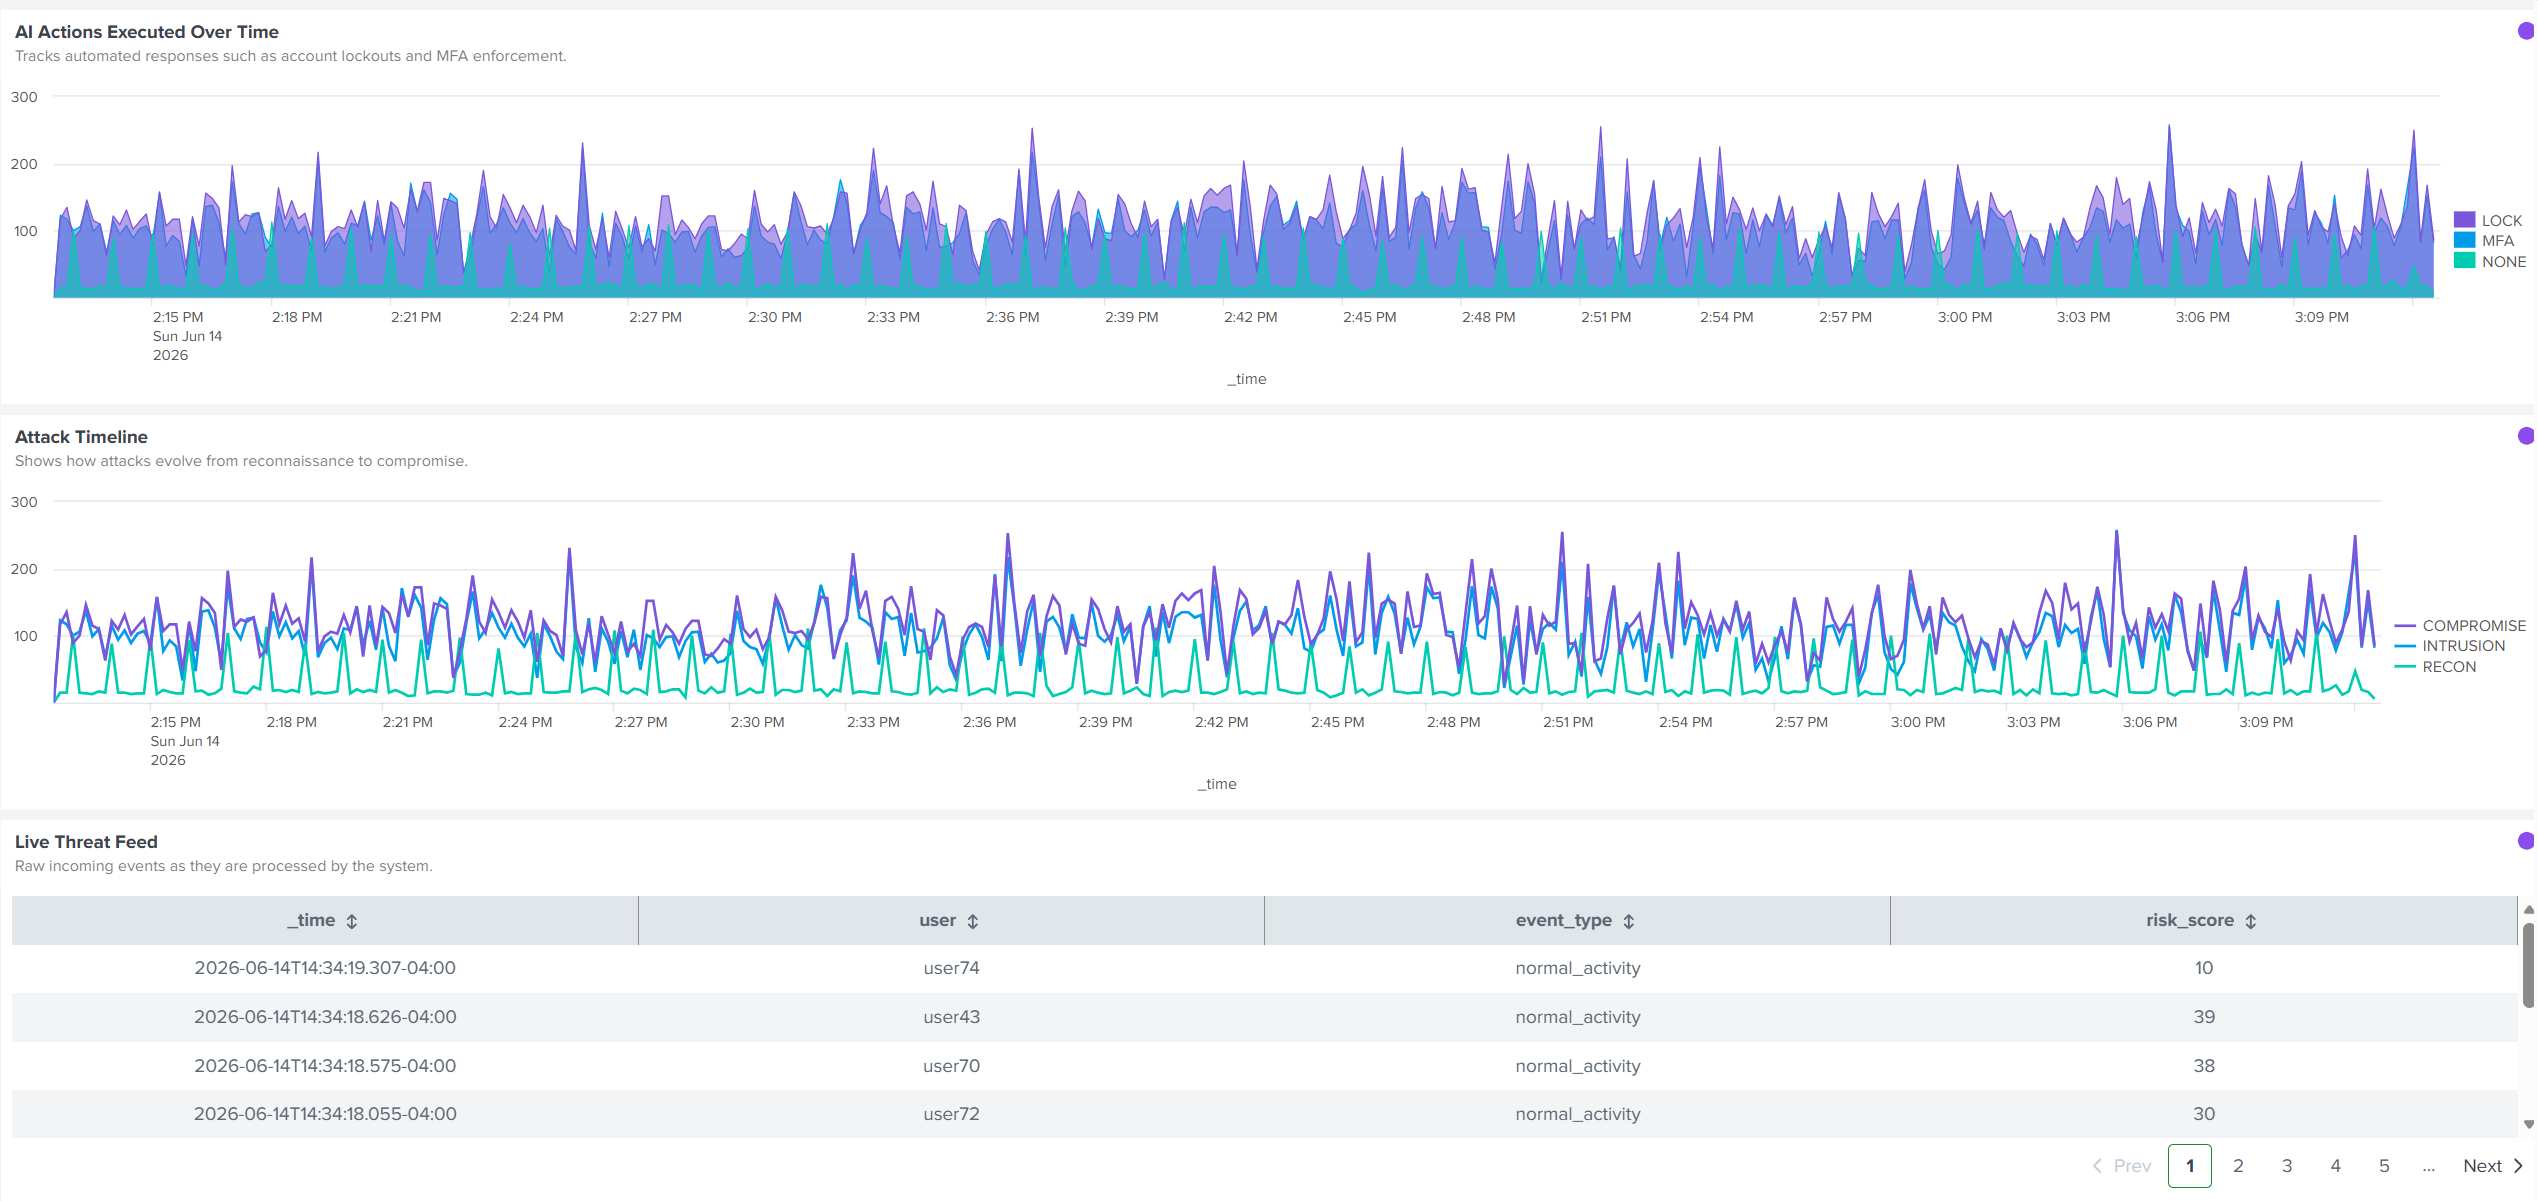
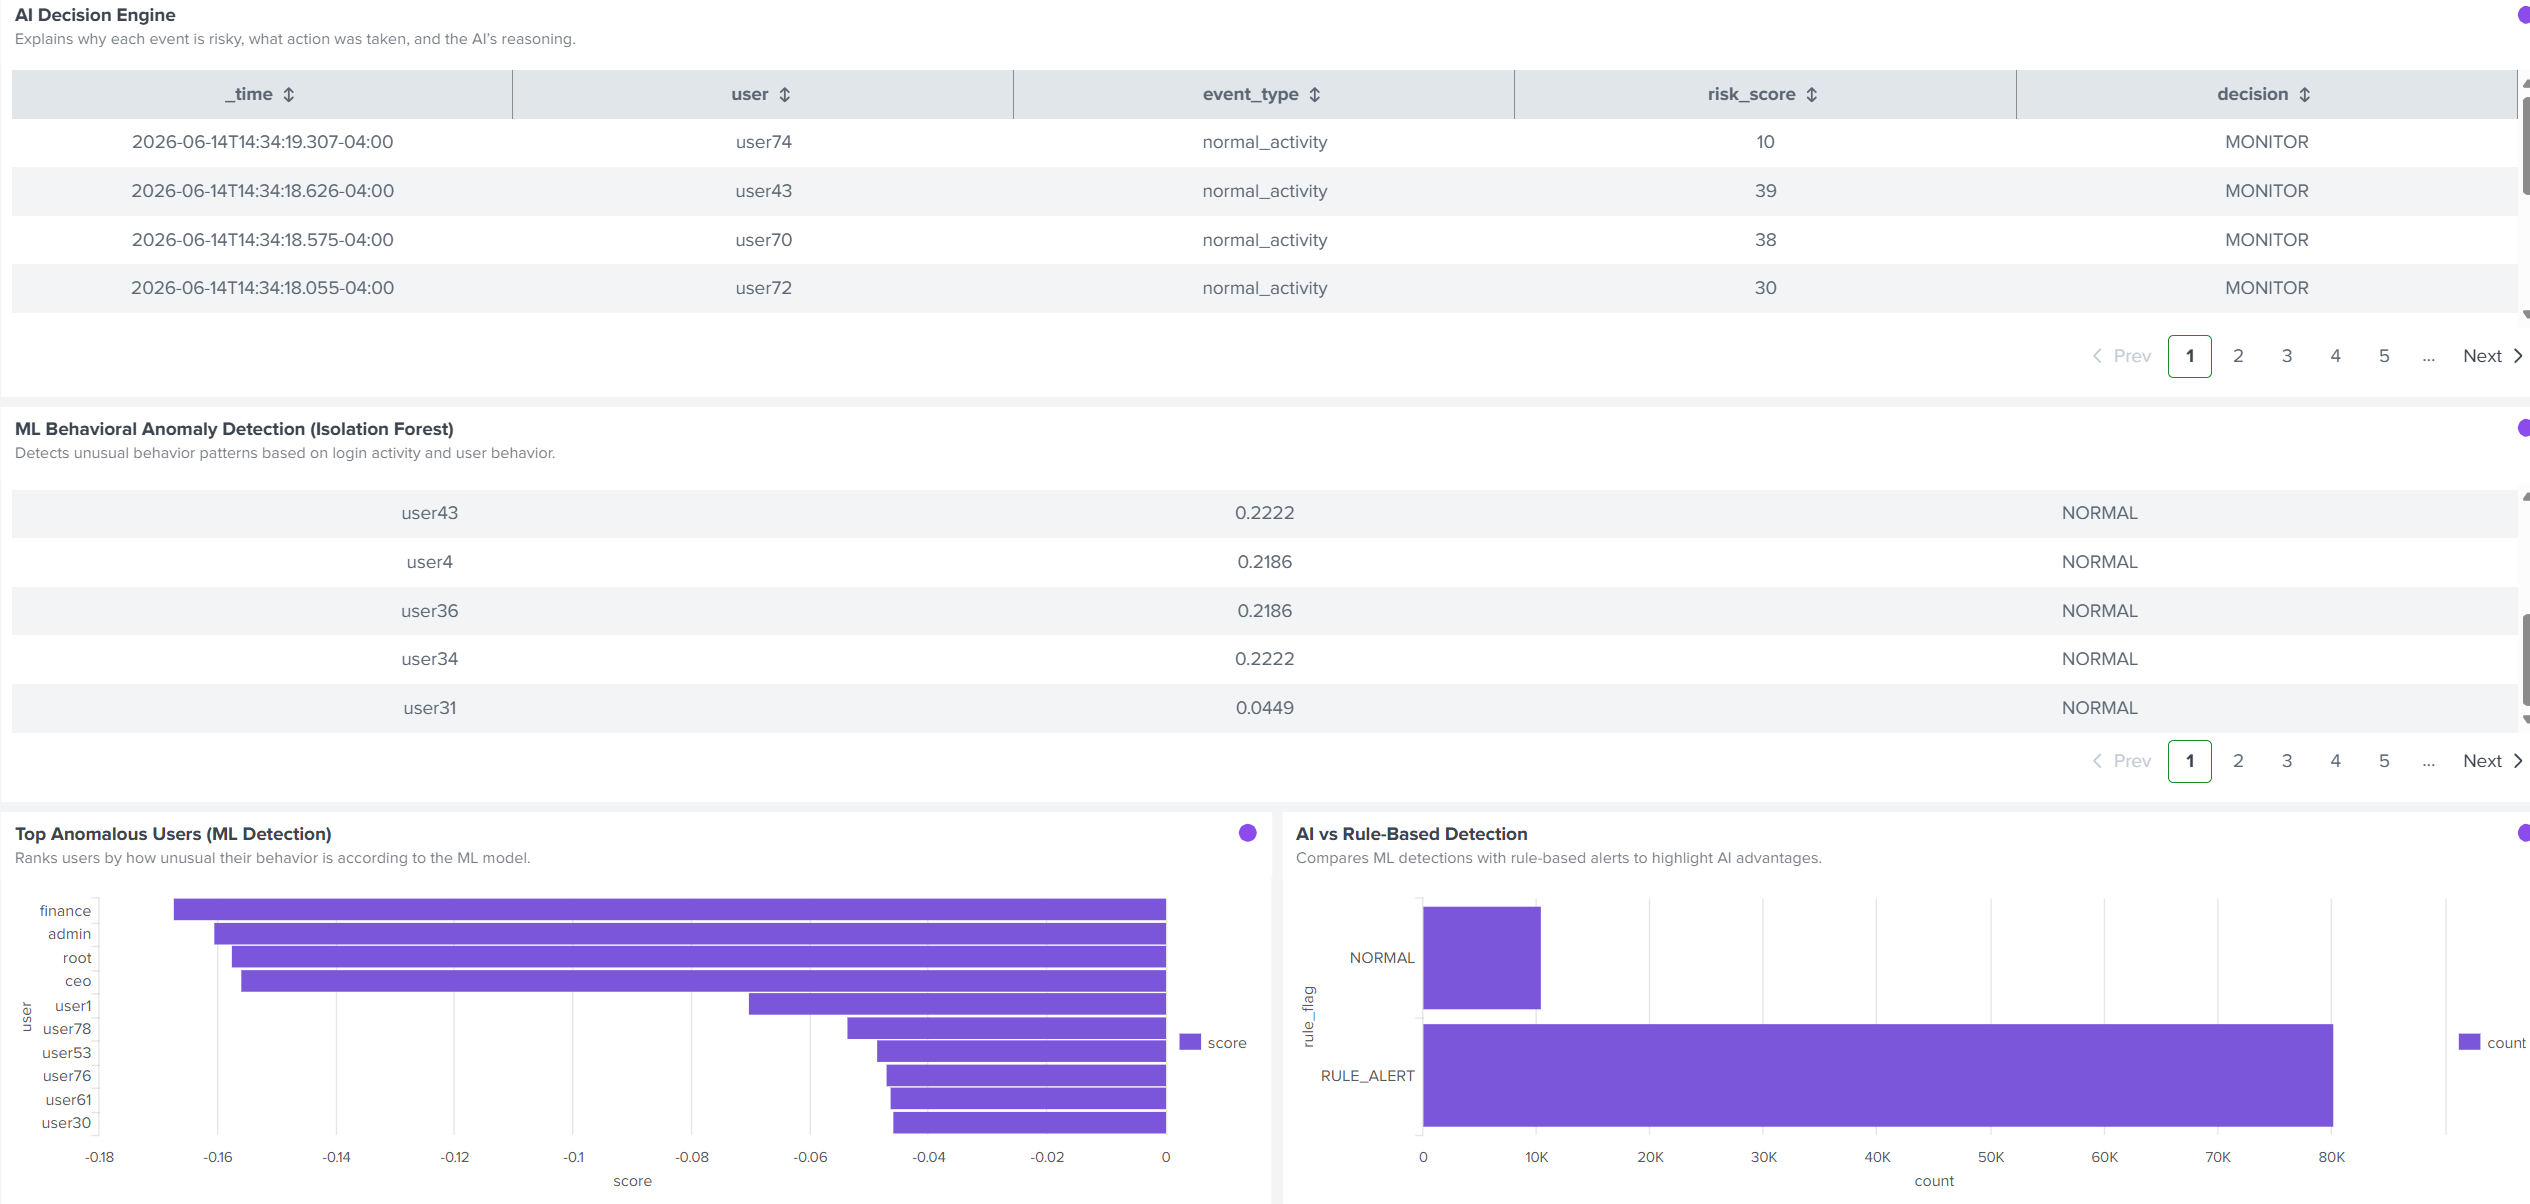
A real-time Splunk dashboard with 10 panels:
- Live threat feed - raw events as they arrive
- Global attack map - geographic origin of threats
- AI decision engine - what happened, why it's risky, what was done
- ML anomaly detection panel - Isolation Forest results
- Z-score anomaly detection panel - statistical outliers
- Automated response timeline - every acction logged in real time
Visualization
A real-time Splunk dashboard with 10 panels:
- Live threat feed — raw events as they arrive
- Global attack map — geographic origin of threats
- AI decision engine — what happened, why it’s risky, what was done
- ML anomaly detection panel — Isolation Forest results
- Z-score anomaly detection panel — statistical outliers
- Automated response timeline — every action logged in real time
Challenges I ran into
I have never used Splunk before!
Learning the new interface was tricky but once I got the hang of it and figured out I can also work backend with my code, it got much easier!
Getting real AI working inside Splunk
Splunk’s built-in ML toolkit had dependency issues in my environment. Instead of forcing it, I redesigned the ML layer as an external Python service that feeds results back into Splunk, which is actually closer to a real production architecture.
Parsing Python-style logs
The event generator outputs Python dictionaries, not JSON. That meant I couldn’t rely on native parsing and had to use rex for every field extraction, tricky, but ultimately more flexible.
Keeping everything synced in real time
Coordinating the event generator, ML model, and Splunk dashboard required careful timing. The log writer, 30-second ML scoring window, and Splunk ingestion pipeline all had to stay aligned.
Making it feel real, not just a demo
No hardcoded outputs. No fake data. Everything is driven by live streaming events, which made debugging harder, but the result far more convincing.
Accomplishments that I’m proud of
- Built a fully live, end-to-end AI SOC pipeline on Splunk
- Implemented two independent anomaly detection systems that agree without communicating
- ML model identified all four attacked accounts using behavior alone, no labels, no risk scores
- Every decision is explainable, the dashboard shows what happened, why it was risky, and what was done
- Designed a dashboard that looks and behaves like a real security platform
What I learned
- The difference between detecting anomalies vs. understanding behavior patterns
- How to integrate machine learning into real-time streaming pipelines
- Why explainability is non-negotiable in security AI, automation only works if analysts trust it
- How to adapt when tools fail and turn limitations into better architecture
What’s next for AI-Powered Cyber Attack Command Center
- Integrate with real identity providers (Okta, Azure AD)
- Expand ML models:
- Time-series analysis
- Sequence detection
- LSTM for attack pattern prediction
- Time-series analysis
- Automated incident reports and response playbooks
- Full agentic AI integration with Splunk MCP Server for governed autonomous response

Log in or sign up for Devpost to join the conversation.