-
-
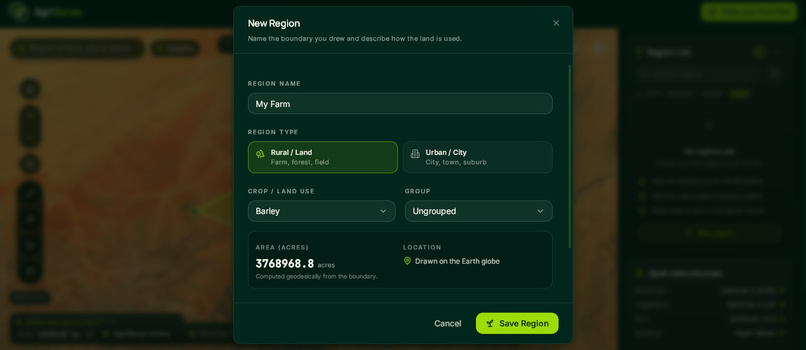
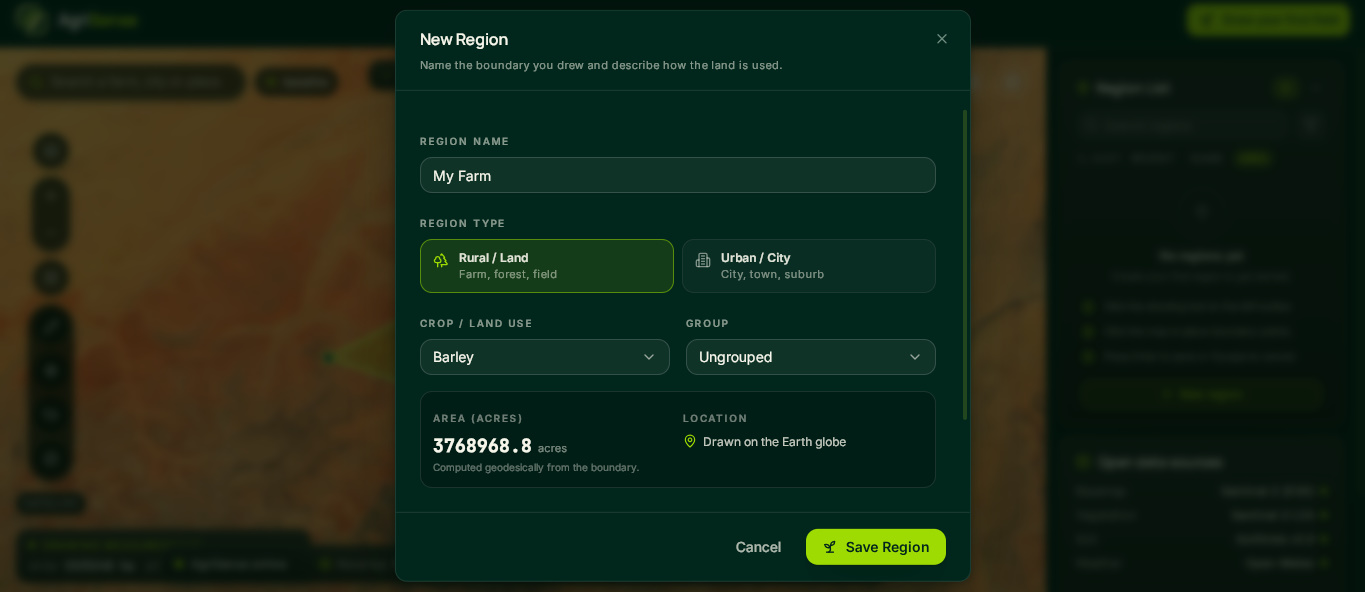
Form - Saving the Farm
-
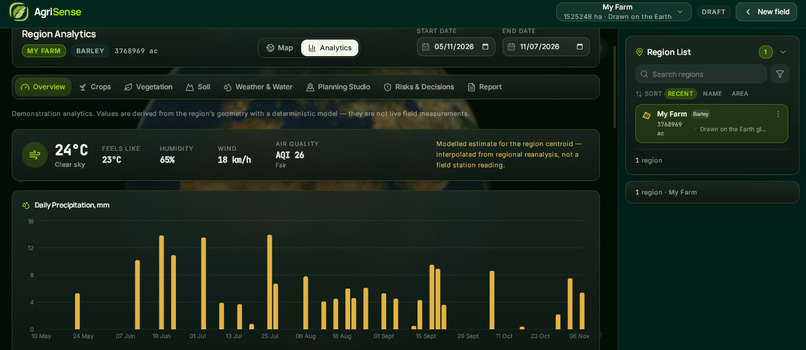
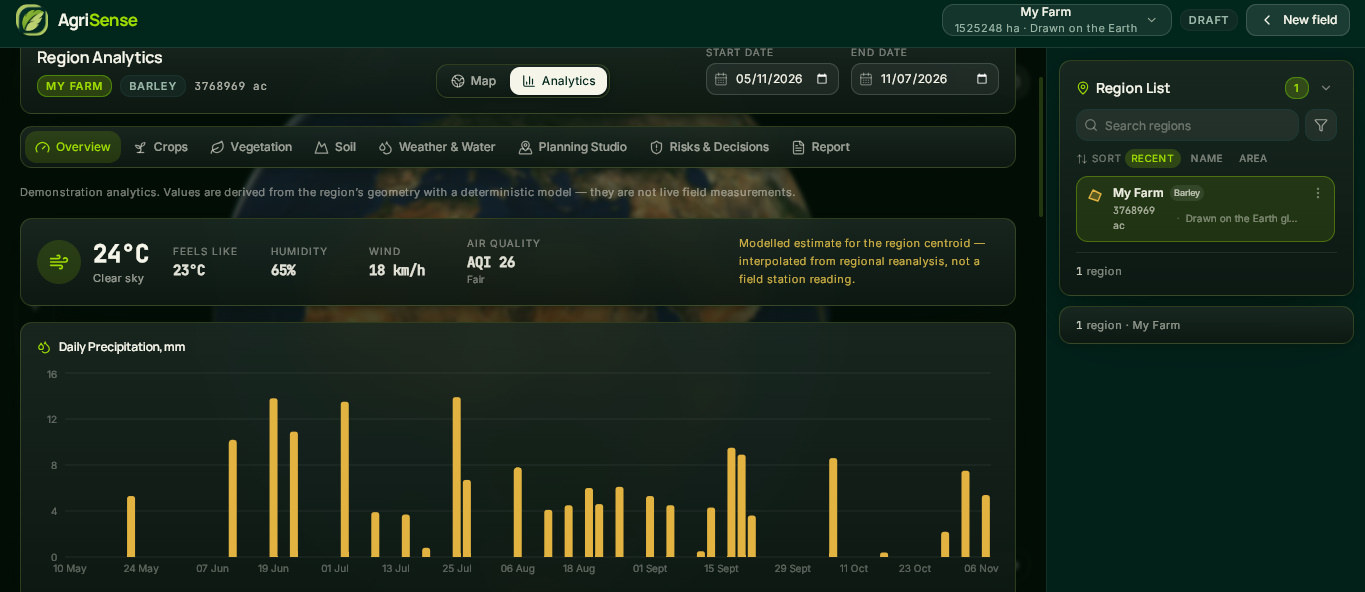
Analytics of the area
-
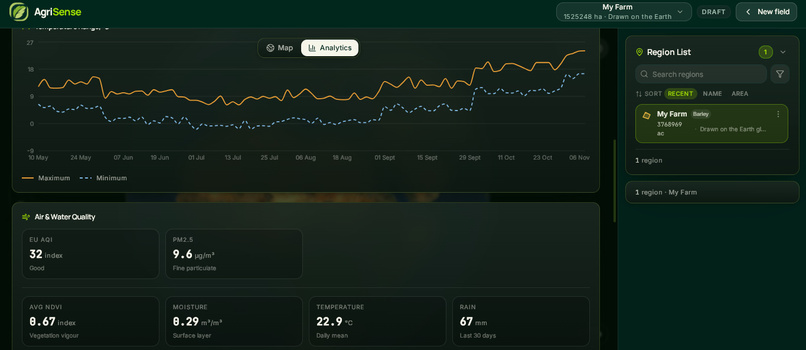
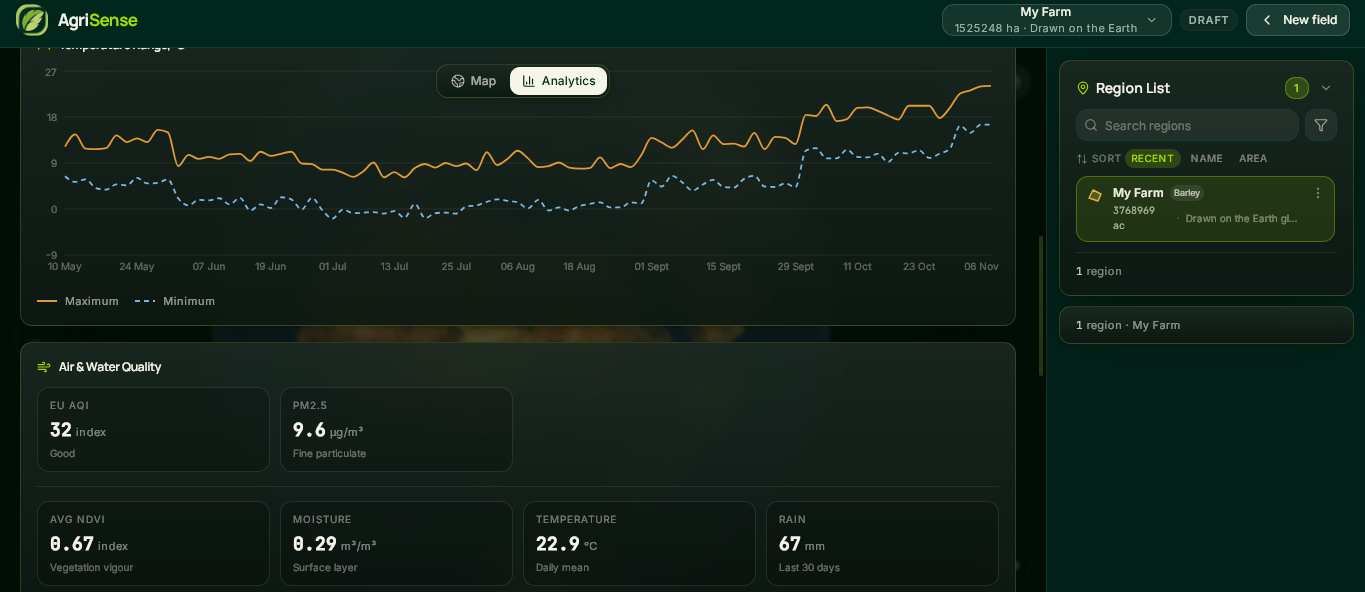
Precipitation & Temperature Analytics
-
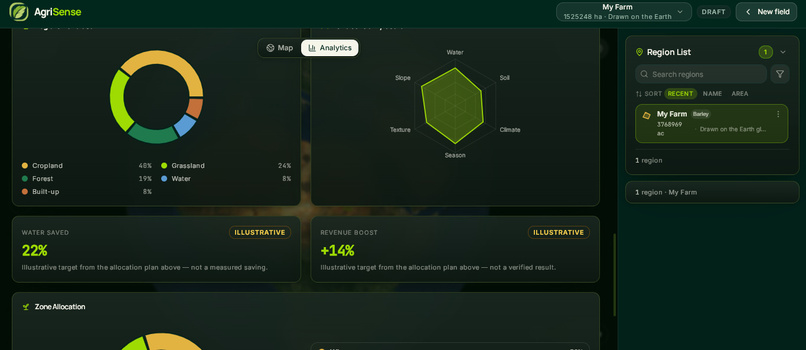
Soil Analytics
-
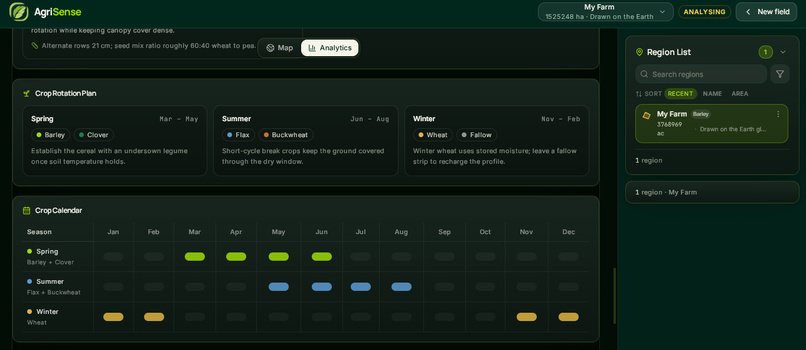
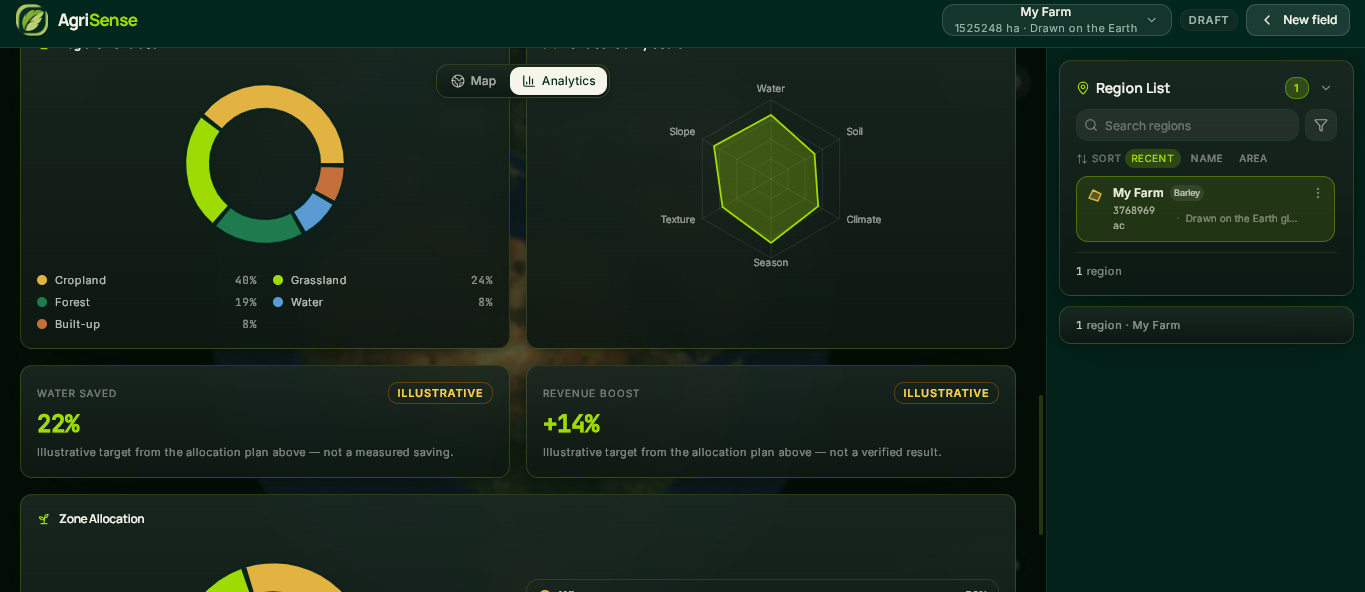
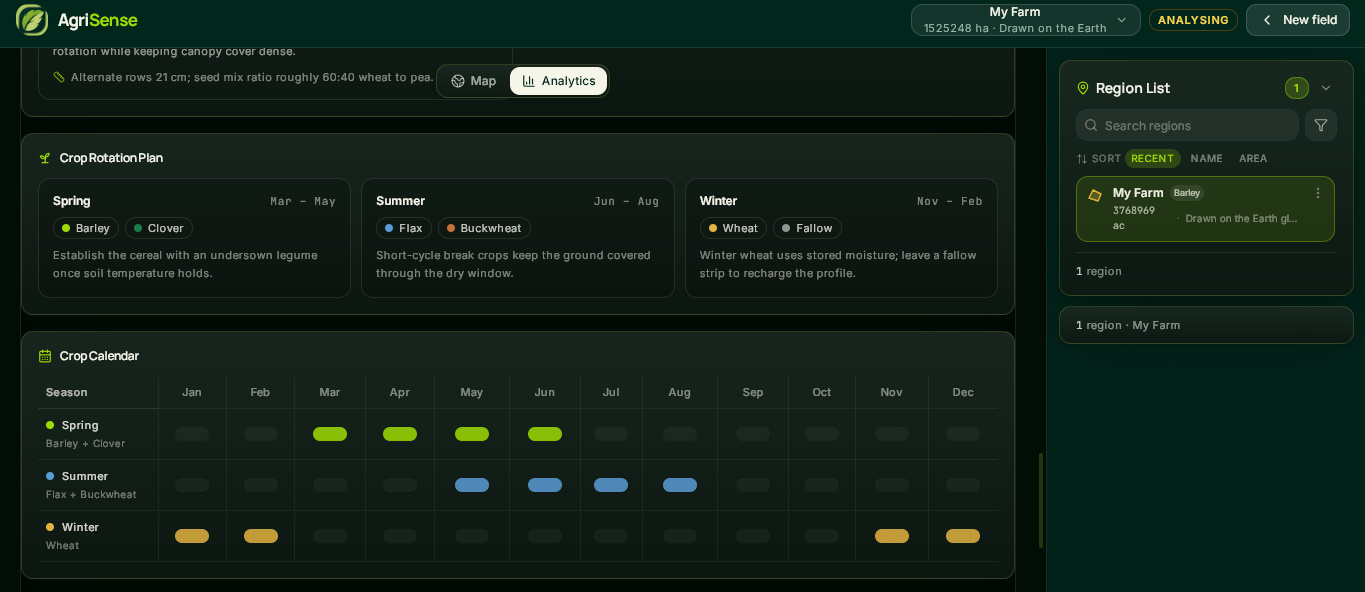
Crop Planning
-
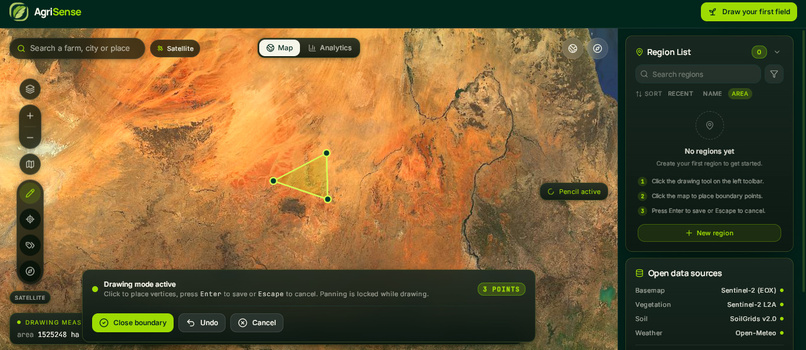
Workspace - Drawing an area
-
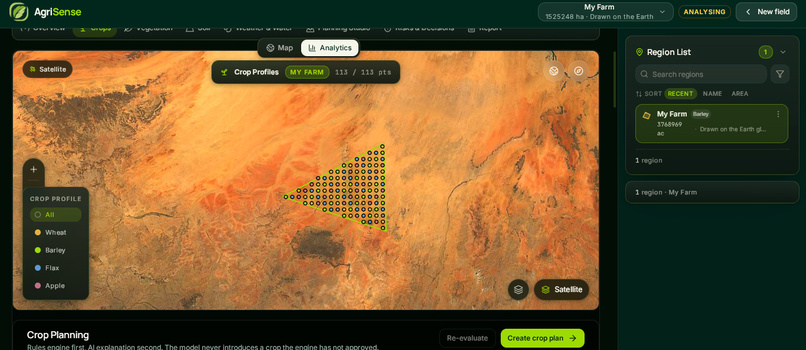
Crop Simulation
AgriSense
Turn agricultural data into smarter land decisions.
AgriSense is an agricultural intelligence and land-planning platform that combines satellite imagery, environmental datasets, interactive mapping, and AI-powered analysis to help users understand agricultural regions and make more informed farming decisions.
Instead of relying on static maps or disconnected data sources, AgriSense brings land exploration, crop suitability, vegetation monitoring, soil insights, weather analysis, and agricultural planning into one interactive, map-centered workspace.





🌍 The Inspiration
Agriculture depends on understanding the land.
Farmers, researchers, and agricultural planners have to weigh many factors before making a decision: soil conditions, vegetation health, rainfall, temperature, water availability, and seasonal change.
But that information is scattered. Satellite imagery lives in one catalogue, weather in another, soil data in a third. Understanding how those factors combine for one specific field takes time and specialist knowledge.
We kept coming back to a simple question:
What if a user could draw a region on a map and immediately explore the real environmental data that explains its agricultural potential?
That question became AgriSense.
❌ The Problem
| Problem | Why It Matters |
|---|---|
| 🌱 Limited land insight | Understanding a region's agricultural potential takes far more than looking at a map. |
| 🛰️ Disconnected data | Satellite, weather, and soil datasets are hard to explore together for one place. |
| 🌦️ Changing conditions | Rainfall, temperature, and vegetation shift over time and change what a field can support. |
| 📊 Complex data | Environmental datasets are hard to interpret without clear visualisation and context. |
| 🗺️ No regional anchor | Users need a way to select, save, and return to specific areas of interest. |
| 🎯 Uncertain planning | Planning benefits from seeing the evidence, the constraints, and the scenarios side by side. |
The deeper problem is that agricultural information is often available — but not connected to a specific region or decision.
✅ The Solution
AgriSense turns agricultural and environmental data into an interactive land-analysis experience.
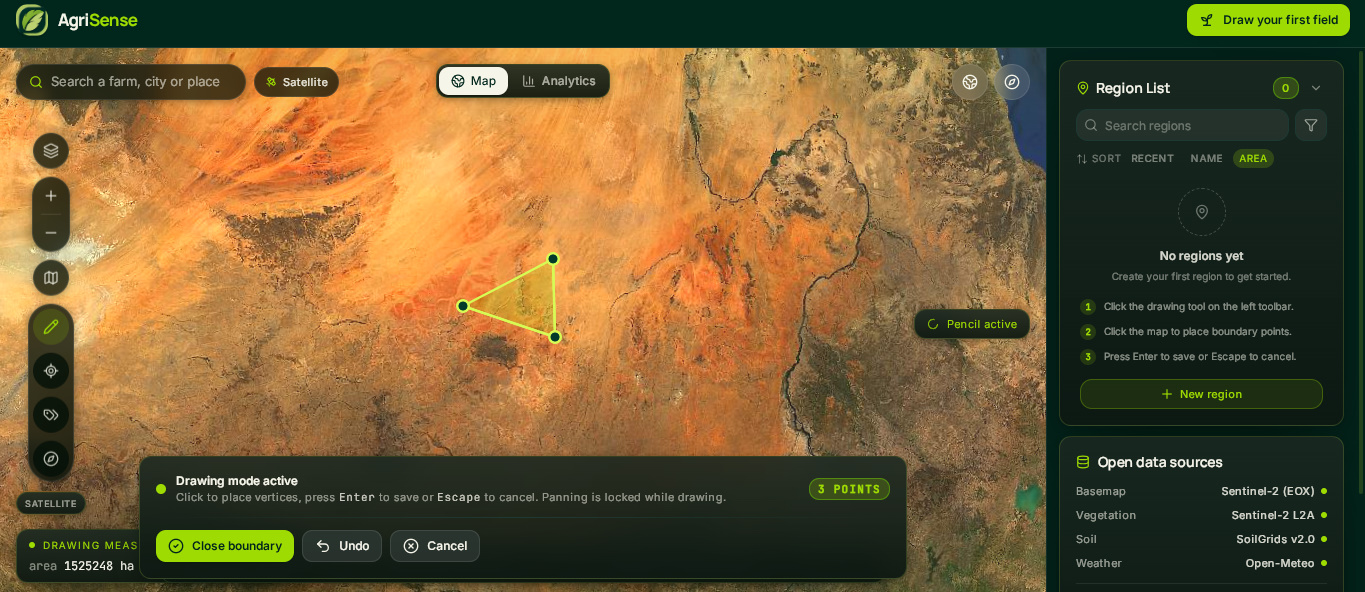
A user draws a field, and the platform opens two connected workspaces around it: an Earth Explorer map and a Region Analytics surface, both sharing the same selected region.
1. 🗺️ Interactive Earth Explorer
The geographic starting point for everything else. Users can:
- Search for a location by name
- Explore satellite, terrain, street, and NASA imagery layers
- Draw a custom region by placing boundary points
- Save, name, colour, and categorise regions
- Browse and filter a persistent region list
- Select a region to drive the analytics
- Switch between Map and Analytics views
Drawing is keyboard-driven: click to place points, Enter to save, Escape to cancel.
2. 🛰️ Real-Data Agricultural Analysis
AgriSense is built to work with real geospatial datasets, not static samples. Depending on location and availability, it uses:
- Copernicus Sentinel-2 L2A — surface-reflectance imagery for vegetation analysis
- EOX Sentinel-2 cloudless — the default keyless satellite basemap
- NASA GIBS — near-real-time MODIS Terra true-colour imagery
- ISRIC SoilGrids v2.0 — soil properties, texture, and depth
- Open-Meteo — ERA5 archive, forecast, and air quality
- OpenStreetMap / Nominatim — geocoding and geographic context
Availability, spatial coverage, and update frequency depend on the dataset and the location.
3. 🌿 Vegetation Monitoring
AgriSense computes vegetation condition directly from satellite imagery. It retrieves Sentinel-2 red and near-infrared bands and calculates NDVI in the browser to show how vegetation varies across a field.
4. 🌱 Crop Suitability and Planning
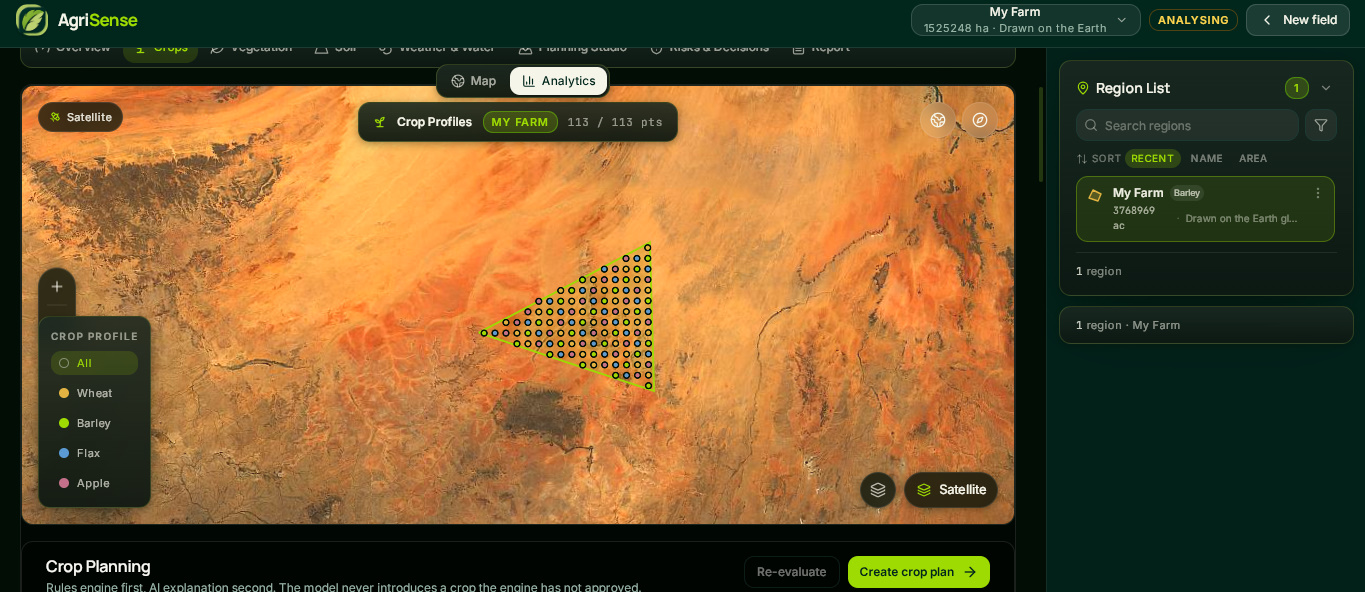
Regional analysis connects to crop-focused planning. A deterministic rules engine scores 68 crop profiles against the field's real environmental conditions — water, climate, season, soil pH, and soil texture — and returns a transparent verdict.
Suitability should be read as evidence-based guidance, not a guarantee of crop performance.
5. 🌧️ Weather, Soil, and Water Insights
Environmental conditions are brought together with charts and visualisations covering precipitation, temperature, soil indicators, vegetation condition, and air quality.
6. 📊 Regional Analytics
Selecting a region opens eight focused sections that share the same map shell:
Overview · Crops · Vegetation · Soil · Weather & Water · Planning Studio · Risks & Decisions · Report
7. 🧪 Planning and Scenario Exploration
The Planning Studio lets users allocate crops across zones and explore agricultural scenarios. Scenario outputs are explicitly labelled as illustrative, separate from observations and measurements.
🔄 The AgriSense Workflow
        ┌──────────────────────┐
        │   Draw a Region      │
        │      on the Map      │
        └──────────┬───────────┘
                   │
                   ▼
        ┌──────────────────────┐
        │  Retrieve Available  │
        │   Geospatial Data    │
        └──────────┬───────────┘
                   │
                   ▼
        ┌──────────────────────┐
        │  Compute Indicators  │
        │   NDVI · Area · Soil │
        └──────────┬───────────┘
                   │
                   ▼
        ┌──────────────────────┐
        │  Score Crop Profiles │
        │  Against Real Rules  │
        └──────────┬───────────┘
                   │
                   ▼
        ┌──────────────────────┐
        │  Explore Charts &    │
        │      Insights        │
        └──────────┬───────────┘
                   │
                   ▼
        ┌──────────────────────┐
        │  Plan, Allocate, and │
        │    Export a Report   │
        └──────────────────────┘
AgriSense connects geographic exploration, environmental analysis, and planning into one continuous workflow.
✨ Key Features
| Feature | Description |
|---|---|
| 🗺️ Earth Explorer | Explore locations and manage custom agricultural regions on an interactive map. |
| 🛰️ Satellite Data | Read real Sentinel-2 imagery and NASA MODIS layers to inspect land conditions. |
| 🌿 Vegetation Analysis | Compute NDVI in-browser from Sentinel-2 red and near-infrared bands. |
| 🌱 Crop Profiles | Explore 68 crop profiles and the conditions each one needs. |
| 🧪 Crop Suitability | Score every crop against water, climate, season, pH, and texture rules. |
| 🌧️ Weather & Water | Explore precipitation, temperature, ET0, and water balance. |
| 🧱 Soil Insights | Review SoilGrids properties, texture, and depth for the selected region. |
| 📊 Regional Analytics | View charts and visualisations anchored to a selected region. |
| 🗓️ Planning Studio | Allocate crops across zones and explore planning scenarios. |
| ⚠️ Risks & Decisions | Review environmental factors, irrigation decisions, and risk guardrails. |
| 📄 Reports | Export a structured, multi-page A4 PDF field report. |
🏗️ How We Built It
AgriSense is a frontend-first application built around one principle:
The data layer should be honest, and the reasoning should be inspectable.
It runs with no API keys and no backend. Satellite imagery is read directly from public Cloud-Optimized GeoTIFFs in the browser.
                    ┌─────────────────────┐
                    │        User         │
                    └──────────┬──────────┘
                               │
                               ▼
              ┌─────────────────────────────────┐
              │        AgriSense UI             │
              │   React + TypeScript + Vite     │
              └────────────────┬────────────────┘
                               │
        ┌──────────────────────┼──────────────────────┐
        ▼                      ▼                      ▼
  ┌───────────┐        ┌─────────────┐        ┌─────────────┐
  │  Earth    │        │   Region    │        │  Planning   │
  │  Explorer │        │  Analytics  │        │   Studio    │
  └─────┬─────┘        └──────┬──────┘        └──────┬──────┘
        │                     │                      │
        └─────────────────────┼──────────────────────┘
                              ▼
                 ┌─────────────────────────┐
                 │    Services Layer       │
                 │ NDVI · Soil · Climate   │
                 │  Rules Engine · Report  │
                 └────────────┬────────────┘
                              │
                              ▼
                 ┌─────────────────────────┐
                 │   Public Data Sources   │
                 │ Sentinel-2 · SoilGrids  │
                 │ Open-Meteo · GIBS · OSM │
                 └─────────────────────────┘
🖥️ Frontend
React 18 with strict TypeScript, Vite, Tailwind CSS, and shadcn/ui components on Radix primitives. MapLibre GL JS 5 renders the map, Recharts the charts, Framer Motion the transitions, Zustand holds state, TanStack Query handles data fetching, and jsPDF builds reports.
Feature folders live under src/features/*, domain logic in src/services/*, and typed contracts in src/types.
🛰️ The Satellite Pipeline
The most interesting engineering in AgriSense is that vegetation analysis runs entirely client-side.
Sentinel-2 L2A imagery is published as Cloud-Optimized GeoTIFFs — internally tiled, with a header index that lets a client fetch only the byte ranges it needs. Instead of downloading a full scene, the browser requests a few hundred kilobytes and decodes it with geotiff.js.
NDVI is then computed from the near-infrared and red surface-reflectance bands:
$$ \text{NDVI} = \frac{\rho_{NIR} - \rho_{Red}}{\rho_{NIR} + \rho_{Red}} $$
where (\rho_{NIR}) is band B08 and (\rho_{Red}) is band B04. Values range from (-1) to (+1), with higher values indicating denser, healthier vegetation.
Because the pixels arrive in the scene's native projection, each sample is reprojected to WGS84 with proj4 before it can be placed on the map.
Field area is computed from the drawn boundary ring using the shoelace formula:
$$ A = \frac{1}{2}\left|\sum_{i=1}^{n}\left(x_i y_{i+1} - x_{i+1} y_i\right)\right| $$
with the ring closed by setting ((x_{n+1}, y_{n+1}) = (x_1, y_1)).
🌱 The Rules Engine
Crop suitability is deterministic and auditable — no black box.
Sixty-eight crop profiles, spanning cereals, pulses, oilseeds, vegetables, roots, and fodder, are scored against five weighted factors. The weights are fixed and published so any result can be reproduced:
$$ S = 0.28\,w_{\text{water}} + 0.24\,w_{\text{climate}} + 0.20\,w_{\text{season}} + 0.16\,w_{\text{pH}} + 0.12\,w_{\text{texture}} $$
A score at or above (0.72) is recommended; at or above (0.50) it is conditional. Every crop is evaluated against real water, soil, climate, and seasonal rules before any language model is involved.
📄 The Report
A field report is assembled into a real multi-page A4 PDF (595.28 pt portrait) with field identity, coordinates, environmental findings, data sources, and an explicit limitations section.
🌐 Working With Real Data
Honesty is the design principle AgriSense is built around. The platform distinguishes four kinds of value:
| Kind | Meaning |
|---|---|
| Observed | Retrieved from a real data source, with source, timestamp, unit, and resolution attached. |
| Derived | Computed from observations — for example, NDVI from reflectance bands. |
| Illustrative | Produced by a planning or scenario model, and labelled as such. |
| Unavailable | Could not be retrieved, or does not cover the selected region. |
This distinction matters because a missing observation is not evidence that a condition does not exist.
Two rules follow, and both are enforced in code:
- A missing reading is represented as
null— never imputed as0. - A service failure is never reported as a measured zero. When a source cannot be reached, the interface says so.
Where analytics values are generated rather than measured, they are derived deterministically from the region's own geometry through a seeded pseudo-random function:
const rnd = seeded(seedOf(centroid, areaM2));
The same field therefore always produces the same numbers — reproducible, not random — and the workspace labels them as demonstration data. The illustrative planning metrics carry an explicit "not a verified result" note.
🧩 Challenges We Ran Into
1. Software GL broke our only way to verify the globe
The build environment runs ANGLE/SwiftShader, a software GL stack. The MapLibre globe projection rendered correctly, but every screenshot of the WebGL canvas came back black — it looked like total failure and wasn't.
We had to verify globe rendering through an in-page canvas.drawImage readback and pixel histogram instead of trusting screenshots. The lesson: when your observation channel is broken, don't conclude the subject is broken — find a second channel.
2. React StrictMode silently cancelled our NDVI fetches
StrictMode double-invokes effects: mount, unmount, remount. Our analysis runner started a fetch on first mount, had it aborted by the cleanup, and then a one-shot guard prevented the remount from re-running it. Vegetation data never appeared.
The fix was to key the effect on field.id and remove the guard — the remount must re-run, or the fetches are never issued.
3. A single CSS class broke the layout
A dead empty strip appeared to the right of the region panel. Probing with headless Chromium showed document.scrollWidth at 2225px against a 1920px viewport — horizontal overflow. The cause was a separator element inheriting w-full inside a flex row, forcing the whole document wider than the screen. One width class fixed it.
4. Keeping crop points inside the field
Crop-profile points had to sit inside the drawn polygon and never leak outside it. We generate a bounding-box grid and clip it with a point-in-polygon test, assigning categories via a spatial hash so the legend and filters stay stable while panning.
5. Making demonstration data that cannot be mistaken for measurement
A demo needs charts, but charts need values — and AgriSense's whole premise is not inventing them. We resolved this by making the demo values deterministic functions of the region's geometry, and labelling them at every level: the workspace, the sample region badge, and the individual metric cards.
🏆 Accomplishments We're Proud Of
- Real Sentinel-2 NDVI computed in-browser from Cloud-Optimized GeoTIFFs over HTTP range requests — no server, no proxy
- A transparent 68-crop rules engine with published weights and reproducible scoring
- A multi-page A4 PDF report carrying sources and limitations
- A fully keyless stack that runs with no backend and no credentials
- Demonstration data that is labelled, deterministic, and impossible to mistake for measurement
- One consistent visual identity across map, analytics, and planning screens
🧠 What We Learned
Honesty is an engineering discipline, not a disclaimer.
It is easy to write "results are illustrative" in small grey text. It is much harder to design a system where the data model itself makes dishonesty difficult — where a missing reading has no valid representation other than missing, and where a demo value carries its own provenance.
A great deal can run client-side.
Reading satellite COGs, reprojecting pixels, computing NDVI, scoring 68 crops, and generating a PDF all happen in the browser. That is a genuinely different deployment story from "send it to a Python box."
Transparency has to be designed in.
Publishing the factor weights felt like over-sharing at first. It turned out to be the feature — a user can see why a crop was recommended, not just that it was.
Distrust your own tools.
Both the globe bug and the StrictMode bug looked like one thing and were another. The fix was always a better observation, not a faster guess.
🚀 What's Next
- 🔌 Wire the analytics to a live agronomic API so demonstration values can be replaced rather than layered over
- 🌾 Expand crop coverage beyond 68 profiles and add regional calibration
- 📈 Add multi-field comparison and season-over-season tracking
- 📶 Offline-first field capture for poor-connectivity areas
- 🛰️ Extend the satellite pipeline to longer time-series for change detection
🌍 Our Vision
We believe agricultural technology should make environmental information more accessible — and more honest.
The goal is not to show more maps or more data. It is to help users understand what the available data says about a region, what remains uncertain, and how that can support better planning.
Explore the land. Understand the data. Plan with insight.
AgriSense — Smarter agricultural decisions through real-world data.
Built With
- copernicus
- gis
- jspdf
- maplibre-gl-js
- nasa-gibs
- ndvi
- open-meteo
- openstreetmap
- react
- recharts
- remote-sensing
- sentinel-2
- shadcn/ui
- soilgrids
- tailwind-css
- tanstack-query
- typescript
- vite
- zustand